. 2022 Jan 2;10(1):1963143.
doi: 10.1080/21688370.2021.1963143. Epub 2021 Sep 18.

DCE-MRI of Brain Fluid Barriers: In Vivo Water Cycling at the Human Choroid Plexus

Affiliations

DCE-MRI of Brain Fluid Barriers: In Vivo Water Cycling at the Human Choroid Plexus

Valerie C Anderson et al. Tissue Barriers. .

Abstract

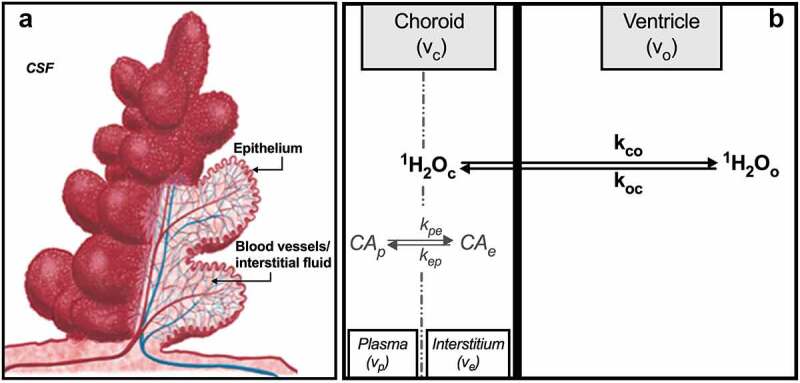
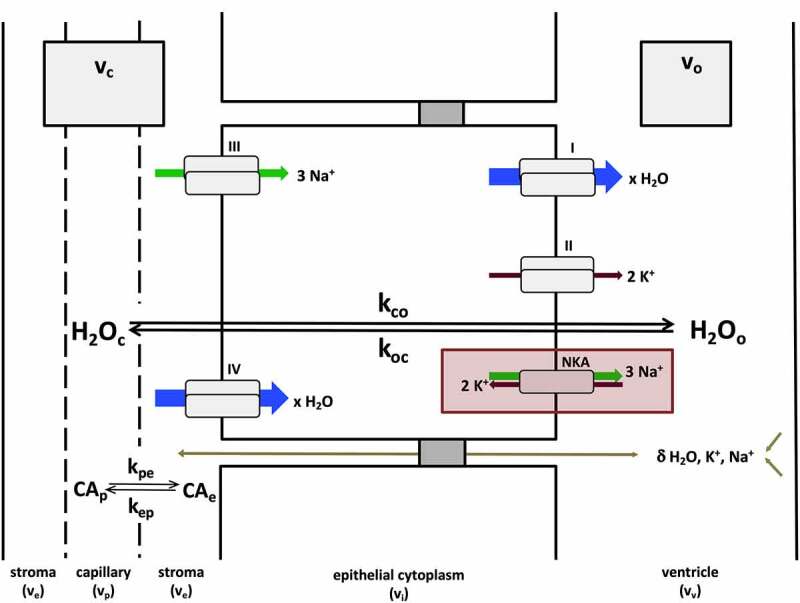
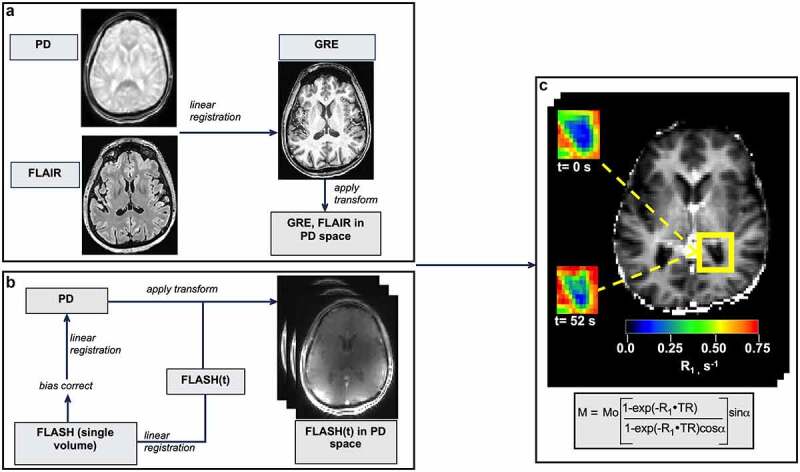
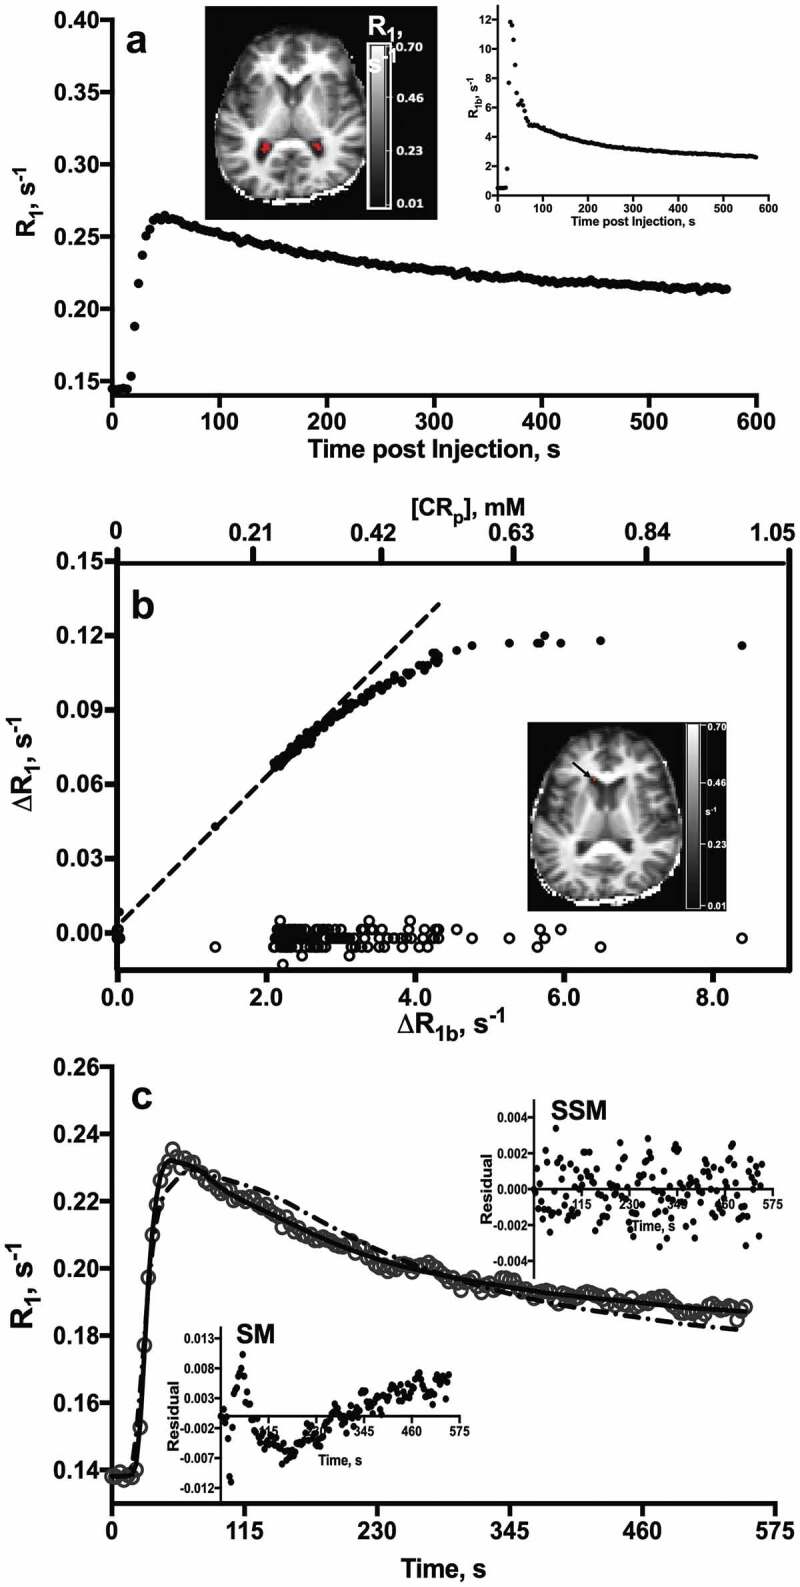
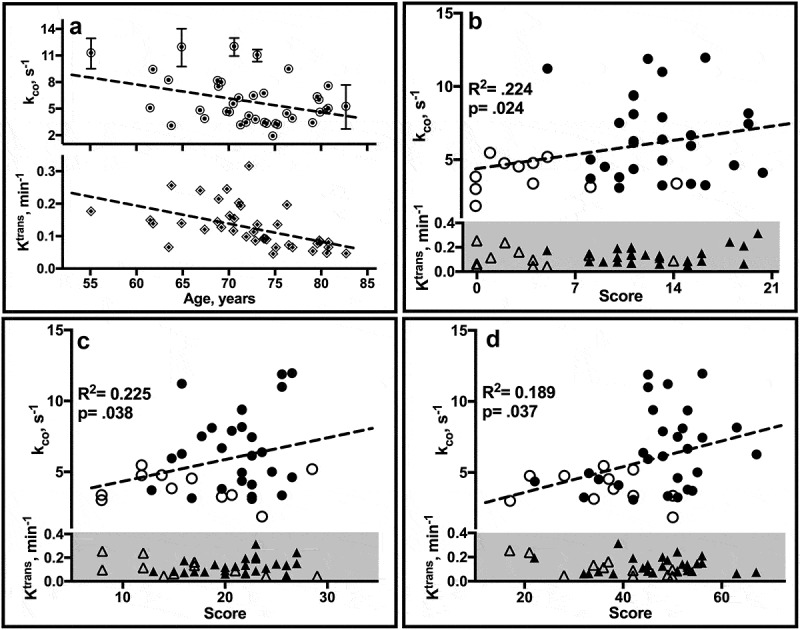
Metabolic deficits at brain-fluid barriers are an increasingly recognized feature of cognitive decline in older adults. At the blood-cerebrospinal fluid barrier, water is transported across the choroid plexus (CP) epithelium against large osmotic gradients via processes tightly coupled to activity of the sodium/potassium pump. Here, we quantify CP homeostatic water exchange using dynamic contrast-enhanced MRI and investigate the association of the water efflux rate constant (kco) with cognitive dysfunction in older individuals. Temporal changes in the longitudinal relaxation rate constant (R1) after contrast agent bolus injection were measured in a CP region of interest in 11 participants with mild cognitive dysfunction [CI; 73 ± 6 years] and 28 healthy controls [CN; 72 ± 7 years]. kco was determined from a modified two-site pharmacokinetic exchange analysis of the R1 time-course. Ktrans, a measure of contrast agent extravasation to the interstitial space was also determined. Cognitive function was assessed by neuropsychological test performance. kco averages 5.8 ± 2.7 s-1 in CN individuals and is reduced by 2.4 s-1 [ca. 40%] in CI subjects. Significant associations of kco with global cognition and multiple cognitive domains are observed. Ktrans averages 0.13 ± 0.07 min-1 and declines with age [-0.006 ± 0.002 min-1 yr-1], but shows no difference between CI and CN individuals or association with cognitive performance. Our findings suggest that the CP water efflux rate constant is associated with cognitive dysfunction and shows an age-related decline in later life, consistent with the metabolic disturbances that characterize brain aging.

Keywords: Blood-CSF barrier; DCE-MRI; Na+/K+-ATPase; choroid plexus; water transport.


Conflict of interest statement

No potential conflict of interest was reported by the author(s).

Figures

Figure 1.
Figure 1.
(a) Schematic representation of the CP unit. A single layer of cuboidal epithelial cells is folded into numerous small villi, each with a fluid-filled core of connective tissue richly supplied by blood vessels. Adapted from Oreskovic, with permission. (b) Compartments of the CP with chemical equilibria and unidirectional rate constants defined per text. Volumes shown do not reflect relative volume fraction. This illustration is elaborated further in Figure 2.
Figure 2.
Figure 2.
General mechanisms of CP steady-state water exchange. Most water flux at the CP (shown here with unidirectional rate constants kco and koc) is synchronized to the kinetics of NKA-dependent exchange of Na+ and K+ ions at the apical cell membrane (red rectangle). Pathways I–IV describe secondary active processes contributing to water, Na+ and K+ transport (blue, green and brown arrows, respectively) into or out of the cell. These include, but are not limited to, substrate (e.g., Na+, K+, Cl, glucose) coupled co-transport of water at the apical (i) and basolateral (IV) membranes, potassium channels (II), some of which are voltage-gated (KCC4, Kv1.1, Kv1.4, Kir7.1), and Na+-coupled bicarbonate transporters (III) (e.g., NCBE, NBCe2). The arrow size of pathways I–IV is meant to convey the relative contribution of each to the overall flux, but is not quantitatively to scale. Paracellular transport, via claudin-2 pores or ependymal drainage of interstitial fluid, also contributes to water and ion fluxes, but likely represents a relatively minor contribution. These routes (olive arrow) are indicated with a δ.
Figure 3.
Figure 3.
Image processing. (a) Brain-extracted high-resolution T1-w GRE and FLAIR images were bias field corrected, co-registered and brought into PD space. (b) Dynamic FLASH volumes were first registered to the image at the temporal center of the acquisition. In a second step, this skull-stripped, bias-corrected image was registered to the PD image and the transform applied to each volume in the FLASH series. (c) A representative R1(t) map, prepared by fitting dynamic FLASH volumes to the GRE signal intensity equation (shown in rectangle). Insets: R1 maps of the posterior horn (outlined in yellow) before (upper) and 52 seconds after (lower) CA injection. CP-containing voxels show a clear R1 increase after CA arrival.
Figure 4.
Figure 4.
Representative CP R1(t) behavior. (a) Time-course of CP ROI (19 voxels; 0.38 mL) R1 values after CA injection in a 64 year-old CN subject. R1 map (upper left) shows the ROI (red) from which data were obtained. R1 values in the sagittal sinus (R1b) are plotted at upper right. (b) Time-course of R1 changes (ΔR1) in the CP (∙) and CSF (o) after CA arrival. Plasma CA concentration, [CAp], is shown along the upper axis. Inset: R1 map. Arrow shows the ROI from which CSF R1 values were measured. (c) Fittings of SSM (_, Eqn. [1]) and SM (– -, Eqns. [2] and [3]) models to the CP R1 time-course from a 77 year-old CI subject. Insets: Residual plots from SSM (upper) and SM (lower) model fittings. Note the randomness and constant spread of residuals about the horizontal y = 0 line and more negative minimum of the AIC in the SSM fitting.
Figure 5.
Figure 5.
Estimate correlates. (a) Linear regression plots of individual ROI estimates of kco (↑ upper) and Ktrans (◊, lower) by age. Error bars, not all of which are visible on the scale of the plots, reflect SD. (b-d) Plots of mean kco and Ktrans values by neuropsychological test score in CN (filled) and CI (open) individuals. WMS-R Logical Memory II (b) tests verbal recall of a short story after a 30-minute delay. The score is the number of story units recalled, ranging from 0 to 25. The category fluency task (c) requires subjects to name as many unique animals as possible within 1 minute. The SDMT (d) requires subjects to match symbols to numbers according to a provided key. The score is the number of correct matches made in 90 sec. R2, F statistic and p (group) from age-adjusted linear regression analyses are shown.

Similar articles

Cited by

References

    1. Strazielle N, Ghersi-Egea JF.. Physiology of blood-brain interfaces in relation to brain disposition of small compounds and macromolecules. Mol Pharm. 2013;10(5):20–34. DOI:10.1021/mp300518e. - DOI - PubMed
    1. Johanson CE, Keep RF.. Blending established and new perspectives on choroid plexus-CSF dynamics. In: Praetorius J, Blazer-Yost B, Damkier H, editors. Role of the choroid plexus in health and disease. New York (NY): Springer; 2020. p. 35–81.
    1. Oreskovic D, Rados M, Klarica M. Role of the choroid plexus in cerebrospinal fluid hydrodynamics. Neuroscience. 2017;354:69–87. DOI:10.1016/j.neuroscience.2017.04.025. - DOI - PubMed
    1. Cornford EM, Varesi JB, Hyman S, Damian RT, Raleigh MJ. Mitochondrial content of choroid plexus epithelium. Exp Brain Res. 1997;116(3):399–405. DOI:10.1007/PL00005768. - DOI - PubMed
    1. Baehr C, Reichel V, Fricker G. Choroid plexus epithelial monolayers- a cell culture model from porcine brain. Cerebrospinal Fluid Res. 2006;3(1):13. DOI:10.1186/1743-8454-3-13. - DOI - PMC - PubMed

Publication types

LinkOut - more resources