. 2021 Sep 20:10:e68054.
doi: 10.7554/eLife.68054.

SMA-miRs (miR-181a-5p, -324-5p, and -451a) are overexpressed in spinal muscular atrophy skeletal muscle and serum samples

Affiliations

SMA-miRs (miR-181a-5p, -324-5p, and -451a) are overexpressed in spinal muscular atrophy skeletal muscle and serum samples

Emanuela Abiusi et al. Elife. .

Abstract

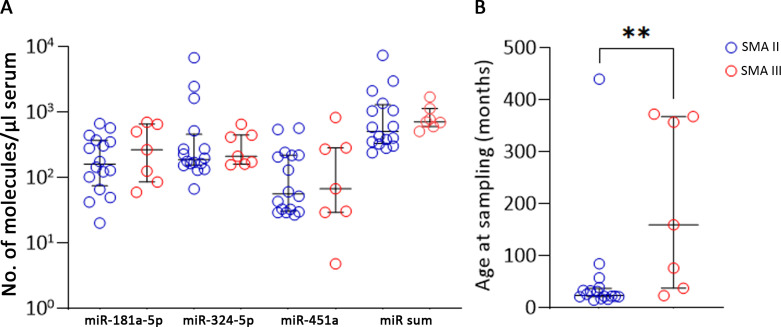
Background: Spinal muscular atrophy (SMA) is a neuromuscular disorder characterized by the degeneration of the second motor neuron. The phenotype ranges from very severe to very mild forms. All patients have the homozygous loss of the SMN1 gene and a variable number of SMN2 (generally 2-4 copies), inversely related to the severity. The amazing results of the available treatments have made compelling the need of prognostic biomarkers to predict the progression trajectories of patients. Besides the SMN2 products, few other biomarkers have been evaluated so far, including some miRs.

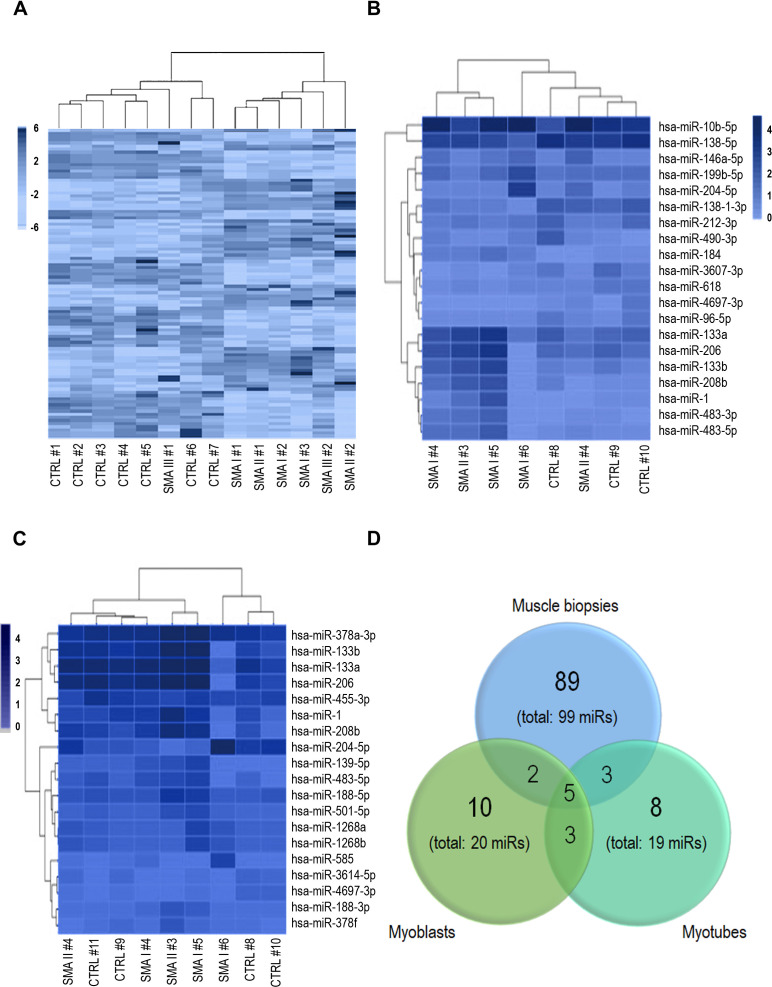
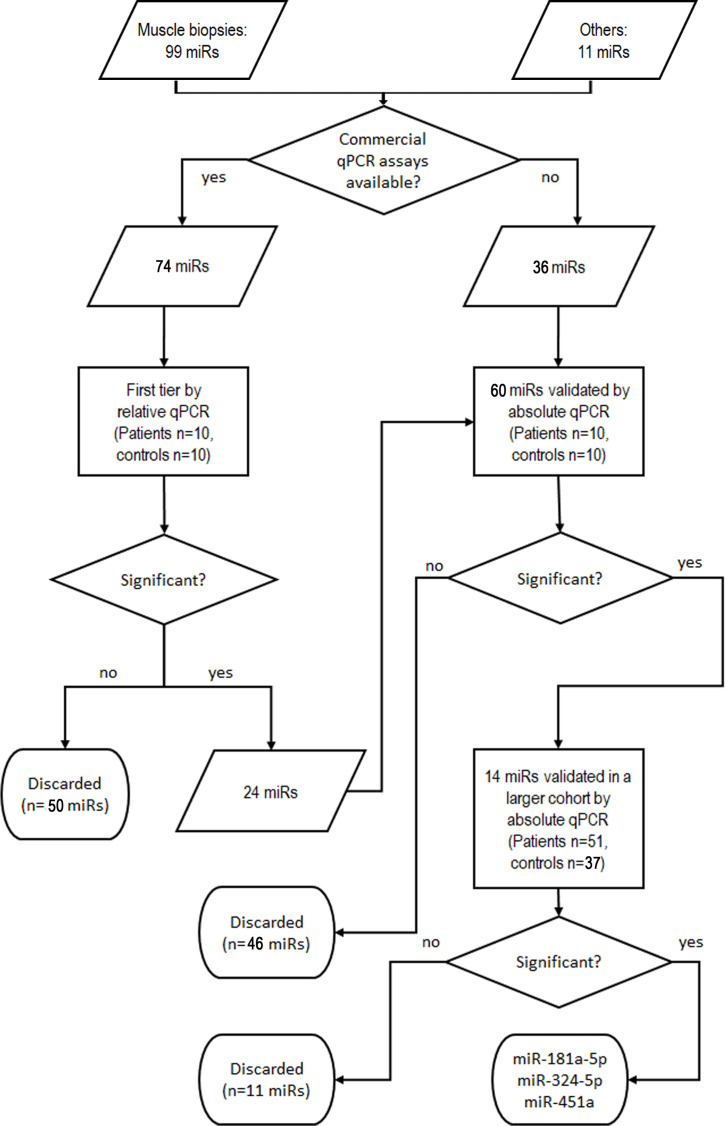
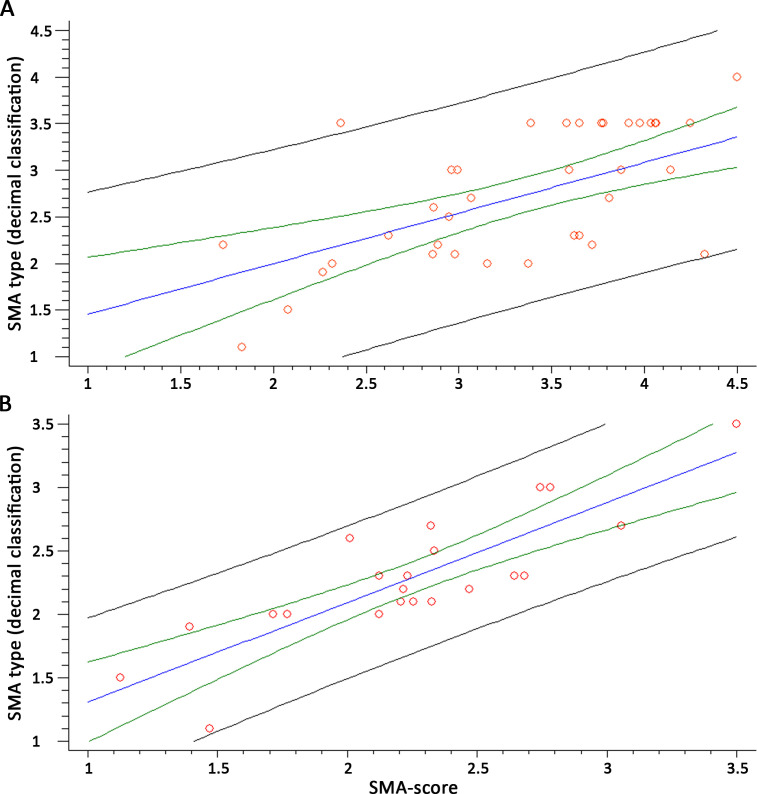
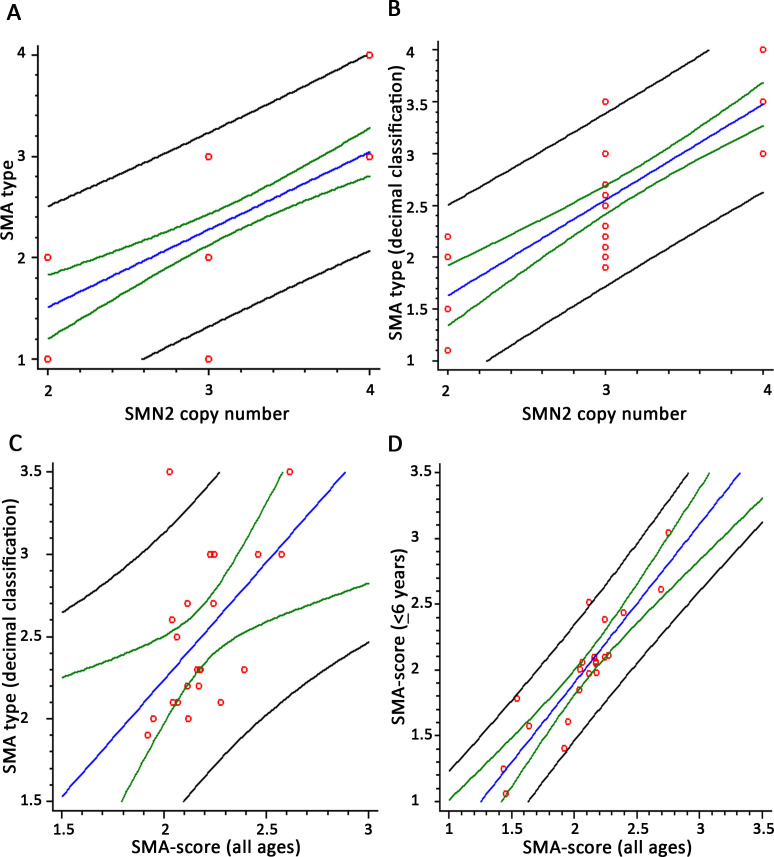
Methods: We performed whole miRNome analysis of muscle samples of patients and controls (14 biopsies and 9 cultures). The levels of muscle differentially expressed miRs were evaluated in serum samples (51 patients and 37 controls) and integrated with SMN2 copies, SMN2 full-length transcript levels in blood and age (SMA-score).

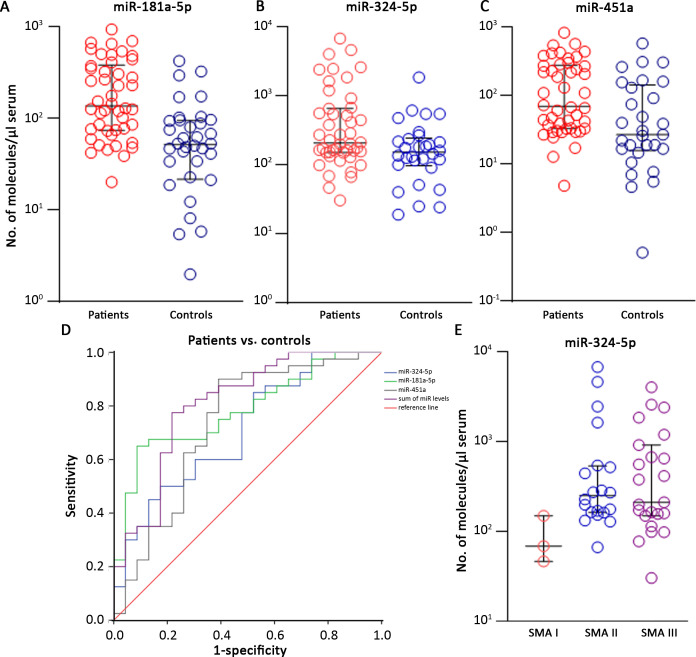
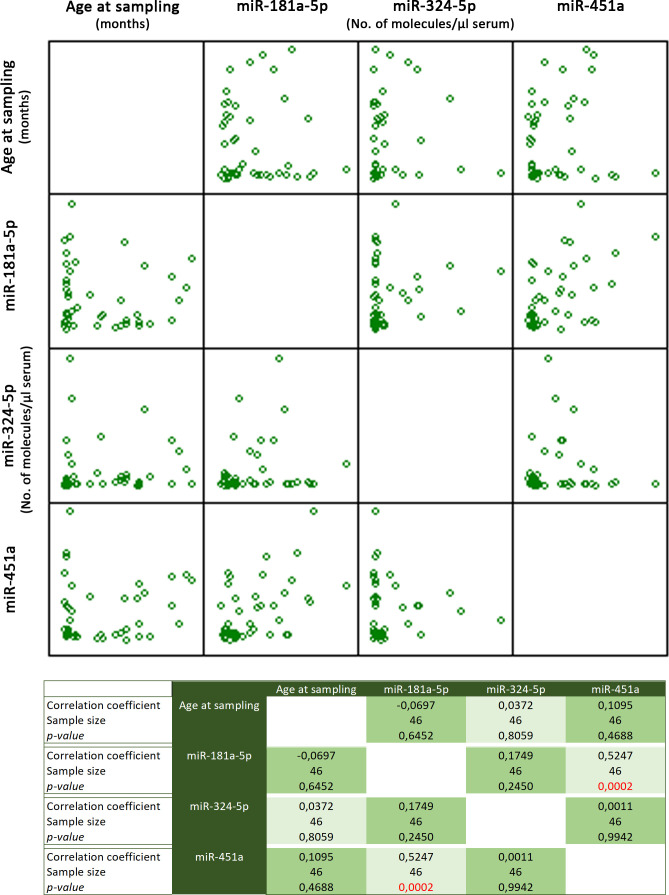
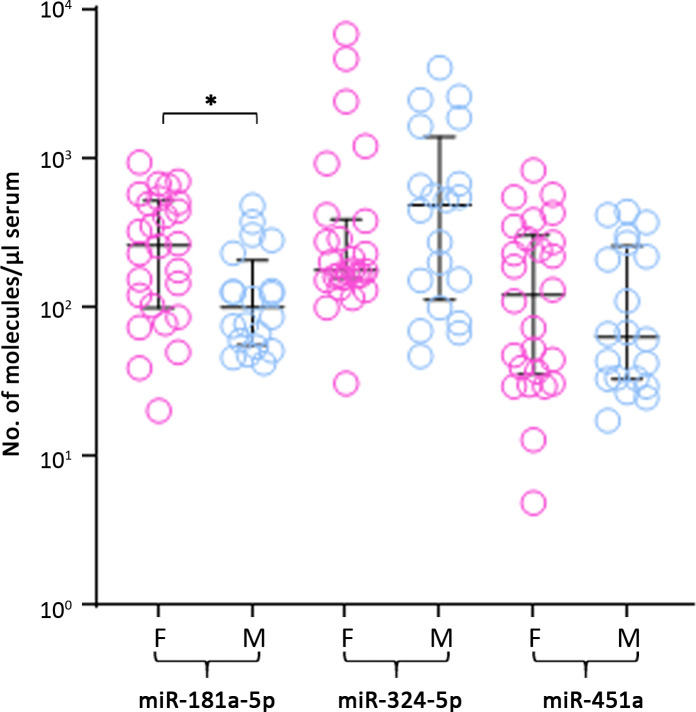
Results: Over 100 miRs were differentially expressed in SMA muscle; 3 of them (hsa-miR-181a-5p, -324-5p, -451a; SMA-miRs) were significantly upregulated in the serum of patients. The severity predicted by the SMA-score was related to that of the clinical classification at a correlation coefficient of 0.87 (p<10-5).

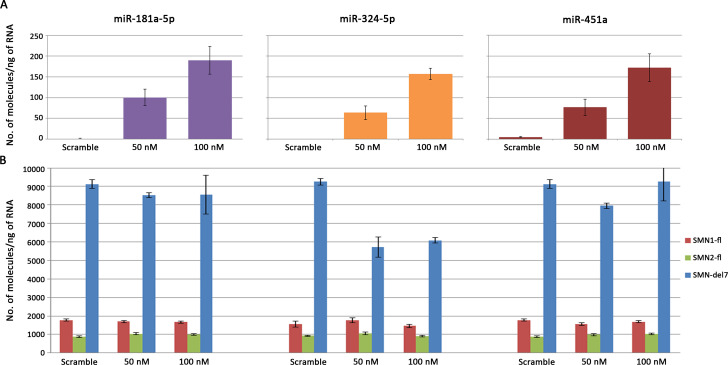
Conclusions: miRNome analyses suggest the primary involvement of skeletal muscle in SMA pathogenesis. The SMA-miRs are likely actively released in the blood flow; their function and target cells require to be elucidated. The accuracy of the SMA-score needs to be verified in replicative studies: if confirmed, its use could be crucial for the routine prognostic assessment, also in presymptomatic patients.

Funding: Telethon Italia (grant #GGP12116).

Keywords: SMN1; biomarker; genetics; genomics; human; mRNA; medicine; miRNA; mouse; skeletal muscle; spinal muscular atrophy.


Conflict of interest statement

EA, PI, CC, LL, MP, GC, MP, AD, FD, AN, SS, SF, GB, IM, MM, MP, KP, LL, LT, FR, CB, DL, EB, LM, EM, LD, FT No competing interests declared, DD Davide D'Amico is affiliated with Amazentis SA. The author has no financial interests to declare. At the time of study developement, Dr. D'Amico had an academic affiliation

Figures

Figure 1.
Figure 1.. Heatmaps obtained by the whole miRNome analysis of muscle biopsies (A), myoblasts (B), and myotubes (C) of spinal muscular atrophy (SMA) patients and controls; patient and control samples display a separate clusterization.
99, 20, and 19 miRs were found deregulated in SMA in muscle biopsies, myoblasts, and myotubes, respectively; (D) Venn’s diagram showing the five miRNAs shared among the three groups, three between myoblasts and myotubes, two between myoblasts and biopsies, and three between myotubes and biopsies.
Figure 2.
Figure 2.. Validation pipeline of miRNAs identified by whole miRNome analysis in serum samples of patients and controls.
‘Others’ indicates miRs that were identified in other studies or with key function in skeletal muscle.
Figure 3.
Figure 3.. The SMA-miRs (miR-181a-5p [A], miR-324-5p [B] and miR-451a [C]) were significantly upregulated in serum samples of spinal muscular atrophy (SMA) patients (p=4.3 * 10–4; 0.02; 0.004, respectively).
Receiver operating characteristic (ROC) curves showed that the quantification of SMA-miRs has 80% sensitivity and 75% specificity in distinguishing patients from controls (D). Correlation of miR-324-5p with SMA type (E): the levels in SMA II and SMA III patients were significantly increased compared to those of SMA I patients (p=0.03 and 0.04, respectively).
Figure 3—figure supplement 1.
Figure 3—figure supplement 1.. Multiple variable correlation of miR-181a-5p, -324-5p, and -415a levels and age at sampling.
In red, the only significant correlation, between miR-181a-5p and miR-451a (p=0.0002).
Figure 3—figure supplement 2.
Figure 3—figure supplement 2.. Comparison of levels of miR-181a-5p, -324-5p, and -451a in male and female patients; only miR-181a-5p showed a significant difference in females compared to males (*p=0.024).
Figure 3—figure supplement 3.
Figure 3—figure supplement 3.. Analysis of type II and III patients with three SMN2 copies; the two groups were not different for miRs levels (p>0.05, A) but showed a significant difference in age (**p=0.0092, B).
Figure 3—figure supplement 4.
Figure 3—figure supplement 4.. Transfections of SH-SY5Y neuroblastoma cells with SMA-miR mimics (final concentration: 50 or 100 nM).
In spite of the huge increase in SMA-miR levels (A), SMN1/SMN2 transcripts remained unchanged, except for the SMNΔ7 isoform in cells treated with miR-324-5p, which was reduced by 50%, independently of the mimic concentration (B).
Figure 4.
Figure 4.. Survival curves of SMNΔ7-mice treated with intrathecal injection of anti-miR-181a-5p (n = 36) and untreated (n = 71); the overall survival remained unchanged (p>0.05).
Figure 4—figure supplement 1.
Figure 4—figure supplement 1.. SMNΔ7 mice treated with anti-miR-324-5p showed a significant transient increase in body weight, between P7 and P10 (p=0.002).
Figure 5.
Figure 5.. The spinal muscular atrophy score (SMA-score) predicts the phenotypic severity in SMA patients.
Correlation between the SMA-score and the clinical decimal SMA subtype in the whole cohort (A) and aged <6 years (B). Red circles are individual samples, the blue line indicates the expected distribution, the green line indicates the 95% confidence interval, and the black lines are the prediction interval.
Figure 5—figure supplement 1.
Figure 5—figure supplement 1.. Linear correlation analysis among SMN2 copy number and spinal muscular atrophy (SMA) type, estimated by the standard classification (A; R2 = 52.45%, n = 41, p<10–5) and the decimal classification (B; R2 = 67.04%, n = 39, p<10-5).
Correlation with SMA-score and SMA type estimated by the decimal classification in patients with three SMN2 copies (C; R2 = 30.04, n = 21, p=0.008). Linear correlation analysis among SMA-scores obtained with the two equations (all ages vs. <6 years) (D; R2 = 80.31, n = 21, p<10-5). Red circles are individual samples, the blue line indicates the expected distribution, the green line indicate the 95% confidence interval, and the black lines are the prediction interval.

References

    1. Alves CRR, Zhang R, Johnstone AJ, Garner R, Nwe PH, Siranosian JJ, Swoboda KJ. Serum creatinine is a biomarker of progressive denervation in spinal muscular atrophy. Neurology. 2020;94:e921–e931. doi: 10.1212/WNL.0000000000008762. - DOI - PMC - PubMed
    1. Angelozzi C, Borgo F, Tiziano FD, Martella A, Neri G, Brahe C. Salbutamol increases SMN mRNA and protein levels in spinal muscular atrophy cells. Journal of Medical Genetics. 2008;45:29–31. doi: 10.1136/jmg.2007.051177. - DOI - PubMed
    1. Bartel DP. MicroRNAs: target recognition and regulatory functions. Cell. 2009;136:215–233. doi: 10.1016/j.cell.2009.01.002. - DOI - PMC - PubMed
    1. Beattie CE, Kolb SJ. Spinal muscular atrophy: Selective motor neuron loss and global defect in the assembly of ribonucleoproteins. Brain Research. 2018;1693:92–97. doi: 10.1016/j.brainres.2018.02.022. - DOI - PubMed
    1. Benigni M, Ricci C, Jones AR, Giannini F, Al-Chalabi A, Battistini S. Identification of miRNAs as Potential Biomarkers in Cerebrospinal Fluid from Amyotrophic Lateral Sclerosis Patients. Neuromol Med. 2016;18:551–560. doi: 10.1007/s12017-016-8396-8. - DOI - PubMed

Publication types