. 2021 Sep 1;21(10):15.
doi: 10.1167/jov.21.10.15.

Binocularly-driven competing neural responses and the perceptual resolution of color

Affiliations

Binocularly-driven competing neural responses and the perceptual resolution of color

Bobicheng Zhang et al. J Vis. .

Abstract

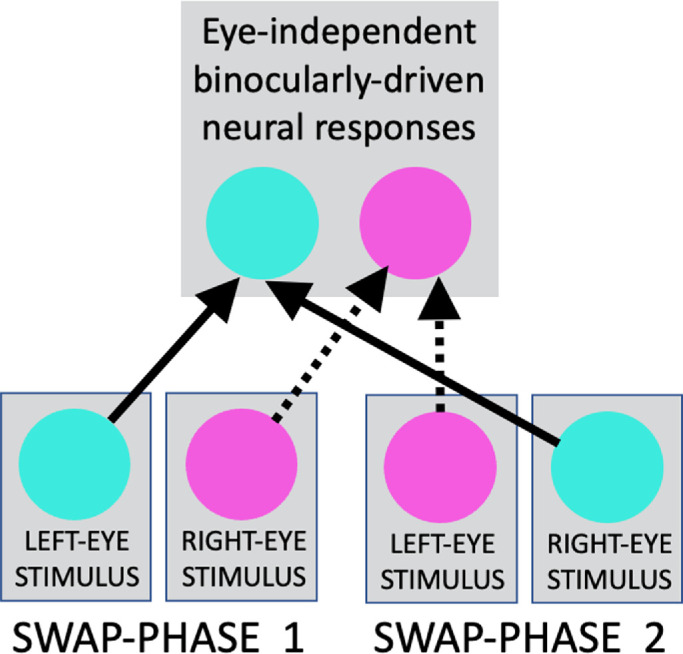
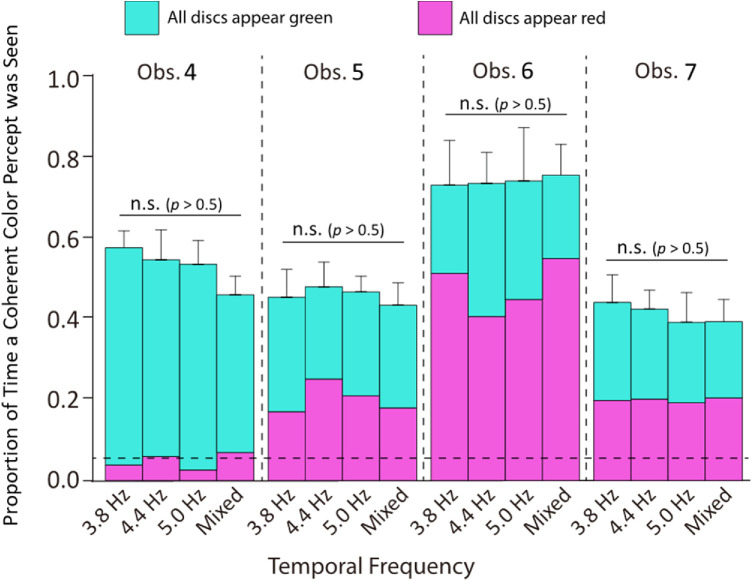
Competing rivalrous neural representations can be resolved at several levels of the visual system. Sustained percepts during interocular-switch rivalry (ISR), in which rivalrous left- and right-eye stimuli swap between eyes several times a second, often are attributed to competing binocularly driven neural representations of each rivalrous stimulus. An alternative view posits monocular neural competition together with a switch in eye dominance at the moment of each stimulus swap between eyes. Here, a range of experimental conditions was tested that would change the colors seen if mediated by eye dominance but not if by competition between binocularly driven responses. Observers viewed multiple chromatically rivalrous discs in various temporal and spatial patterns, and reported when all discs in view appeared the same color. Unlike typical ISR paradigms that swap the complete stimulus in each eye, some of the rivalrous discs were swapped at a different time, or faster frequency, than other discs. Monocular dominance of one eye at a time implies that all discs will rarely be seen as identical in color when some discs swap at a different frequency than others. On the other hand, competing binocularly driven neural responses are not affected by asynchronous swap timing among the individual discs. Results for every observer are in accord with competing responses at the level of binocularly driven, chromatically tuned neurons. Although an account based on eye dominance can be constructed using many small retinotopic zones that have independent timing for the moment of switching the dominant eye, competing binocularly driven responses are a more parsimonious explanation.


Figures

Figure 1.
Figure 1.
(Below) A dichoptic stimulus with rivalrous chromaticities in the two eyes. During chromatic interocular switch rivalry, the two chromaticities swap between the two eyes several times each second (that is, the eyes’ stimuli alternate rapidly between “SWAP-PHASE 1” and “SWAP-PHASE 2”). (Above) Two chromatically selective, binocularly driven neurons respond to different stimulus chromaticities that fall in the same retinotopic area of either eye. The swapping dichoptic stimuli (below) create continuous, competing responses for both chromaticities (solid and dashed lines with arrows) despite the rapid chromaticity swaps between the eyes.
Figure 2.
Figure 2.
(A) Sixteen chromatic discs in conventional arrays. All discs presented to one eye at any given time have the same chromaticity. (B) Patchwork arrays. Discs of two different chromaticities are presented to each eye at any given time, always with chromatic rivalry at each retinotopic location (after Slezak & Shevell, 2018).
Figure 3.
Figure 3.
The haploscope. The black rectangle represents the CRT display (not to scale). The thin solid black lines represent mirrors and the dashed lines show light paths. The solid thick horizontal line represents an opaque panel that blocks stray light reflection. The left half of the screen is seen by only the left eye and the right half by only the right eye. The fused percept at the bottom includes all four Nonius lines.
Figure 4.
Figure 4.
(A) Stimuli used in a condition with two dichoptic discs (180 degrees phase difference shown). (B) Two possible coherent color percepts (same perceived color above and below fixation). (C) Schematic of the CISR paradigm with the top and bottom discs swapping chromaticity (only the left-eye stimuli are shown). The bottom disc could oscillate at 0 degrees, 90 degrees, 180 degrees, or 270 degrees temporal phase difference relative to the top disc. Vertical dashed red lines illustrate the phase difference between the top and bottom discs. Note that at 0 degrees the stimuli were in conventional arrays and at 180 degrees in patchwork arrays. At 90 and 270 degrees phases, discs in each eye were in conventional arrays for half of each swap cycle and patchwork arrays for half of each swap cycle.
Figure 5.
Figure 5.
Average proportion of total dominance time when two discs appeared the same color when swapped with a 0 degree (conventional arrays), 90 degrees, 180 degrees (patchwork arrays), or 270 degrees temporal phase difference. For each observer, results are shown separately for three different swap frequencies: 3.13, 3.75, and 4.69 Hz (horizontal axis). Each bar indicates the proportion of total dominance time averaged over the two pairs of chromaticities tested.
Figure 6.
Figure 6.
Apertures with 30 discs in conventional arrays used in the preliminary conditions. (A) Example stimuli presented above fixation. (B) The two coherent color percepts. The duration of seeing these percepts was measured and converted to a proportion of the 60-second viewing time.
Figure 7.
Figure 7.
Proportion of time with all 30 discs appearing red or all 30 appearing green during 60 seconds of viewing time (vertical axis), for each of four observers. For each observer, the three bars starting from the left are measurements from the preliminary conditions run with conventional arrays at different eye-swap temporal frequencies (3.8, 4.4, or 5.0 Hz; horizontal axis). The rightmost bar for each observer shows measurements from the multiple-frequency-swap “main experiment” (labeled “Mixed” on horizontal axis). The dashed horizontal line shows the chance level assuming independence (see text).
Figure 8.
Figure 8.
A schematic multiple-frequency dichoptic stimulus presented above the fixation point (+). Discs presented to one eye usually were a mix of two different chromaticities. The opposite eye always had the other chromaticity at each of the 30 locations to maintain continuous chromatic rivalry for all of the discs. This experiment was repeated with the 30 discs presented within a similar aperture below fixation.
Figure 9.
Figure 9.
(A) Schematic of a stimulus configuration with 60 discs presented at a single temporal swap frequency and with patchwork arrays with respect to the discs above and below fixation (above), and the same configuration but with multiple temporal swap frequencies used simultaneously (below; one example of a rapidly changing stimulus is shown). (B) The two coherent percepts (all 60 discs perceived to have the same color) for the measurements in this experiment. The locations of the small discs were randomized on every trial so the ones shown are only examples.
Figure 10.
Figure 10.
Independence prediction for seeing all 60 discs as red: the measured probability of seeing all 30 discs above fixation as red multiplied by the measured probability of seeing all 30 discs below fixation as red. A similar independence prediction was determined for seeing all 60 discs as green.
Figure 11.
Figure 11.
Proportion of time all 60 discs appeared the same color, for each of four observers. For each temporal frequency condition (horizontal axis), the left bar in each adjacent pair represents the two-aperture measurement and the right bar, shown in paler colors, the independence prediction (see text). The measurement was always significantly larger than predicted by independence. A separate contrast for each observer compared the multiple-frequency (“Mixed”) measurement to the single-frequency measurements; there was never a significant difference for any observer. *p < 0.05, **p < 0.01, ***p < 0.001.
Figure 12.
Figure 12.
Dichoptic left- and right-eye stimuli (from Blake & Logothetis, 2002; after Díaz-Caneja, 1928; translated by Alais, O'Shea, Mesana-Alais, & Wilson, 2000). The fused percept is often a full circle filled completely with either red stripes or a green bullseye. Reprinted by permission from Springer Nature.

References

    1. Alais, D., & Blake, R. (1999). Grouping visual features during binocular rivalry. Vision Research, 39(26), 4341–4353. - PubMed
    1. Alais, D., O'Shea, R. P., Mesana-Alais, C., & Wilson, I. G. (2000). On binocular alternation. Perception, 29(12), 1437–1445. - PubMed
    1. Blake, R. (1989). A neural theory of binocular rivalry. Psychological Review, 96(1), 145–167. - PubMed
    1. Blake, R. (2001). A Primer on Binocular Rivalry, Including Current Controversies. Brain and Mind 2, 5–38.
    1. Blake, R., & Logothetis, N. K. (2002). Visual competition. Nature Reviews, Neuroscience, 3, 1–11. - PubMed

Publication types