. 2022 Jan 7;39(1):msab280.
doi: 10.1093/molbev/msab280.

Phenotype Bias Determines How Natural RNA Structures Occupy the Morphospace of All Possible Shapes

Affiliations

Phenotype Bias Determines How Natural RNA Structures Occupy the Morphospace of All Possible Shapes

Kamaludin Dingle et al. Mol Biol Evol. .

Abstract

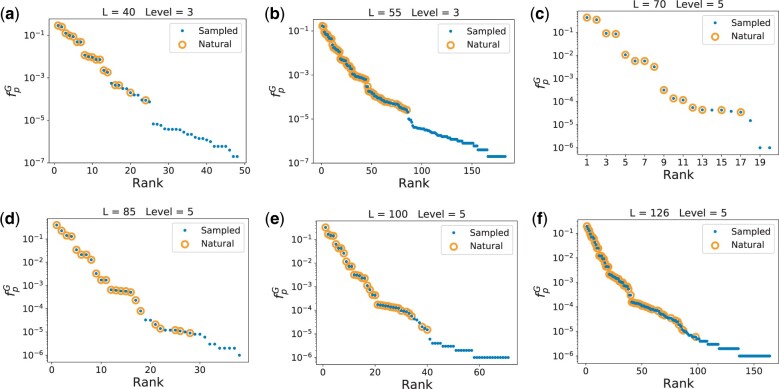
Morphospaces-representations of phenotypic characteristics-are often populated unevenly, leaving large parts unoccupied. Such patterns are typically ascribed to contingency, or else to natural selection disfavoring certain parts of the morphospace. The extent to which developmental bias, the tendency of certain phenotypes to preferentially appear as potential variation, also explains these patterns is hotly debated. Here we demonstrate quantitatively that developmental bias is the primary explanation for the occupation of the morphospace of RNA secondary structure (SS) shapes. Upon random mutations, some RNA SS shapes (the frequent ones) are much more likely to appear than others. By using the RNAshapes method to define coarse-grained SS classes, we can directly compare the frequencies that noncoding RNA SS shapes appear in the RNAcentral database to frequencies obtained upon a random sampling of sequences. We show that: 1) only the most frequent structures appear in nature; the vast majority of possible structures in the morphospace have not yet been explored; 2) remarkably small numbers of random sequences are needed to produce all the RNA SS shapes found in nature so far; and 3) perhaps most surprisingly, the natural frequencies are accurately predicted, over several orders of magnitude in variation, by the likelihood that structures appear upon a uniform random sampling of sequences. The ultimate cause of these patterns is not natural selection, but rather a strong phenotype bias in the RNA genotype-phenotype map, a type of developmental bias or "findability constraint," which limits evolutionary dynamics to a hugely reduced subset of structures that are easy to "find."

Keywords: RNA structure; evolution; morphospace; phenotype bias.


Figures

Fig. 1.
Fig. 1.
(a) Conceptual diagram of the RNA SS shape morphospace: The set of all potentially functional RNA is a subset of all possible shapes. In this article we show that natural RNA SS shapes only occupy a minuscule fraction of the morphospace of all possible functional RNA SS shapes because of a strong phenotype bias which means that only highly probable (high-frequency) shapes are likely to appear as potential variation. We quantitatively predict the identity and frequencies of the natural RNA shapes by randomly sampling sequences for the RNA SS GP map. (b) RNA coarse-grained shapes: An illustration of the dot-bracket representation and five levels of more coarse-grained abstracted shapes for the 5.8 s rRNA (length L =126), a ncRNA. Level 1 abstraction describes the nesting pattern for all loop types and all unpaired regions; level 2 corresponds to the nesting pattern for all loop types and unpaired regions in external loop and multiloop; level 3 is the nesting pattern for all loop types, but no unpaired regions; level 4 is the helix nesting pattern and unpaired regions in external loop and multiloop; and level 5 is the helix nesting pattern and no unpaired regions.
Fig. 2.
Fig. 2.
Nature selects highly frequent structures. The frequency fpG (blue dots) of each abstract shape, calculated by random sampling of sequences (G-sampling), is plotted versus the rank. Yellow circles highlight which of the randomly generated shapes were also found in the RNAcentral database. Panels (af) are for L=40,55,70,85,100,126, respectively. The number of natural shapes are 18, 63, 16, 25, 35, and 68 in order of ascending length, whereas the numbers of possible shapes in the full morphospace are many orders of magnitude larger, ranging from 104 possible level 3 shapes for L =40 to 1012 level 5 shapes for L =126. The shapes in nature are all from remarkably small fraction of possible structures that have the highest fpG or equivalently the highest NSS. The natural shapes found in the database appear upon relatively modest amounts of random sampling of sequences.
Fig. 3.
Fig. 3.
Shape array for L=55 RNA at level 3, showing the 183 shapes found by sampling 5×10⁶ random sequences, in order of their rank by frequency fpG. The 63 naturally occurring level 3 shapes from the RNAcentral database are highlighted in yellow, demonstrating that only a small fraction of the total morphospace of shapes is occupied by RNAs found in nature, and that these are all highly frequent structures. We estimate that there are on the order of 107 possible level 3 structures for L =55 RNA, so that this array only shows a tiny fraction of the total morphospace of shapes.
Fig. 4.
Fig. 4.
The frequency of shapes in nature correlates with the frequency of shapes from random sampling. Yellow circles denote the frequencies fp of natural RNA from RNAcentral. The green line denotes x = y, that is natural and sampled frequencies coincide. The log frequency upon G-sampling fpG correlates well with fp: (a) L =40 Pearson r =0.92; (b) L =55 r =0.93; (c) L =70 r =0.94; (d) L =85 r =0.86; (e) L =100 r =0.95; (f) L =126 r =0.92; and all correlations have P-value<106. We also highlight a blue structure, namely t-RNA for L =70 which has been the subject of extra scientific interest, and is hence overrepresented in the database.

References

    1. Aguirre J, Buldú JM, Stich M, Manrubia SC.. 2011. Topological structure of the space of phenotypes: the case of RNA neutral networks. PLoS One 6(10):e26324. - PMC - PubMed
    1. Ahnert S, Johnston I, Fink T, Doye J, Louis A.. 2010. Self-assembly, modularity, and physical complexity. Phys Rev E Stat Nonlin Soft Matter Phys. 82(2 Pt 2):026117. - PubMed
    1. Ahnert SE. 2017. Structural properties of genotype–phenotype maps. J R Soc Interface. 14(132):20170275. - PMC - PubMed
    1. Arthur W. 2001. Developmental drive: an important determinant of the direction of phenotypic evolution. Evol Dev. 3(4):271–278. - PubMed
    1. Begun DJ, Lindfors HA, Kern AD, Jones CD.. 2007. Evidence for de novo evolution of testis-expressed genes in the Drosophila yakuba/Drosophila erecta clade. Genetics 176(2):1131–1137. - PMC - PubMed