. 2021 Sep 20;16(9):e0257583.
doi: 10.1371/journal.pone.0257583. eCollection 2021.

Racial and ethnic disparities in HIV diagnoses among heterosexually active persons in the United States nationally and by state, 2018

Affiliations

Racial and ethnic disparities in HIV diagnoses among heterosexually active persons in the United States nationally and by state, 2018

Erika G Martin et al. PLoS One. .

Abstract

Background: Despite declining HIV infection rates, persistent racial and ethnic disparities remain. Appropriate calculations of diagnosis rates by HIV transmission category, race and ethnicity, and geography are needed to monitor progress towards reducing systematic disparities in health outcomes. We estimated the number of heterosexually active adults (HAAs) by sex and state to calculate appropriate HIV diagnosis rates and disparity measures within subnational regions.

Methods: The analysis included all HIV diagnoses attributed to heterosexual transmission in 2018 in the United States, in 50 states and the District of Columbia. Logistic regression models estimated the probability of past-year heterosexual activity among adults in three national health surveys, by sex, age group, race and ethnicity, education category, and marital status. Model-based probabilities were applied to estimated counts of HAAs by state, which were synthesized through meta-analysis. HIV diagnoses were overlaid to calculate racial- and ethnic-specific rates, rate differences (RDs), and rate ratios (RRs) among HAAs by sex and state.

Results: Nationally, HAA women have a two-fold higher HIV diagnosis rate than HAA men (rate per 100,000 HAAs, women: 6.57; men: 3.09). Compared to White non-Hispanic HAAs, Black HAAs have a 20-fold higher HIV diagnosis rate (RR, men: 21.28, women: 19.55; RD, men: 15.40, women: 31.78) and Hispanic HAAs have a 4-fold higher HIV diagnosis rate (RR, men: 4.68, RD, women: 4.15; RD, men: 2.79, RD, women: 5.39). Disparities were ubiquitous across regions, with >75% of states in each region having Black-to-White RR ≥10.

Conclusion: The racial and ethnic disparities across regions suggests a system-wide failure particularly with respect to preventing HIV among Black and Hispanic women. Pervasive disparities emphasize the role for coordinated federal responses such as the current Ending the HIV Epidemic (EHE) initiative.


Conflict of interest statement

The authors have declared that no competing interests exist.

Figures

Fig 1
Fig 1. Analysis flow chart.
Abbreviations: American Community Survey (ACS), General Social Survey (GSS), National Center for HIV/AIDS, Viral Hepatitis, STD, and TB Prevention (NCHHSTP), National Health and Nutrition Examination Survey (NHANES), National Survey of Family Growth (NSFG). a Heterosexual activity among men defined as men who have had sex with women exclusively in the past 12 months. Heterosexual activity among women defined as women who have had sex with men exclusively and women who have had sex with both men and women in the past 12 months. b The logistic regression model contains covariates for age group (18–29, 30–39, and 40–50), sex (female or male), race and ethnicity (White, Black, Hispanic, and other), education category (high school and lower, some college, and college graduate and above), and marital status (never married; married; and widowed, separated, or divorced). This yielded 216 unique demographic strata. The logistic regression model for GSS (ages 51+) did not contain a covariate for age, yielding 72 strata. c To estimate state-wide probabilities of heterosexual activity, we first calculated the national estimate of recent heterosexual activity for 216 strata among persons aged 18 to 50 (all combinations of sex, race and ethnicity, education, age, and marital status categories) and subsequently applied these estimates to statewide population compositions of these strata. We repeated that exercise for the 72 strata in the GSS-based model estimate for persons aged 51+. d NSFG covers respondents up to 49 years. There were a few participants that were 50 years of age.
Fig 2
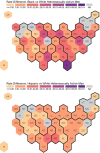
Fig 2. Rate differences of newly diagnosed HIV cases among heterosexually active Men Ages 18+.
Regions are indicated with the dark black lines. Eight states did not report stratified data (by sex, transmission category, and race/ethnicity), and are indicated with “not available” (NA).
Fig 3
Fig 3. Rate ratios of newly diagnosed HIV cases among heterosexually active Men Ages 18+.
Regions are indicated with the dark black lines. For most states in the lowest category with rate ratio between 0.00 and 1.00, there were no or very few new diagnoses among Black or Hispanic heterosexually active men. This commonly occurred in states with smaller populations. Eight states did not report stratified data (by sex, transmission category, and race/ethnicity), and are indicated with “not available” (NA). Six states do not have calculated rate ratios because there were 0 diagnoses among White heterosexually active men, and are indicated with “not calculated” (NC).
Fig 4
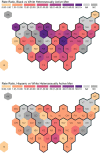
Fig 4. Rate differences of newly diagnosed HIV cases among heterosexually active Women Ages 18+.
Regions are indicated with the dark black lines. Eight states did not report stratified data (by sex, transmission category, and race/ethnicity), and are indicated with “not available” (NA).
Fig 5
Fig 5. Rate ratios of newly diagnosed HIV cases among heterosexually active Women Ages 18+.
Regions are indicated with the dark black lines. For most states in the lowest category with rate ratio between 0.00 and 1.00, there were no or very few new diagnoses among Black or Hispanic heterosexually active women. This commonly occurred in states with smaller populations. Eight states did not report stratified data (by sex, transmission category,, and race/ethnicity), and are indicated with “not available” (NA). One state does not have calculated rate ratios because there were 0 new diagnoses among White heterosexually active women, and are indicated with “not calculated” (NC).

References

    1. The White House. National HIV/AIDS Strategy [Internet]. 2020. [cited 2020 Apr 27]. Available from: https://www.hiv.gov/federal-response/national-hiv-aids-strategy/strategy....
    1. National Alliance of State and Territorial AIDS Directors. Ending the HIV epidemic: jurisdictional plans [Internet]. Available from: https://www.nastad.org/maps/ending-hiv-epidemic-jurisdictional-plans.
    1. Giroir BP. The time is now to end the HIV epidemic. Am J Public Health. 2020Jan;110(1):22–4. doi: 10.2105/AJPH.2019.305380 - DOI - PMC - PubMed
    1. McCree DH, Chesson HW, Eppink ST, Beer L, Henny KD. Changes in racial and ethnic disparities in estimated diagnosis rates of heterosexually acquired HIV infection among heterosexual males in the United States, 2014–2018. J Acquir Immune Defic Syndr. 2020Dec15;85(5):588–92. doi: 10.1097/QAI.0000000000002495 - DOI - PubMed
    1. McCree DH, Chesson H, Bradley ELP, Lima A, Fugerson AG. US Regional Changes in Racial/Ethnic Disparities in HIV Diagnoses Among Women in the United States, 2012 and 2017. AIDS Behav. 2020Apr;24(4):1118–23. doi: 10.1007/s10461-019-02736-w - DOI - PubMed

Publication types