. 2021 Sep 20;17(9):e1009484.
doi: 10.1371/journal.ppat.1009484. eCollection 2021 Sep.

HIV-1 requires capsid remodelling at the nuclear pore for nuclear entry and integration

Affiliations

HIV-1 requires capsid remodelling at the nuclear pore for nuclear entry and integration

Anabel Guedán et al. PLoS Pathog. .

Abstract

The capsid (CA) lattice of the HIV-1 core plays a key role during infection. From the moment the core is released into the cytoplasm, it interacts with a range of cellular factors that, ultimately, direct the pre-integration complex to the integration site. For integration to occur, the CA lattice must disassemble. Early uncoating or a failure to do so has detrimental effects on virus infectivity, indicating that an optimal stability of the viral core is crucial for infection. Here, we introduced cysteine residues into HIV-1 CA in order to induce disulphide bond formation and engineer hyper-stable mutants that are slower or unable to uncoat, and then followed their replication. From a panel of mutants, we identified three with increased capsid stability in cells and found that, whilst the M68C/E212C mutant had a 5-fold reduction in reverse transcription, two mutants, A14C/E45C and E180C, were able to reverse transcribe to approximately WT levels in cycling cells. Moreover, these mutants only had a 5-fold reduction in 2-LTR circle production, suggesting that not only could reverse transcription complete in hyper-stable cores, but that the nascent viral cDNA could enter the nuclear compartment. Furthermore, we observed A14C/E45C mutant capsid in nuclear and chromatin-associated fractions implying that the hyper-stable cores themselves entered the nucleus. Immunofluorescence studies revealed that although the A14C/E45C mutant capsid reached the nuclear pore with the same kinetics as wild type capsid, it was then retained at the pore in association with Nup153. Crucially, infection with the hyper-stable mutants did not promote CPSF6 re-localisation to nuclear speckles, despite the mutant capsids being competent for CPSF6 binding. These observations suggest that hyper-stable cores are not able to uncoat, or remodel, enough to pass through or dissociate from the nuclear pore and integrate successfully. This, is turn, highlights the importance of capsid lattice flexibility for nuclear entry. In conclusion, we hypothesise that during a productive infection, a capsid remodelling step takes place at the nuclear pore that releases the core complex from Nup153, and relays it to CPSF6, which then localises it to chromatin ready for integration.


Conflict of interest statement

The authors have declared that no competing interests exist.

Figures
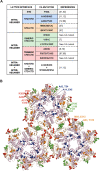
Fig 1
Fig 1. Panel of CA mutants.
(A) The panel of CA mutants used in this study and the lattice interface at which the mutations reside. New CA mutants with cysteine mutations (E180C, L151C/L189C and K203C/A217C) were designed based on a previously published cryo-EM MDFF atomic model (PDB ID: 3J34; [8]) and crystal structures (PDB ID: 3H4E and 3H47; [11]). The remaining CA mutants were selected from previous publications as indicated in the references column. (B) Structure of the CA lattice from PDB ID: 3J34, showing 18 CA monomers arranged into three hexameric rings. The protein backbone is shown in cartoon representation with CA-NTDs coloured pink and CA-CTDs coloured wheat. Residues at intra- and inter-hexamer interfaces where mutations were made are highlighted in space-fill representation and colour-coded according to the interaction type displayed in (A).
Fig 2
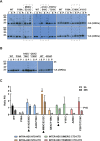
Fig 2. Effect of the CA mutations on viral core stability in cells.
(A, B) Representative immunoblots of Fate-of-capsid assays comparing WT VLP to mutant VLP. HeLa cells were infected with equal RT units of WT or mutant VLP and cell lysates were harvested at 2 hpi (A, B) and 20 hpi (A). Cell lysates were centrifuged through a sucrose cushion to separate viral CA into free (soluble, S) and assembled (pellet, P) fractions. An input (I) sample was also harvested before the centrifugation through the sucrose cushion. CA was detected by immunoblotting using an anti-HIV-1 CA antibody. Each assay was performed at least three times independently. (C) Bar chart summarising the densitometry analysis of independent immunoblots of Fate-of-capsid assays. Data is plotted as a mean of the ratio P/S ± SEM. The dotted line indicates a ratio of 1, when P = S. nd = not determined. Bars are colour coded according to the lattice interface at which the cysteines have been introduced, as in Fig 1. Mutant VLP with a CA ratio of P>S at 2h and P = S at 20h were considered “hyper-stable” (surrounded with a dashed-line box in (A) and indicated with black arrow heads in (C)).
Fig 3
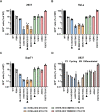
Fig 3. Effect of CA mutations on VLP infectivity.
293T (A), HeLa (B), SupT1 (C) and both cycling and differentiated U937 (D) cells were infected with equal RT units of GFP-reporter WT or mutant VLP. The percentage of GFP+ cells was measured by flow cytometry at 72hpi and plotted relative to WT VLP. Points indicate individual biological repeats and lines show the mean ± SEM. Bars are colour coded according to the lattice interface at which the cysteines have been introduced, as in Fig 1. Hyper-stable mutants based on the fate of capsid assay in Fig 2 are indicated with black arrow heads.
Fig 4
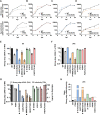
Fig 4. Effect of CA mutations on reverse transcription.
293T cells were synchronously infected with equivalent RT units of WT or mutant VLP. At the indicated times post-infection, cells were harvested for DNA extraction, and viral cDNA products were measured by qPCR. (A-D) Graphs show the levels of early (strong stop) cDNA (upper panels) and late (second strand) cDNA (lower panels) in 293T cells following infection with WT VLP (black line) and mutants P38A (A), P207C/T216C (B), A14C/E45C (C) or M68C/E212C (D). The data is shown as mean ± SEM from at least two independent experiments. (E, F) Bar charts show the levels of strong stop cDNA at 6h (E) and 24h (F) post infection for the panel of mutants relative to WT infections. (G) Bar chart showing the levels of strong stop cDNA at 24 h (left y-axis) and infectivity (from Fig 3) at 72 h (right y-axis) compared to WT VLP for each mutant. Individual points represent biological repeats and lines indicate the mean ± SEM. (H) Bar chart showing the ratio of relative levels of strong stop cDNA to infectivity, from (G). Dashed line indicates a ratio of 3. Bars are colour coded according to the lattice interface at which the cysteines have been introduced, see Fig 1. Hyper-stable mutants are indicated with a black arrow heads.
Fig 5
Fig 5. Effect of hyper-stable CA mutations on the early stages of infection.
(A) Disulphide cross-linking of CA monomers in VLP and cells. Equal RT units of WT VLP or hyper-stable mutants A14C/E45C, E180C or M68C/E212C VLP were pelleted by centrifugation and resuspended in Laemmli buffer. VLP were either analysed directly or used to infect HeLa cells. 2 hpi cells were lysed and both VLP and cell lysates were analysed by non-reducing SDS-PAGE and immunoblotting with an HIV-1 CA antibody. Samples were either treated with 50mM iodoacetamide (Iodo), to prevent further disulphide bond formation, or with 10% β-Mercaptoethanol (β-Me), to reduce existing disulphide bonds, prior to SDS-PAGE. The expected band positions of monomeric (1mer) and different oligomeric CA forms (2mer, 3mer etc) are indicated. (B) 293T, (C) HeLa, (D) cycling U937 and (E) differentiated U937 cells were synchronously infected with equivalent RT units of WT or mutant VLP and harvested for DNA extraction at the following times: 293T, HeLa and cycling U937 cells were harvested at 6hpi to measure early (strong stop) and late (second strand) cDNA and at 24hpi to measure 2-LTR circles. 293T cells were harvested at 2 weeks post infection to measure integrated proviral DNA by qPCR. Differentiated U937 cells were harvested at 24h to measure early and late cDNA and at 72hpi to measure 2-LTR circles by qPCR. Data were plotted relative to WT infections (shown as a dashed line at 100%). Points indicate individual biological repeats and the mean ± SEM are shown. Viral infectivity from parallel infections (see Fig 3) was also plotted for comparison.
Fig 6
Fig 6. Cellular localisation of CA and IN proteins during WT and A14C/E45C infections.
HeLa cells were synchronously infected with equal RT units of WT or A14C/E45C mutant (CC in the figure) VLP. Cells were harvested at either 0, 0.5 and 2 hpi, or 4, 8, 24 and 30 hpi to be processed in parallel as a whole cell lysate (WCL) or to undergo subcellular fractionation. Protein levels were quantified by BCA assay, proportional amounts of the fractions related to the WCL were loaded on SDS-PAGE gels and analysed by immunoblotting using the following antibodies: Anti-CA and anti-IN for HIV-1 proteins, anti-HSP90 for cytoplasm, anti-calnexin for membranes, anti-HDAC2 for nucleus, anti-histone 3 for chromatin and anti-tubulin α for cytoskeleton. Anti-lamin B1 was used as a nuclear envelope marker and the distribution of CPSF6 was also analysed. (A, C, E) Panels show representative immunoblots probed for HIV-1 CA and IN and the appropriate fractionation marker (A) WCL with HSP90 as a loading control, (C) Nuclear fraction with HDAC2 as a loading control. (E) Chromatin fraction with histone 3 as a loading control. “-”indicates uninfected cells. Bar charts show the densitometry analysis of the immunoblots plotted as the ratio of CA or IN proteins to the loading control. The key for bar chart colour coding is shown at the bottom of the figure. Arrows indicate undetectable protein. The 24 hpi sample was loaded on each gel for the sake of comparison (24h*). (B) Subcellular fractions from uninfected cells, probed for control proteins to confirm successful sample fractionation. (D, F) Disulphide cross-linking of CA monomers in different cellular fractions. The 4 and 8hpi samples from nucleus (D) and chromatin (F) fractions were either treated with 50mM iodoacetamide (Iodo), to prevent further disulphide bond formation, or with 10% β-Mercaptoethanol (β-Me), to reduce existing disulphide bonds, prior to SDS-PAGE and immunoblotting with an anti-HIV-1 CA antibody. The expected band positions of monomeric (1mer) and different oligomeric CA forms (2mer, 3mer etc) are indicated.
Fig 7
Fig 7. CA co-localisation of CA with NUP358 and NUP153 during infection.
HeLa cells were synchronously infected with equal RT units of WT or A14C/E45C VLP and fixed at 2, 4, 6, 8 and 10 hpi. Cells were incubated with primary antibodies to HIV-1 CA and either NUP358 (A-C) or NUP153 (D-F), followed by specific secondary antibodies conjugated to the PLUS and MINUS PLA oligonucleotides (probes). Each foci represents a positive PLA signal generated by the amplification of the interaction between the PLUS and MINUS probes. (A) and (D) show representative images of CA-NUP358 and CA-NUP153 co-localisation at 8 hpi, respectively (the scale bar is 10μm). Longitudinal Z-series were acquired with a 63X objective using a confocal microscope followed by 3D image analysis performed with the GIANI plug-in in FIJI. The number of foci per cell (B and E) and the relative distance of those foci to the DAPI edge (C and F) were quantified. In the plots, each point represents the mean foci data from all the cells within an image (75 to 100 cells/image). At least 12 images were acquired per condition over at least three independent biological repeats (plotted in different colours). Overall means ± SEM are shown in black. * = p<0.05, ** = p<0.01, *** = p<0.001, **** = p<0.0001, ns = not significant.
Fig 8
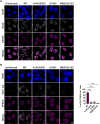
Fig 8. HIV-1 CA, CPSF6 and SC35 staining during infection with WT and hyper-stable mutant VLP.
HeLa cells were synchronously infected with equal RT units of WT, A14C/E45C, E180C or M68C/E212C VLP and fixed at 16hpi. Cells were incubated with primary antibodies against HIV-1 CA, CPSF6 and SC35 followed by specific secondary antibodies conjugated to Alexa Fluor fluorophores. The scale bars are 10μm. (A) Representative images of SC35 and CPSF6 staining. White arrows point to SC35 and CPSF6 co-localisation in the merged WT image. (B) Representative images of HIV-1 CA and CPSF6 staining. White dashed line boxes in WT columns indicate zoomed-in regions labelled 1 and 2 (shown in S5A Fig). Bar chart shows the number of CA positive cells that showed CPSF6 redistribution to puncta. Points indicate individual biological repeats (~150 cells per experiment were used for quantification) and lines show the mean ± SEM; **** = p<0.0001.
Fig 9
Fig 9. Current models for HIV-1 and MLV uncoating.
Incoming viral cores (HIV-1, left columns and MLV, right column) surrounded by a CA lattice (orange hexagons) contain the viral RNA (red) coated with nucleocapsid (light blue), as well as the viral enzymes, protease (yellow), reverse transcriptase (light green) and integrase (purple) (step 1). Reverse transcription of the RNA to double stranded DNA (dark blue) starts following infection and the core travels towards the nucleus down microtubules (step 2). HIV-1 DNA can cross the nuclear pore (step 3), and in association with CPSF6 (green dots) (step 4), move to nuclear speckles (darker pink shaded regions) and integrate into the host cell chromatin (grey with orange ovals) (step 5) to form a provirus (step 6). When and where the CA lattice disassembles and where reverse transcription finishes is still debated and the possible scenarios for HIV-1 uncoating (loss of orange hexagons) are illustrated here: from left to right; uncoating in the cytoplasm, uncoating at the nuclear pore, uncoating inside the nucleus or uncoating at the site of integration. In contrast, MLV cannot pass through nuclear pores and must wait for mitosis to occur before accessing the chromatin. Our current model for MLV uncoating is shown on the right: At mitosis, the N-terminal domain of the MLV p12 protein (red) binds directly to CA and the C-terminal domain (green) binds to nucleosomes, tethering the likely intact MLV core to the host chromatin. Following mitosis, MLV uncoats to allow integration, which, as it is already associated with chromatin, probably occurs at the integration site.

References

    1. McDonald D, Vodicka MA, Lucero G, Svitkina TM, Borisy GG, Emerman M, et al.. Visualization of the intracellular behavior of HIV in living cells. J Cell Biol. 2002;159(3):441–52. doi: 10.1083/jcb.200203150 - DOI - PMC - PubMed
    1. Ganser BK, Li S, Klishko VY, Finch JT, Sundquist WI. Assembly and analysis of conical models for the HIV-1 core. Science. 1999;283(5398):80–3. doi: 10.1126/science.283.5398.80 - DOI - PubMed
    1. Ganser-Pornillos BK, von Schwedler UK, Stray KM, Aiken C, Sundquist WI. Assembly properties of the human immunodeficiency virus type 1 CA protein. J Virol. 2004;78(5):2545–52. doi: 10.1128/jvi.78.5.2545-2552.2004 - DOI - PMC - PubMed
    1. Pornillos O, Ganser-Pornillos BK, Yeager M. Atomic-level modelling of the HIV capsid. Nature. 2011;469(7330):424–7. doi: 10.1038/nature09640 - DOI - PMC - PubMed
    1. Mattei S, Glass B, Hagen WJ, Krausslich HG, Briggs JA. The structure and flexibility of conical HIV-1 capsids determined within intact virions. Science. 2016;354(6318):1434–7. doi: 10.1126/science.aah4972 - DOI - PubMed

Publication types

Substances