

Replicating prediction algorithms for hospitalization and corticosteroid use in patients with inflammatory bowel disease
- PMID: 34543353
- PMCID: PMC8452029
- DOI: 10.1371/journal.pone.0257520
Replicating prediction algorithms for hospitalization and corticosteroid use in patients with inflammatory bowel disease
Abstract
Introduction: Previous work had shown that machine learning models can predict inflammatory bowel disease (IBD)-related hospitalizations and outpatient corticosteroid use based on patient demographic and laboratory data in a cohort of United States Veterans. This study aimed to replicate this modeling framework in a nationally representative cohort.
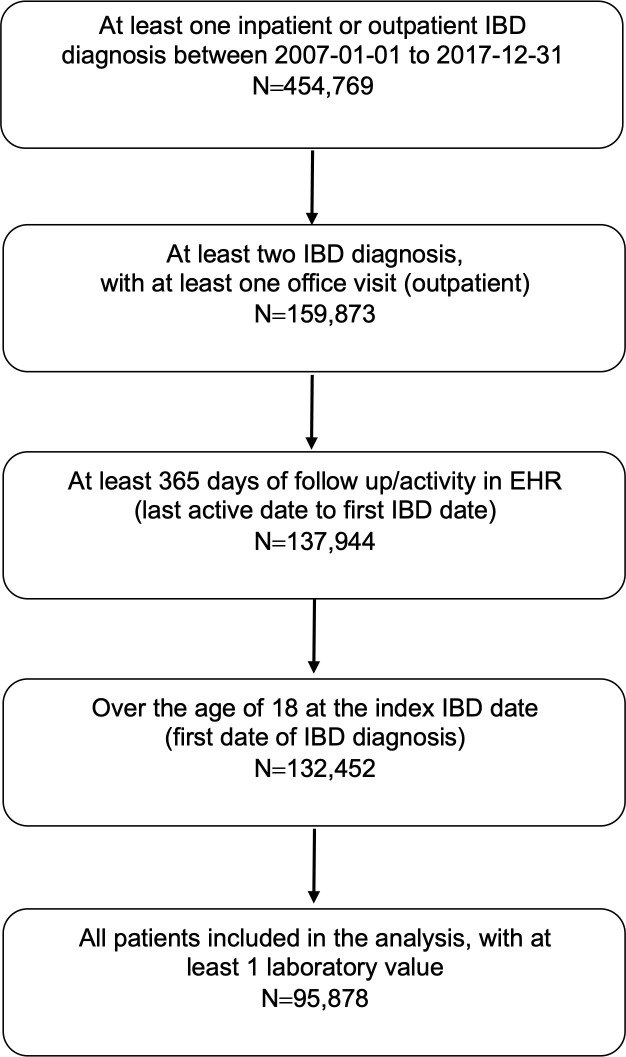
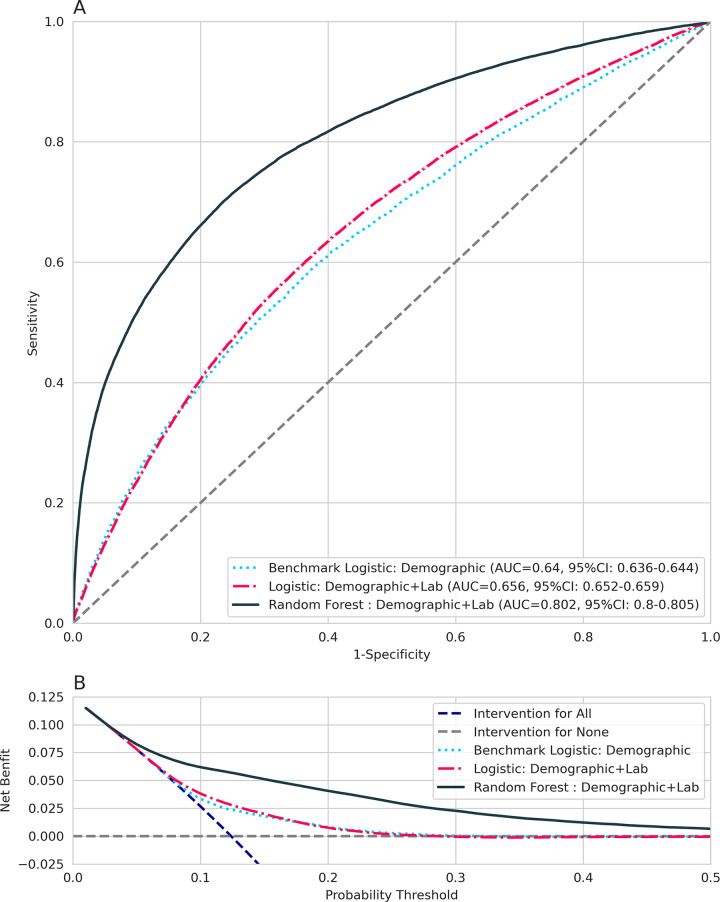
Methods: A retrospective cohort design using Optum Electronic Health Records (EHR) were used to identify IBD patients, with at least 12 months of follow-up between 2007 and 2018. IBD flare was defined as an inpatient/emergency visit with a diagnosis of IBD or an outpatient corticosteroid prescription for IBD. Predictors included demographic and laboratory data. Logistic regression and random forest (RF) models were used to predict IBD flare within 6 months of each visit. A 70% training and 30% validation approach was used.
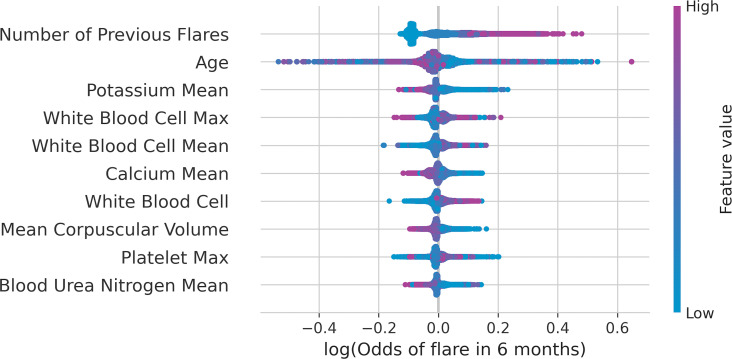
Results: A total of 95,878 patients across 780,559 visits were identified. Of these, 22,245 (23.2%) patients had at least one IBD flare. Patients were predominantly White (87.7%) and female (57.1%), with a mean age of 48.0 years. The logistic regression model had an area under the receiver operating curve (AuROC) of 0.66 (95% CI: 0.65-0.66), sensitivity of 0.69 (95% CI: 0.68-0.70), and specificity of 0.74 (95% CI: 0.73-0.74) in the validation cohort. The RF model had an AuROC of 0.80 (95% CI: 0.80-0.81), sensitivity of 0.74 (95% CI: 0.73-0.74), and specificity of 0.72 (95% CI: 0.72-0.72) in the validation cohort. Important predictors of IBD flare in the RF model were the number of previous flares, age, potassium, and white blood cell count.
Conclusion: The machine learning modeling framework was replicated and results showed a similar predictive accuracy in a nationally representative cohort of IBD patients. This modeling framework could be embedded in routine practice as a tool to distinguish high-risk patients for disease activity.
Conflict of interest statement
Ryan Gan and Diana Sun are full time employees of Genentech, Inc., a member of the Roche group, and own shares of Roche stock. Amanda Tatro is a full time employee of F. Hoffmann La Roche AG and own shares of Roche stock. This does not alter out adherence to PLOS ONE policies on sharing data and materials. No other authors have competing interests.
Figures
References
-
- OPTUM® ⎯ Clinical/EHR Data [database online]. [cited 1 Jun 2019]. Available: https://www.optum.com/business/solutions/government/federal/data-analyti...
Publication types
MeSH terms
Substances
LinkOut - more resources
Full Text Sources
Medical
