. 2021 Nov;174(11):1542-1553.
doi: 10.7326/M21-1501. Epub 2021 Sep 21.

What Will It Take to End HIV in the United States? : A Comprehensive, Local-Level Modeling Study

Affiliations

What Will It Take to End HIV in the United States? : A Comprehensive, Local-Level Modeling Study

Anthony Todd Fojo et al. Ann Intern Med. 2021 Nov.

Abstract

Background: The Ending the HIV Epidemic (EHE) initiative aims to reduce incident HIV infections by 90% over a span of 10 years. The intensity of interventions needed to achieve this for local epidemics is unclear.

Objective: To estimate the effect of HIV interventions at the city level.

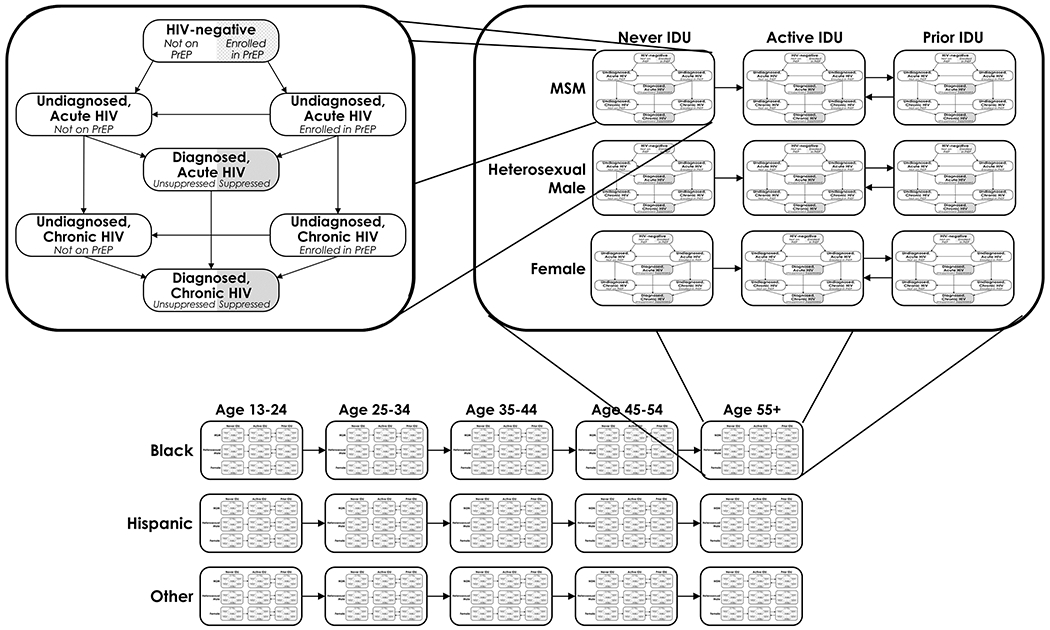
Design: A compartmental model of city-level HIV transmission stratified by age, race, sex, and HIV risk factor was developed and calibrated.

Setting: 32 priority metropolitan statistical areas (MSAs).

Patients: Simulated populations in each MSA.

Intervention: Combinations of HIV testing and preexposure prophylaxis (PrEP) coverage among those at risk for HIV, plus viral suppression in persons with diagnosed HIV infection.

Measurements: The primary outcome was the projected reduction in incident cases from 2020 to 2030.

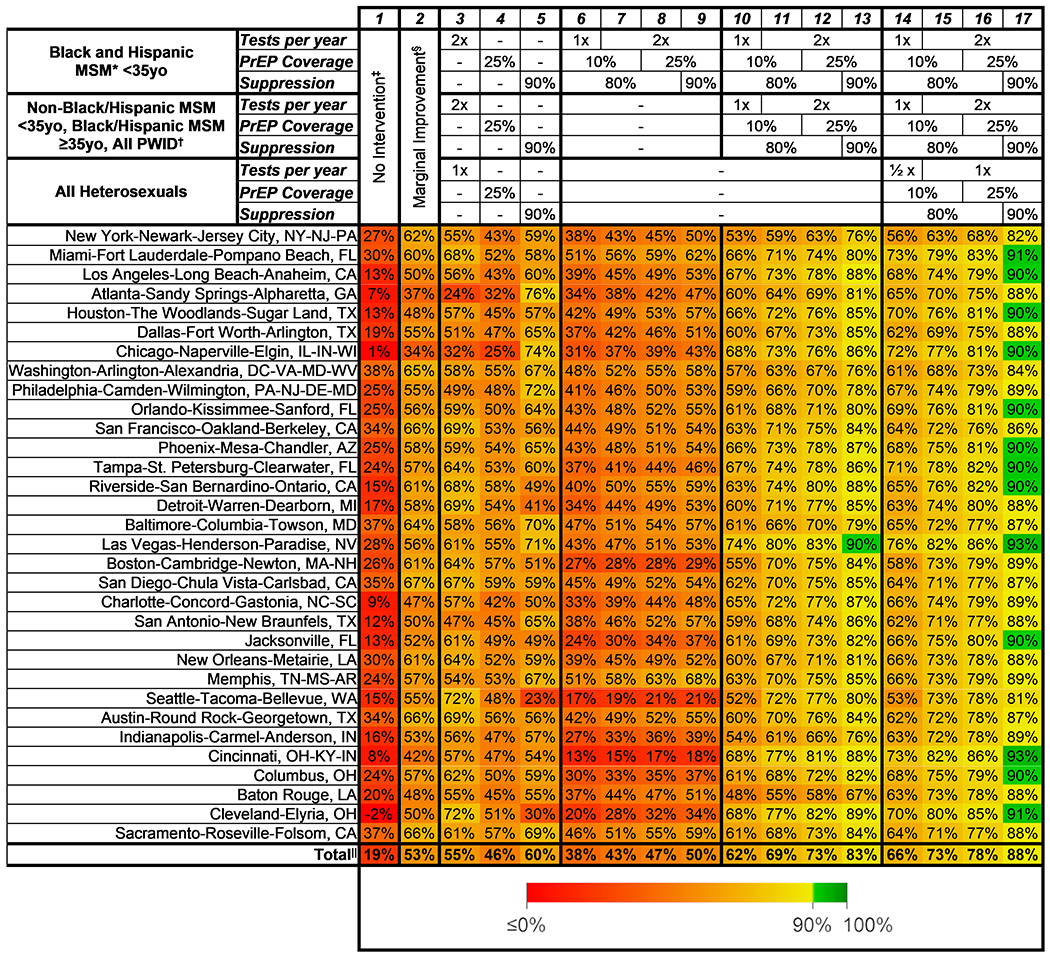
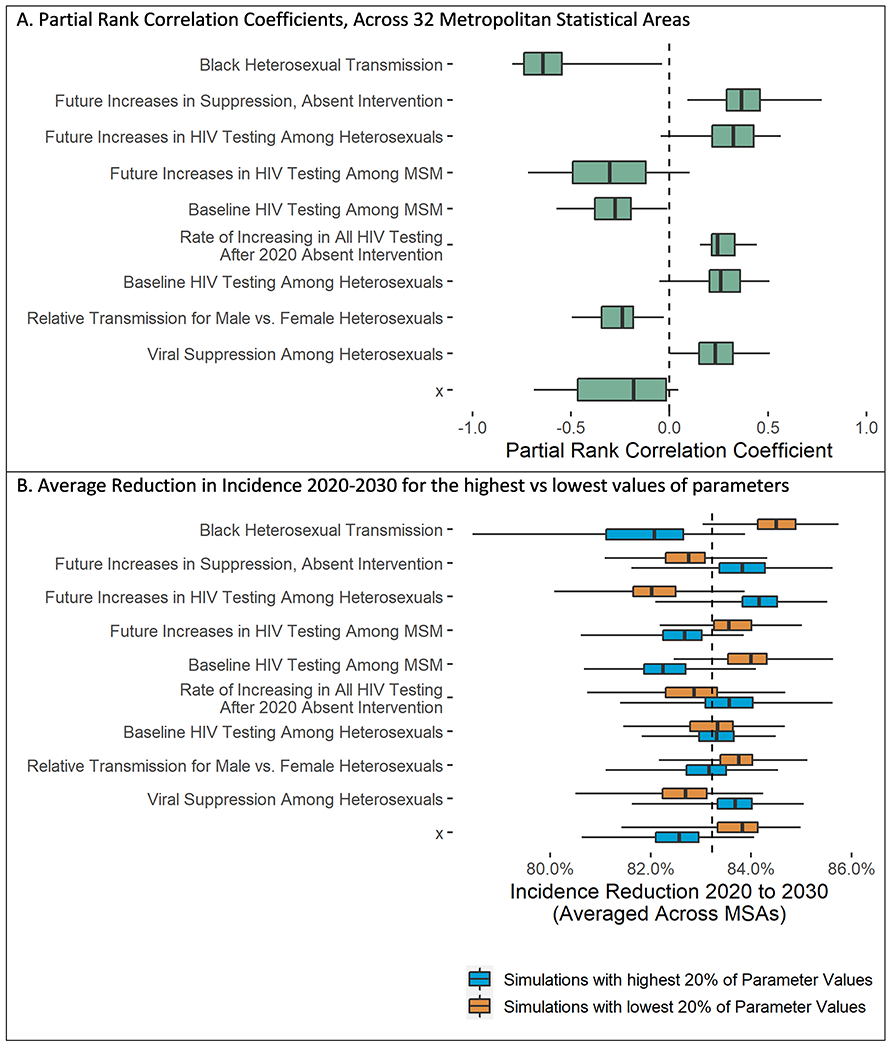
Results: Absent intervention, HIV incidence was projected to decrease by 19% across all 32 MSAs. Modest increases in testing (1.25-fold per year), PrEP coverage (5 percentage points), and viral suppression (10 percentage points) across the population could achieve reductions of 34% to 67% by 2030. Twenty-five percent PrEP coverage, testing twice a year on average, and 90% viral suppression among young Black and Hispanic men who have sex with men (MSM) achieved similar reductions (13% to 68%). Including all MSM and persons who inject drugs could reduce incidence by 48% to 90%. Thirteen of 32 MSAs could achieve greater than 90% reductions in HIV incidence with large-scale interventions that include heterosexuals. A web application with location-specific results is publicly available (www.jheem.org).

Limitation: The COVID-19 pandemic was not represented.

Conclusion: Large reductions in HIV incidence are achievable with substantial investment, but the EHE goals will be difficult to achieve in most locations. An interactive model that can help policymakers maximize the effect in their local environments is presented.

Primary funding source: National Institutes of Health.


Figures

Figure 1.
Figure 1.
Model structure. The upper left panel shows model populations (compartments) representing HIV disease and continuum of care. Each uninfected population has a proportion who are enrolled in a PrEP program. As persons in the model become infected, they first enter the acute HIV phase, where transmissibility is high, before progressing to chronic HIV. Persons who become infected with HIV while enrolled in a PrEP program are diagnosed at an average rate of once every 3 mo. Persons with HIV infection who are unaware of their diagnosis and not in a PrEP program are diagnosed according to testing rates that depend on their age, race/ethnicity, sex or sexual behavior, intravenous drug use status, location, and calendar year. All populations of persons with HIV infection who are aware of their diagnosis have a proportion who are virally suppressed and do not transmit HIV. Each population is further stratified by sex or sexual behavior and intravenous drug use status (top right) and by age and race/ethnicity (bottom). IDU = injection drug use; MSM = men who have sex with men; PrEP = pre-exposure prophylaxis.
Figure 2.
Figure 2.
Model fit for 1000 simulations in New York–Newark–Jersey City, New York–New Jersey–Pennsylvania metropolitan statistical area. The shaded ribbons represent the 95% credible interval. The solid, dotted, and dashed lines in the middle of the ribbons represent the mean across 1000 model simulations. The circles, squares, triangles and diamonds represent data from the Centers for Disease Control and Prevention surveillance (–19). Data stratified by race/ethnicity, HIV risk factor, and age on reported diagnoses at the metropolitan statistical area-level were available for 2010, 2011, and 2013 to 2017, and on estimated prevalence for 2009, 2010, and 2012 to 2016. IDU = injection drug use; MSM = men who have sex with men.
Figure 3.
Figure 3.
The effect of 2 potential interventions on incidence and reported diagnoses in the New York–Newark–Jersey City, New York–New Jersey–Pennsylvania metropolitan statistical area. The shaded ribbons represent the 95% CrI. The solid and dashed lines in the middle of the ribbons represent the mean across 1000 model simulations. The black circles represent Centers for Disease Control and Prevention surveillance data for total reported diagnoses (–19). Interventions begin implementation on 1 January 2023, scale up by 31 December 2027, and continue implementation through 2030. The “no intervention” scenario (solid orange lines) assumes continuation of current rates of improvement in testing, suppression, and PrEP usage over the next 5 years. Intervention 1 (dashed blue lines) targets Black and Hispanic MSM aged younger than 35 years with twice-yearly testing and 25% PrEP uptake among those at risk, plus viral suppression in 80% of those with diagnosed HIV. Intervention 2 (dashed red lines) targets all MSM and PWID with twice-yearly testing and 25% PrEP uptake among those at risk, plus viral suppression in 90% of those with diagnosed HIV. CrI = credible interval; MSM = men who have sex with men; PrEP = preexposure prophylaxis; PWID = persons who inject drugs.
Figure 4.
Figure 4.
Reduction in HIV incidence from 2020 to 2030 for intervention scenarios across 32 MSAs. Each cell shows the mean percentage reduction across 1000 simulations in model-projected incidence from 2020 to 2030. The interventions begin on 1 January 2023, scale up linearly until 31 December 2027, and continue implementation through 2030. Tests per year denotes the average number of tests per year for those in the group (½ implies an average of 1 test every 2 years), PrEP coverage denotes the proportion of at-risk persons who are enrolled in a PrEP program, and suppression denotes the proportion of persons with HIV who have a suppressed viral load. MSA = metropolitan statistical area; MSM = men who have sex with men; PrEP = preexposure prophylaxis; PWID = persons who inject drugs. * The rates of testing, PrEP coverage, and suppression absent additional intervention differ by age, race, sex, risk factor, and MSA, and change over time. Averaged across all races and ages, MSM in 2020 were projected to have PrEP coverage ranging from 3% to 12% across MSAs, 0.3 to 0.8 tests per year on average, and 46% to 88% viral suppression. By 2025, PrEP coverage was projected to increase by 0.7 to 2.4 percentage points, whereas testing and viral suppression increased only marginally. Baseline levels for other subgroups and times are presented in Supplement Figures 3 to 5 and at www.jheem.org. † In the “broad moderate improvement” scenario, all subgroups increased PrEP coverage by 5 percentage points, testing 1.25 times per year, and viral suppression 10 percentage points. ‡ Total = the reduction in the sum of projected incidence across all 32 MSAs.
Figure 5.
Figure 5.
Sensitivity analyses for the 10 parameters most strongly associated with projected 10-year reduction in HIV incidence. MSA = metropolitan statistical area; MSM = men who have sex with men. Top. Box-and-whisker plot showing partial rank correlation coefficients—a measure of the correlation between (ranked) parameter values and the (ranked) outcome: the reduction in incidence from 2020 to 2030 assuming an intervention in which all at-risk MSM and all persons who inject drugs are tested yearly, 50% are receiving preexposure prophylaxis, and 90% of those with HIV are virally suppressed. Values close to 1 or −1 indicate perfect correlation. We show the 10 parameters with the strongest correlation with the outcome. The vertical line represents the median partial rank correlation coefficient across the 32 MSAs, the shaded boxes denote the interquartile range, and the whiskers span the minimum and maximum reduction across all 32 MSAs. Bottom. The reduction in total incidence (aggregated across the 32 MSAs) from 2020 to 2030 for the 200 simulations with the highest values of each parameter (blue) versus the 200 simulations with the lowest values (orange). This gives a sense for the magnitude of the change in the outcome when each parameter is varied from low to high values across the selected ranges. The vertical line represents the median reduction across the 200 simulations, the shaded boxes denote the interquartile range, and the whiskers span the minimum and maximum reduction for the 200 simulations.

Comment in

Similar articles

Cited by

References

    1. Centers for Disease Control and Prevention. Diagnoses of HIV infection in the United States and dependent areas, 2018 (updated). HIV Surveillance Report. 2020;31:1–119. Accessed at www.cdc.gov/hiv/pdf/library/reports/surveillance/cdc-hiv-surveillance-re... on 5/1/2021.
    1. Fauci AS, Redfield RR, Sigounas G, et al. Ending the HIV epidemic: a plan for the United States. JAMA. 2019;321:844–845. doi:10.1001/jama.2019.1343 - DOI - PubMed
    1. Giroir BP. The time is now to end the HIV epidemic. Am J Public Health. 2020;110:22–24. doi:10.2105/AJPH.2019.305380 - DOI - PMC - PubMed
    1. Panagiotoglou D, Olding M, Enns B, et al.; Localized HIV Modeling Study Group. Building the case for localized approaches to HIV: structural conditions and health system capacity to address the HIV/AIDS epidemic in six US cities. AIDS Behav. 2018;22:3071–3082. doi:10.1007/s10461-018-2166-6 - DOI - PMC - PubMed
    1. Knight GM, Dharan NJ, Fox GJ, et al. Bridging the gap between evidence and policy for infectious diseases: how models can aid public health decision-making. Int J Infect Dis. 2016;42:17–23. doi:10.1016/j.ijid.2015.10.024 - DOI - PMC - PubMed

Publication types

MeSH terms

Substances