. 2021 Sep 6;11(9):jkab248.
doi: 10.1093/g3journal/jkab248.

Harnessing multivariate, penalized regression methods for genomic prediction and QTL detection of drought-related traits in grapevine

Affiliations

Harnessing multivariate, penalized regression methods for genomic prediction and QTL detection of drought-related traits in grapevine

Charlotte Brault et al. G3 (Bethesda). .

Abstract

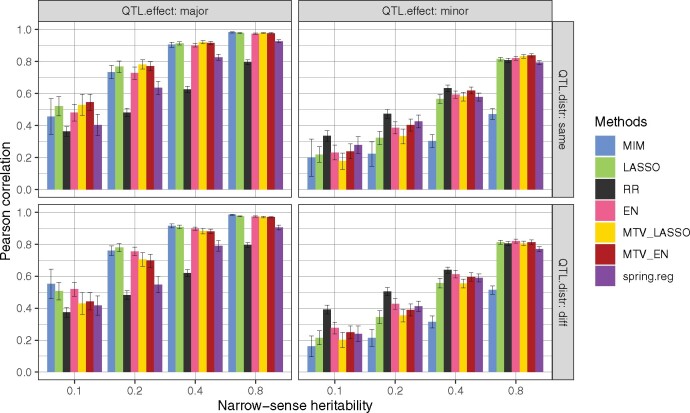
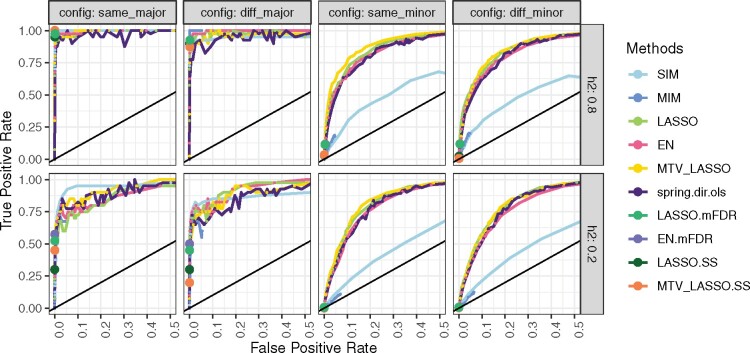
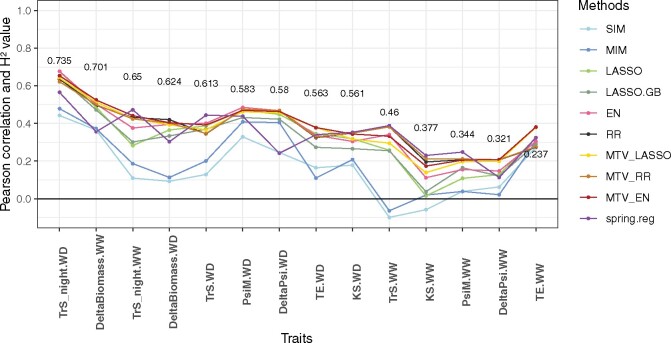
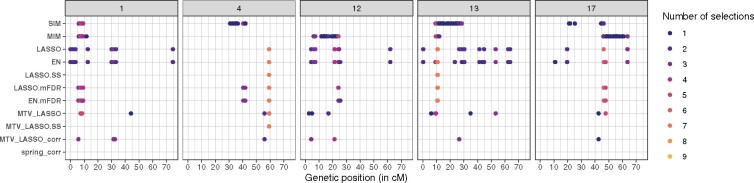
Viticulture has to cope with climate change and to decrease pesticide inputs, while maintaining yield and wine quality. Breeding is a key lever to meet this challenge, and genomic prediction a promising tool to accelerate breeding programs. Multivariate methods are potentially more accurate than univariate ones. Moreover, some prediction methods also provide marker selection, thus allowing quantitative trait loci (QTLs) detection and the identification of positional candidate genes. To study both genomic prediction and QTL detection for drought-related traits in grapevine, we applied several methods, interval mapping (IM) as well as univariate and multivariate penalized regression, in a bi-parental progeny. With a dense genetic map, we simulated two traits under four QTL configurations. The penalized regression method Elastic Net (EN) for genomic prediction, and controlling the marginal False Discovery Rate on EN selected markers to prioritize the QTLs. Indeed, penalized methods were more powerful than IM for QTL detection across various genetic architectures. Multivariate prediction did not perform better than its univariate counterpart, despite strong genetic correlation between traits. Using 14 traits measured in semi-controlled conditions under different watering conditions, penalized regression methods proved very efficient for intra-population prediction whatever the genetic architecture of the trait, with predictive abilities reaching 0.68. Compared to a previous study on the same traits, these methods applied on a denser map found new QTLs controlling traits linked to drought tolerance and provided relevant candidate genes. Overall, these findings provide a strong evidence base for implementing genomic prediction in grapevine breeding.

Keywords: QTL detection; breeding; candidate gene; genomic prediction; grapevine; multi-trait; water stress.


Figures

Figure 1
Figure 1
Genomic prediction accuracy (Pearson’s correlation between predicted and true genotypic values) of seven methods applied to 3961 markers and two simulated traits in a bi-parental population with different heritability values and four QTL configurations (number × distribution among traits). major: 2 QTLs; minor: 50 QTLs; same: QTLs at the same positions for both traits; diff: QTLs at different positions between traits. For each heritability value and configuration, prediction accuracy was averaged over 100 values (2 traits × 10 simulation replicates × 5 cross-validation folds). The error bar corresponds to the 95% confidence interval around the mean.
Figure 2
Figure 2
ROC curves for 10 methods applied to 3961 markers and two simulated traits in a bi-parental population with two heritability values and four QTL configurations (number × distribution among traits). major: 2 QTLs; minor: 50 QTLs; same: QTLs at the same positions for both traits; diff: QTLs at different positions between traits. Results are averaged over 2 traits × 10 simulation replicates. TPR: (number of correctly found QTLs/number of simulated QTLs), FPR: (number of falsely found QTLs/number of markers outside a QTL). For robust methods (mFDR and SS), as the FPR remained very low, we display only a single point corresponding to the lowest parameter constraint and thus to the highest TPR.
Figure 3
Figure 3
Mean genomic predictive ability (Pearson’s correlation between genotypic BLUPs and their predicted values), obtained by cross-validation for 10 methods applied to 14 traits related to water deficit and GBS gene-dose data, within a grapevine bi-parental population. Broad-sense heritability values are reported for each trait (y-position of the number corresponds to heritability estimate). Traits are ordered by decreasing heritability. For each trait, predictive ability is averaged over 10 cross-validation replicates × 5 cross-validation folds).
Figure 4
Figure 4
Marker selection by all methods for TrS_night.WD trait on chromosomes 1, 4, 12, 13, and 17. Each marker selected by a given method is represented by a colored point, the color indicating the number of methods that have selected that specific marker. The boxes correspond to chromosomes and the x-axis to the position along the genetic map (in cM).
Figure 5
Figure 5
Functional classification of the annotated genes underlying the highly reliable QTL detected on chromosome 4 for night-time transpiration, growth, and TE. Hierarchical classification of the 161 genes based on their functions. See Supplementary Table S21 for the details of this classification. When an integrated function at the organ or plant level was explicitly quoted in the gene annotation, genes were classified on this basis. When no integrated function was explicitly quoted, they were classified based on their cellular or molecular function. In both cases, functions were then classified as “Related” if related to the traits of interest in this QTL, or “Unrelated” if not.

References

    1. Adam-Blondon A-F, Bernole A, Faes G, Lamoureux D, Pateyron S, et al.2005. Construction and characterization of BAC libraries from major grapevine cultivars. Theor Appl Genet. 110:1363–1371. - PubMed
    1. Arlot S, Lerasle M.. 2016. Choice of V for V-fold cross-validation in least-squares density estimation. J Mach Learn Res. 17:7256–7305.
    1. Arruda MP, Lipka AE, Brown PJ, Krill AM, Thurber C, et al.2016. Comparing genomic selection and marker-assisted selection for Fusarium head blight resistance in wheat (Triticum aestivum L.). Mol Breed. 36:84.
    1. Azodi CB, Bolger E, McCarren A, Roantree M, Campos G. D L, et al.2019. Benchmarking parametric and machine learning models for genomic prediction of complex traits. G3 (Bethesda)). 9:3691–3702. - PMC - PubMed
    1. Bates D, Mächler M, Bolker B, Walker S.. 2014. Fitting linear mixed-effects models using lme4. arXiv. 1406:5823.[stat] arXiv: 1406.5823.

Publication types

LinkOut - more resources