. 2021 Sep 20;40(1):294.
doi: 10.1186/s13046-021-02096-1.

RNA m6A demethylase FTO-mediated epigenetic up-regulation of LINC00022 promotes tumorigenesis in esophageal squamous cell carcinoma

Affiliations

RNA m6A demethylase FTO-mediated epigenetic up-regulation of LINC00022 promotes tumorigenesis in esophageal squamous cell carcinoma

Yuanbo Cui et al. J Exp Clin Cancer Res. .

Abstract

Background: Long non-coding RNA (LncRNA) controls cell proliferation and plays a significant role in the initiation and progression of esophageal squamous cell carcinoma (ESCC). N6-methyladenosine (m6A) modification now is recognized as a master driver of RNA function to maintain homeostasis in cancer cells. However, how m6A regulates LncRNA function and its role in tumorigenesis of ESCC remain unclear.

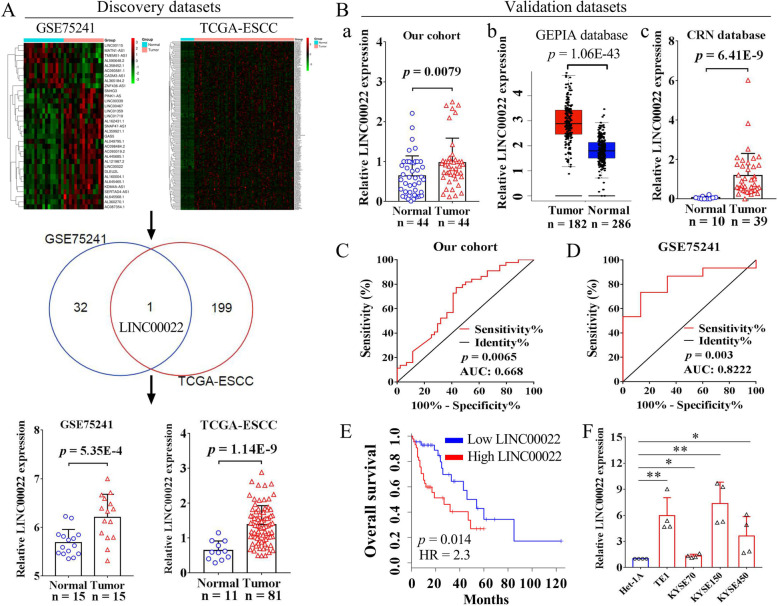
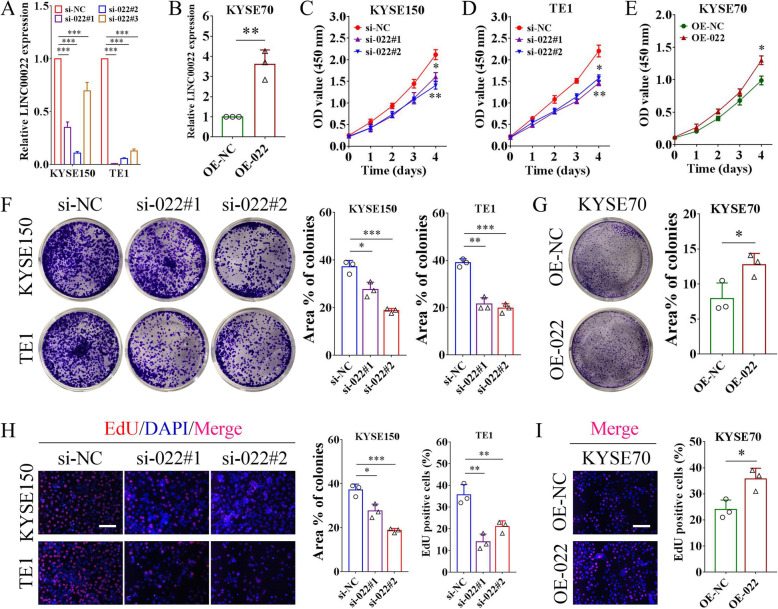
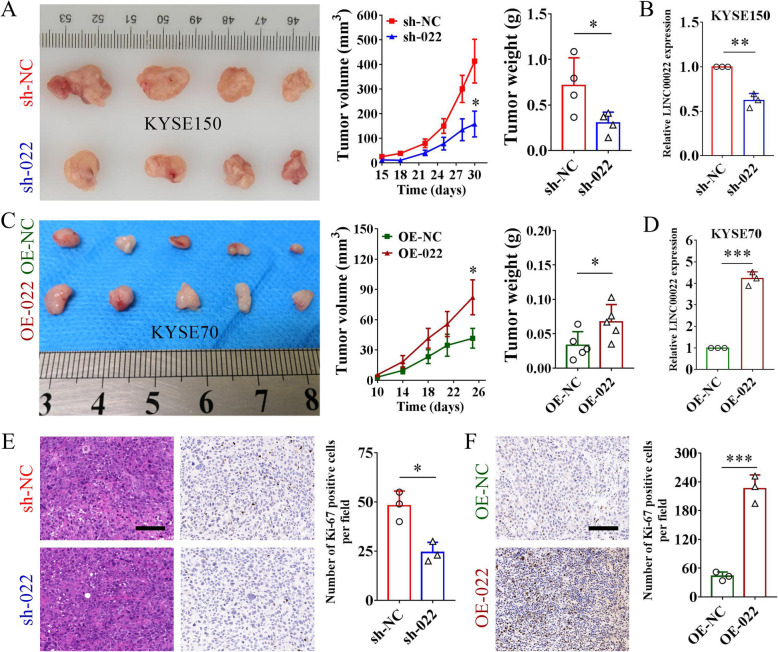
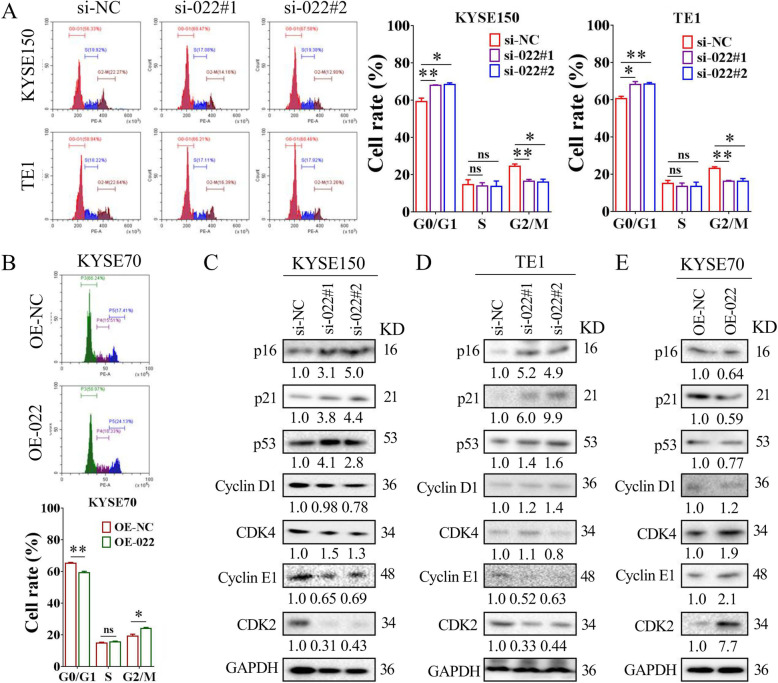
Methods: Multiple ESCC datasets were used to analyze gene expression in tumor tissues and normal tissues. Kaplan-Meier method and the ROC curve were conducted to evaluate the prognostic value and diagnostic value of LINC00022 in ESCC, respectively. Both gain-of-function and loss-of-function experiments were employed to investigate the effects of LINC00022 on ESCC growth in vitro and in vivo. Bioinformatics analysis, colorimetric m6A assay, RIP, MeRIP and co-IP was performed to explore the epigenetic mechanism of LINC00022 up-regulation in ESCC.

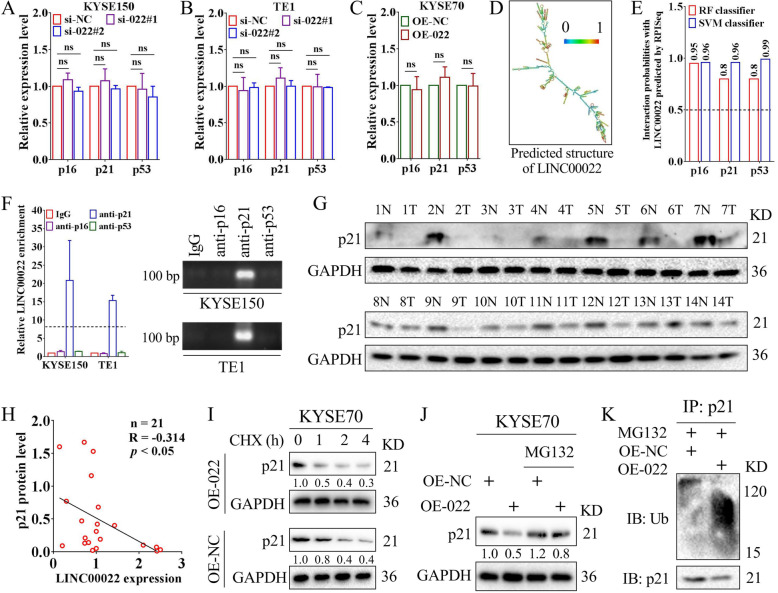
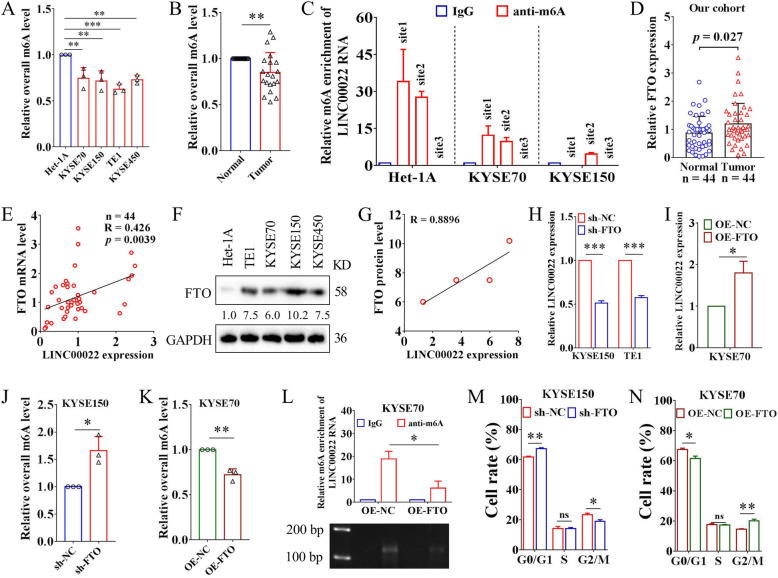
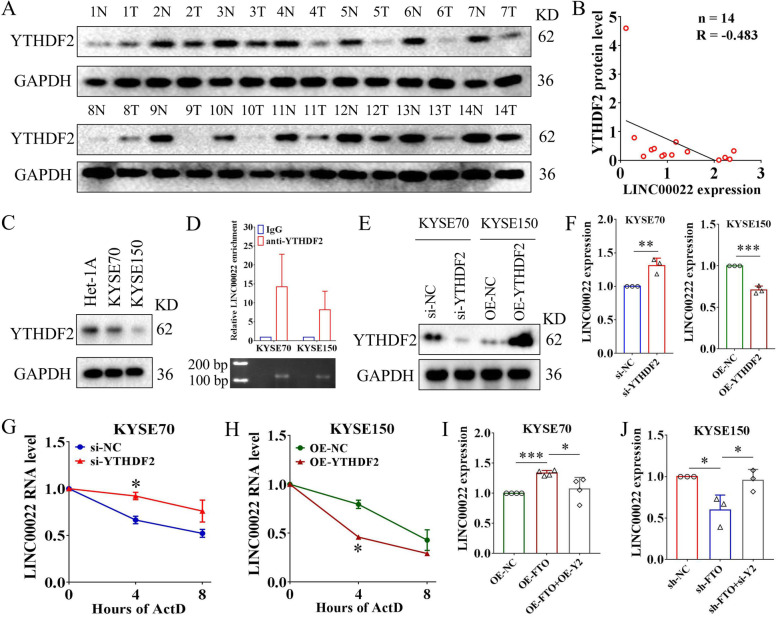
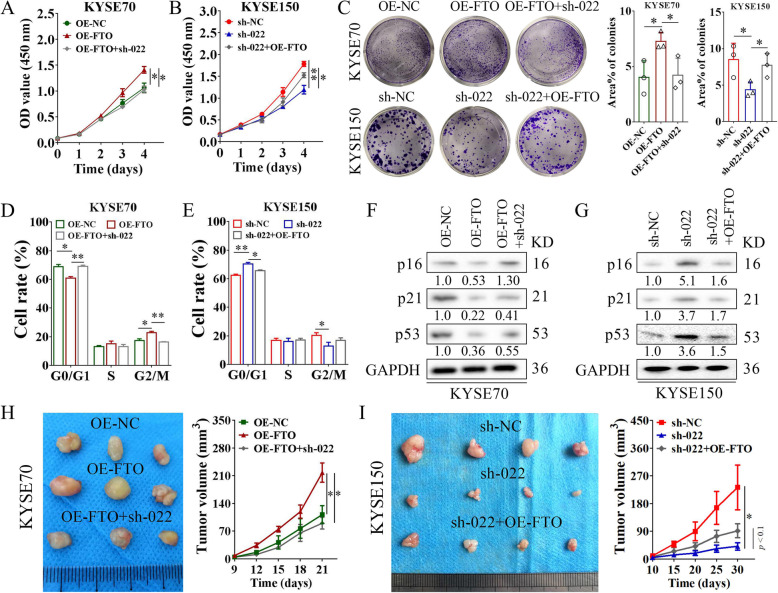
Results: Here we report that m6A demethylation of LncRNA LINC00022 by fat mass and obesity-associated protein (FTO) promotes tumor growth of ESCC in vivo. Clinically, we revealed that LINC00022 was up-regulated in primary ESCC samples and was predictive of poor clinical outcome for ESCC patients. Mechanistically, LINC00022 directly binds to p21 protein and promotes its ubiquitination-mediated degradation, thereby facilitating cell-cycle progression and proliferation. Further, the elevated FTO in ESCC decreased m6A methylation of LINC00022 transcript, leading to the inhibition of LINC00022 decay via the m6A reader YTHDF2. Over-expression of FTO was shown to drive LINC00022-dependent cell proliferation and tumor growth of ESCC.

Conclusions: Thus, this study demonstrated m6A-mediated epigenetic modification of LncRNA contributes to the tumorigenesis in ESCC and LINC00022, specific target of m6A, serves as a potential biomarker for this malignancy.

Keywords: Cell cycle; Esophageal squamous cell carcinoma; FTO; LINC00022; N6-methyladenosine; Tumorigenesis.


Conflict of interest statement

No potential conflicts of interest.

Figures

Fig. 1
Fig. 1
Up-regulated LINC00022 predicts poor prognosis of ESCC patients. (A) LINC00022 was one of the most up-regulated LncRNAs in two independent ESCC cohorts from GSE75241 and TCGA. The overall differentially expressed LncRNAs (DELncRNAs) in GSE75241 (15 normal tissues vs. 15 tumor tissues) dataset were shown as a heat map (A, upper left). The top-200 up-regulated DELncRNAs in TCGA-ESCC (11 normal tissues vs. 81 tumor tissues) dataset were shown as a heat map (A, upper right). The Venn diagram in the middle shows that LINC00022 is the only overlapped LncRNA in the two discovery datasets. Box plots from both GSE75241 and TCGA-ESCC datasets indicate the significant up-regulation of LINC00022 in ESCC tumor samples as compared to normal samples (A, bottom). (B) The elevation of LINC00022 was validated by additional three ESCC cohorts, including our in-house cohort (a, 44 pairs of ESCC tissues), GEPIA cohort (b, 286 normal tissues vs. 182 tumor tissues) and CRN cohort (c, 10 normal tissues vs. 39 tumor tissues). (C-D) The diagnostic values of LINC00022 in our cohort and GSE75241 cohort were evaluated by ROC. (E) The prognostic significance of LINC00022 in GEPIA cohort was determined by the Kaplan-Meier method. Increased LINC00022 expression predicted an unfavorable patient OS. (F) The expression of LINC00022 in Het-1A, TE1, KYSE70, KYSE150 and KYSE450 was examined by qRT-PCR, *p < 0.05; **p < 0.01
Fig. 2
Fig. 2
LINC00022 facilitates ESCC proliferation in vitro. (A) The knockdown efficiencies of three specific siRNAs on LINC00022 in KYSE150 and TE1 cells were tested by qRT-PCR, ***p < 0.001. (B) The expression of LINC00022 in KYSE70 cells infected with recombinant over-expressed lentivirus (OE-022) was determined by qRT-PCR, **p < 0.01. (C-E) CCK-8 assay was carried out to evaluate cell viability of KYSE150 and TE1 with LINC00022 knockdown (C, D), and KYSE70 with LINC00022 over-expression (E), *p < 0.05; **p < 0.01. (F-G) Ablation of LINC00022 attenuated the colony formation ability of KYSE150 and TE1 (F), while over-expression of LINC00022 enhanced the colony formation ability of KYSE70 (G), *p < 0.05; **p < 0.01; ***p < 0.001. (H-I) EdU staining assay was conducted to examine cell proliferation of KYSE150 and TE1 with LINC00022 knockdown (H), and KYSE70 with LINC00022 over-expression (I), *p < 0.05; **p < 0.01. Scale bar = 100 μm
Fig. 3
Fig. 3
LINC00022 promotes tumorigenesis of ESCC in vivo. (A) Knockdown of LINC00022 effectively attenuated cell growth of KYSE150 in nude mice (n = 4) (left panel). The tumor volume was recorded every three days from day 15 to day 30 after cell transplantation, and the curve was plotted (middle panel). Tumors were weighed immediately after removed from the nude mice (right panel), *p < 0.05. (B) The expression of LINC00022 in tumors was analyzed by qRT-PCR, **p < 0.01. (C) Over-expression of LINC00022 evidently promoted subcutaneous tumorigenicity of KYSE70 cells in nude mice (n = 5) (left panel). The tumor volume was monitored every four days from day 10 to day 26 after cell inoculation, and the curve was generated (middle panel). Over-expression of LINC00022 resulted in greater tumor size (right panel), *p < 0.05. (D) Analysis of LINC00022 expression in tumors by qRT-PCR, ***p < 0.001. (E) Tumor sections were stained with HE (left panel) and Ki-67 antibody (middle panel) (scale bar = 100 μm). Tumor sections with LINC00022 knockdown had fewer Ki-67 positive cells (right panel), *p < 0.05. (F) The number of Ki-67 positive cells in tumor sections was examined by IHC (left panel). Tumors with LINC00022 over-expression had more Ki-67 positive cells (right panel), ***p < 0.001
Fig. 4
Fig. 4
LINC00022 promotes cell-cycle progression in ESCC cells. (A) Cell cycle phase distribution of KYSE150 and TE1 following siRNA-mediated knockdown of LINC00022 was detected by PI-staining flow cytometry (left panel). Ablation of LINC00022 led to a significant increase in the proportion of cells in G0/G1 phase, a slight decrease in the proportion of cells in S phase but with no significant difference, and an obvious decrease in the proportion of cells in G2/M phase (right panel), *p < 0.05; **p < 0.01; ns means no significance. (B) Cell-cycle change of KYSE70 cells after LINC00022 over-expression was evaluated by PI-labeling flow cytometry (upper panel). Up-regulation of LINC00022 resulted in a significant reduction in the proportion of cells in G0/G1 phase, a slight increase in the proportion of cells in S phase but with no significant difference, and a dramatic elevation in the proportion of cells in G2/M phase (nether panel), *p < 0.05; **p < 0.01; ns means no significance. (C-E) Western blot was used to detect the changes of cell cycle regulator protein levels in KYSE150 (C) and TE1 (D) cells following LINC00022 knockdown, and in KYSE70 (E) cells following LINC00022 over-expression. The positive cell-cycle regulators include CDK2, Cyclin E1, CDK4 and Cyclin D1, while the negative regulators include p16, p21 and p53. The numbers below each band represent the relative protein levels change
Fig. 5
Fig. 5
LINC00022 promotes ubiquitin-mediated p21 protein instability. (A-C) The mRNA levels of p16, p21 and p53 in KYSE150 (A) and TE1 (B) cells following LINC00022 knockdown and in KYSE70 (C) cells following LINC00022 over-expression were tested by qRT-PCR, ns means no significance. The mRNA levels of p16, p21 and p53 in ESCC cells were not significantly affected by either LINC00022 knockdown or LINC00022 over-expression. (D) The putative secondary structure of LINC00022 transcript in minimum free energy (MFE) mode was computational analyzed by RNAfold server. (E) The affinity of LINC00022 transcript with p16, p21, and p53 proteins was predicted by the machine learning classifier RPISeq based on Random Forest (RF) and Support Vector Machine (SVM) classifiers. (F) The direct binding affinity of LINC00022 transcript with p16, p21, or p53 proteins was determined by RIP-qRT-PCR (left panel) and agarose gel electrophoresis (right panel). (G) Western blot was used to examine the protein levels of p21 in 21 pairs of ESCC tissues, of which 14 pairs were shown. N represents normal and T represents tumor. (H) Person’s Coefficient analysis revealed the negative correlation between LINC00022 transcription and p21 protein in 21 cases of ESCC tumors. (I) Western blot was performed to observe the effect of LINC00022 over-expression on the stability of p21 protein in ESCC cells in the presence of protein synthesis inhibitor CHX (100 μg/mL). (J) The proteasome inhibitor MG132 (5 μM) partially relieved the instability of p21 protein caused by LINC00022 over-expression. (K) Co-IP combined with Western blot revealed the activated ubiquitination of p21 protein induced by LINC00022 over-expression
Fig. 6
Fig. 6
FTO mediates m6A demethylation of LINC00022 and promotes its up-regulation. (A) The colorimetric m6A detection assay showed that the overall m6A levels in ESCC cells were decreased compared with Het-1A, **p < 0.01; ***p < 0.001. (B) The relative overall m6A level in 20 pairs of ESCC tissues was tested by the colorimetric m6A detection kit, **p < 0.01. (C) MeRIP combined with specific qRT-PCR was utilized to detect the relative m6A enrichment at three sites of LINC00022 transcript in Het-1A, KYSE70 and KYSE150 cells. Three putative m6A modification sites (site1, site2, site3) of LINC00022 RNA analyzed by SRAMP and RMBase V2.0 were shown in Supplementary Fig. 10B. (D) The mRNA levels of FTO in 44 pairs of ESCC tumor tissues and adjacent normal tissues were determined by qRT-PCR. (E) Person’s Coefficient analysis showed the positive correlation between LINC00022 transcription and FTO mRNA in 44 cases of ESCC tumors. (F) The protein levels of FTO in Het-1A, TE1, KYSE70, KYSE150 and KYSE450 cell lines were examined by Western blot. (G) Person’s Coefficient analysis revealed the positive correlation between LINC00022 transcription and FTO protein in TE1, KYSE70, KYSE150 and KYSE450 cells. (H-I) Knockdown or over-expression of FTO resulted in a significant decrease or increase in LINC00022 expression in ESCC cells revealed by qRT-PCR, *p < 0.05; ***p < 0.001. (J-K) Knockdown or over-expression of FTO led to an increase or decrease in overall m6A levels of RNAs in ESCC cells analyzed by colorimetric m6A detection kit, *p < 0.05; **p < 0.01. (L) MeRIP combined with specific qRT-PCR uncovered that FTO over-expression led to a dramatic decrease in m6A enrichment (site2) of LINC00022 transcript in KYSE70 cells (upper panel, **p < 0.05). The qRT-PCR products were then examined by agarose gel electrophoresis (nether panel). (M-N) Cell cycle phase distribution of KYSE150 or KYSE70 following lentivirus-mediated knockdown or over-expression of FTO was detected by PI-staining flow cytometry, *p < 0.05; **p < 0.01; ns means no significance
Fig. 7
Fig. 7
FTO-induced epigenetic up-regulation of LINC00022 is YTHDF2-dependent. (A) Western blot was used to examine the protein levels of YTHDF2 in 14 pairs of ESCC tissues. N represents normal and T represents tumor. (B) Person’s Coefficient analysis revealed the negative correlation between YTHDF2 protein and LINC00022 transcription in 14 cases of ESCC tumors. (C) The protein levels of YTHDF2 in Het-1A, KYSE70 and KYSE150 was examined by Western blot. (D) The direct binding affinity of LINC00022 transcript with YTHDF2 protein was determined by RIP-qRT-PCR (upper panel) and agarose gel electrophoresis (nether panel). (E) The knockdown or over-expression efficiencies of YTHDF2 mediated by recombinant lentivirus were verified by Western blot in KYSE70 and KYSE150 cells. (F) Knockdown or over-expression of YTHDF2 resulted in a significant increase or decrease in LINC00022 expression in ESCC cells revealed by qRT-PCR, **p < 0.01; ***p < 0.001. (G-H) The effect of knockdown or over-expression of YTHDF2 on the stability of LINC00022 transcript in ESCC cells in the presence of ActD (5 μg/mL) was tested by qRT-PCR, *p < 0.05. (I) Knockdown of YTHDF2 (si-Y2) significantly abolished FTO ablation-induced down-regulation of LINC00022 in KYSE150 cells, *p < 0.05. (J) The up-regulation of LINC00022 caused by FTO over-expression was relieved by increase of YTHDF2 (OE-Y2) in KYSE70 cells, *p < 0.05; ***p < 0.001
Fig. 8
Fig. 8
FTO/LINC00022 axis drives ESCC tumorigenesis. (A) Deletion of LINC00022 attenuated the proliferative effects induced by FTO over-expression in KYSE70 cells, *p < 0.05. (B) Ectopic expression of FTO partially relieved the inhibitory effects of proliferation caused by LINC00022 ablation in KYSE150 cells, *p < 0.05; **p < 0.01. (C) The non-population-dependent growth ability of ESCC cells under the control of the FTO/LINC00022 axis was evaluated by the colony formation assay, *p < 0.05. (D-E) PI-labeling staining combined with flow cytometry indicated the role of FTO/LINC00022 axis in ESCC cell-cycle progression, *p < 0.05; **p < 0.01. (F-G) Western blot was used to investigate the changes of cell cycle regulator protein levels, p16, p21 and p53 in KYSE70 (F) and KYSE150 (G) cells following FTO-LINC00022 cross-talking. (H) Knockdown of LINC00022 fully rescued the growth promotion effect induced by ectopic FTO expression on KYSE70 cells in nude mice (n = 3) (left panel). The tumor volume was measured every three days from day 9 to day 21 after cell inoculation, and the curve was plotted (right panel), *p < 0.05. (I) Over-expression of FTO partially attenuated the inhibition of subcutaneous tumorigenicity caused by LINC00022 knockdown on KYSE150 cells in nude mice (n = 4) (left panel). The tumor volume was monitored every five days from day 10 to day 30 after cell inoculation, and the curve was generated (right panel), *p < 0.05

References

    1. Sung H, Ferlay J, Siegel RL, Laversanne M, Soerjomataram I, Jemal A, Bray F. Global cancer statistics 2020: GLOBOCAN estimates of incidence and mortality worldwide for 36 cancers in 185 countries. CA Cancer J Clin. 2021;71(3):209–249. doi: 10.3322/caac.21660. - DOI - PubMed
    1. Smyth EC, Lagergren J, Fitzgerald RC, Lordick F, Shah MA, Lagergren P, Cunningham D. Oesophageal cancer. Nat Rev Dis Primers. 2017;3(1):17048. doi: 10.1038/nrdp.2017.48. - DOI - PMC - PubMed
    1. Bray F, Ferlay J, Soerjomataram I, Siegel RL, Torre LA, Jemal A. Global cancer statistics 2018: GLOBOCAN estimates of incidence and mortality worldwide for 36 cancers in 185 countries. CA Cancer J Clin. 2018;68(6):394–424. doi: 10.3322/caac.21492. - DOI - PubMed
    1. Arnold M, Soerjomataram I, Ferlay J, Forman D. Global incidence of oesophageal cancer by histological subtype in 2012. Gut. 2015;64(3):381–387. doi: 10.1136/gutjnl-2014-308124. - DOI - PubMed
    1. Torre LA, Bray F, Siegel RL, Ferlay J, Lortet-Tieulent J, Jemal A. Global cancer statistics, 2012. CA Cancer J Clin. 2015;65(2):87–108. doi: 10.3322/caac.21262. - DOI - PubMed

MeSH terms

Substances

LinkOut - more resources