. 2021 Nov 15;27(22):6209-6221.
doi: 10.1158/1078-0432.CCR-21-0361. Epub 2021 Sep 20.

IL13Rα2 Promotes Proliferation and Outgrowth of Breast Cancer Brain Metastases

Affiliations

IL13Rα2 Promotes Proliferation and Outgrowth of Breast Cancer Brain Metastases

R Alejandro Márquez-Ortiz et al. Clin Cancer Res. .

Abstract

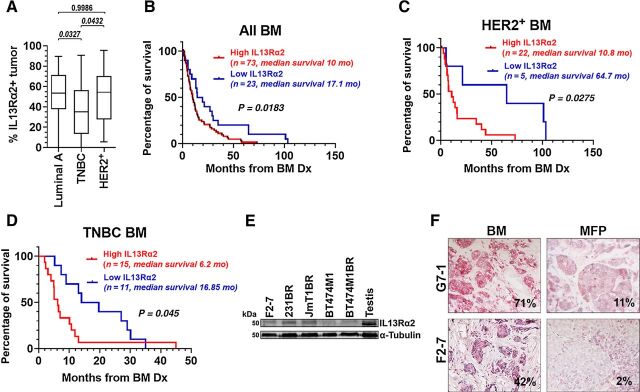
Purpose: The survival of women with brain metastases (BM) from breast cancer remains very poor, with over 80% dying within a year of their diagnosis. Here, we define the function of IL13Rα2 in outgrowth of breast cancer brain metastases (BCBM) in vitro and in vivo, and postulate IL13Rα2 as a suitable therapeutic target for BM.

Experimental design: We performed IHC staining of IL13Rα2 in BCBM to define its prognostic value. Using inducible shRNAs in TNBC and HER2+ breast-brain metastatic models, we assessed IL13Rα2 function in vitro and in vivo. We performed RNAseq and functional studies to define the molecular mechanisms underlying IL13Rα2 function in BCBM.

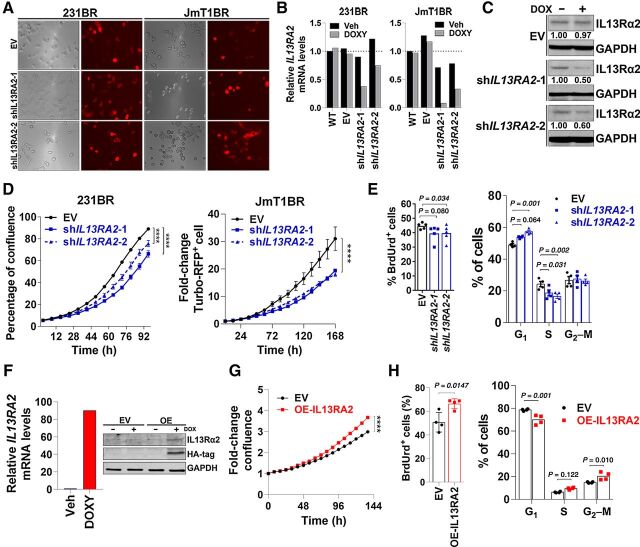
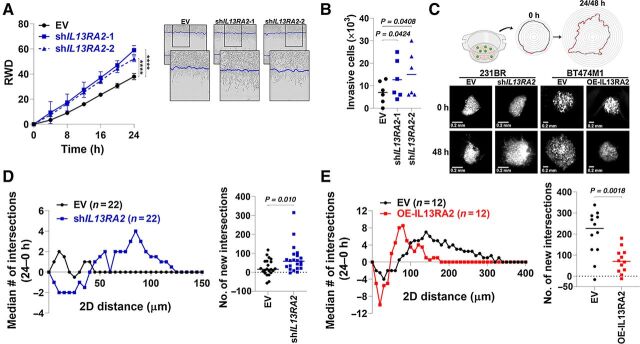
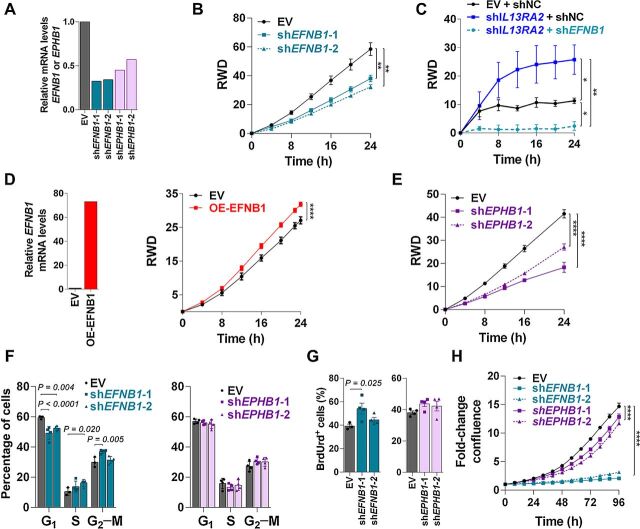
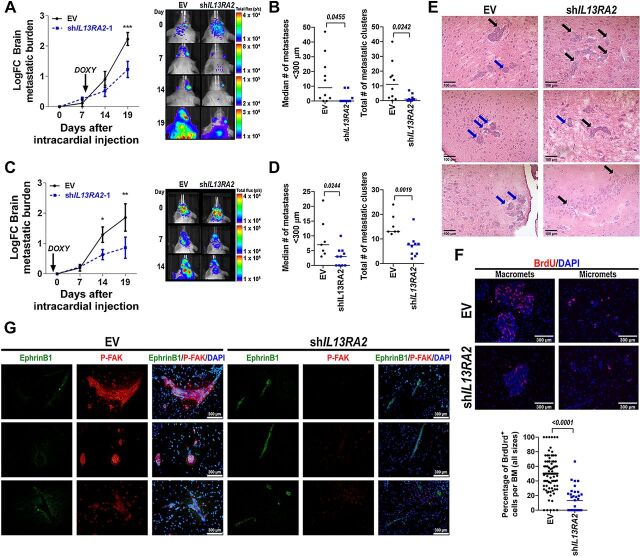
Results: High IL13Rα2 expression in BCBM predicted worse survival after BM diagnoses. IL13Rα2 was essential for cancer-cell survival, promoting proliferation while repressing invasion. IL13Rα2 KD resulted in FAK downregulation, repression of cell cycle and proliferation mediators, and upregulation of Ephrin B1 signaling. Ephrin-B1 (i) promoted invasion of BC cells in vitro, (ii) marked micrometastasis and invasive fronts in BCBM, and (iii) predicted shorter disease-free survival and BM-free survival (BMFS) in breast primary tumors known to metastasize to the brain. In experimental metastases models, which bypass early tumor invasion, downregulation of IL13Rα2 before or after tumor seeding and brain intravasation decreased BMs, suggesting that IL13Rα2 and the promotion of a proliferative phenotype is critical to BM progression.

Conclusions: Non-genomic phenotypic adaptations at metastatic sites are critical to BM progression and patients' prognosis. This study opens the road to use IL13Rα2 targeting as a therapeutic strategy for BM.


Figures

Figure 1. IL13Rα2 expression is high in BM, and increased levels predict worse survival after brain metastasis diagnoses. A, IL13Rα2 IHC staining was scored using Aperio Digital Imaging, and tumoral areas with strong intensity scores were considered positive. Graph shows percentage of positive tumor area for a cohort of BM samples from Luminal A (n = 32), HER2+ (n = 27), and TNBC (n = 26) breast cancer subtypes. Data were analyzed using ANOVA. Adjusted P value is shown. B, All BMs (n = 96) were classified as high (≥25% + tumor, blue) versus low IL13Rα2 (<25% + tumor, red), and percentage of survival following BM diagnoses was plotted. C, HER2+ BMs (n = 27) were classified as high or low IL13Rα2 as in B. D, TNBC BMs (N = 26) were classified as high or low IL13Rα2 expression as in B. Kaplan–Meier curves (B–D) were analyzed using the log-rank test. E, WB shows IL13Rα2 expression in breast cancer cells. F, The percentage of tumoral area expressing IL13Rα2 in clinical BM (F2–7, G7–1) as compared with the same tumors growing as PDXs in the mammary fat pad (MFP) of NSG mice.
Figure 1.
IL13Rα2 expression is high in BM, and increased levels predict worse survival after brain metastasis diagnoses. A, IL13Rα2 IHC staining was scored using Aperio Digital Imaging, and tumoral areas with strong intensity scores were considered positive. Graph shows percentage of positive tumor area for a cohort of BM samples from Luminal A (n = 32), HER2+ (n = 27), and TNBC (n = 26) breast cancer subtypes. Data were analyzed using ANOVA. Adjusted P value is shown. B, All BMs (n = 96) were classified as high (≥25% + tumor, blue) versus low IL13Rα2 (<25% + tumor, red), and percentage of survival following BM diagnoses was plotted. C, HER2+ BMs (n = 27) were classified as high or low IL13Rα2 as in B. D, TNBC BMs (N = 26) were classified as high or low IL13Rα2 expression as in B. Kaplan–Meier curves (BD) were analyzed using the log-rank test. E, WB shows IL13Rα2 expression in breast cancer cells. F, The percentage of tumoral area expressing IL13Rα2 in clinical BM (F2–7, G7–1) as compared with the same tumors growing as PDXs in the mammary fat pad (MFP) of NSG mice.
Figure 2. IL13Rα2 promotes proliferation of breast cancer cells. A, 231BR and JmT1BR3 cells were transfected with a lentiviral vector expressing the empty vector (EV) or shRNAs targeting IL13RA2 (shIL13RA2-1 or -2) upstream of Turbo-RFP reporter under doxycycline control. Image shows brightfield and RFP expression after 72 hours treatment with 1 μg/mL doxycycline. B, 231BR and JmT1BR3 cells expressing EV or shIL13RA2 were treated for 48 hours with vehicle or 1 μg/mL doxycycline. Graph shows IL13RA2 mRNA levels normalized to GAPDH and relative to WT (veh). C, Cells were cultured as in (B) for 72 hours, and IL13Rα2 protein expression was assessed by Western blot. GAPDH was used as loading control. Numbers indicate IL13Rα2 fold change relative to vehicle-treated cells. D, 231BR and JmT1BR3 cells expressing EV or shIL13RA2 were treated with doxycycline (1 μg/mL), and percentage of confluence (for clonal 231BR cells) or Turbo-RFP expression (for pooled JmT1BR3 cells) was measured over time using Incucyte live imaging (n = 5/6 treatment). Data analyzed with repeated measures ANOVA followed by multiple comparison post hoc corrections. ****, P < 0.001 at the last time point. E, 231BR cells expressing EV or shIL13RA2 were induced with doxycycline for 72 hours then treated with BrdUrd by 1 hour. BrdUrd incorporation (%, left) and cell-cycle analysis by PI (right) were measured by flow cytometry (n = 4). Adjusted P values are shown. F, Human IL13Rα2 with a hemagglutinin (HA) tag was overexpressed (OE) in a doxycycline inducible system in BT474M1 cells. IL13RA2 mRNA levels normalized to GAPDH and relative to the vehicle-treated cells (left). WB shows anti-HA and anti-IL13Rα2 (right). Induction with 0.5 μg/mL of doxycycline was allowed by 48 and 96 hours for qRT-PCR and WB, respectively. G, BT474M1 EV and OE-IL13RA2 cells were treated with 0.5 μg/mL of doxycycline and percentage of confluence measured over time as in D. Fold change in confluence relative to day 0 ± S.E.M. H, DNA replication and cell cycle were determined by BrdUrd (2 hours pulse) and propidium iodide (PI) incorporation in BT474M1 cells as in (E). ****, P < 0.001.
Figure 2.
IL13Rα2 promotes proliferation of breast cancer cells. A, 231BR and JmT1BR3 cells were transfected with a lentiviral vector expressing the empty vector (EV) or shRNAs targeting IL13RA2 (shIL13RA2-1 or -2) upstream of Turbo-RFP reporter under doxycycline control. Image shows brightfield and RFP expression after 72 hours treatment with 1 μg/mL doxycycline. B, 231BR and JmT1BR3 cells expressing EV or shIL13RA2 were treated for 48 hours with vehicle or 1 μg/mL doxycycline. Graph shows IL13RA2 mRNA levels normalized to GAPDH and relative to WT (veh). C, Cells were cultured as in (B) for 72 hours, and IL13Rα2 protein expression was assessed by Western blot. GAPDH was used as loading control. Numbers indicate IL13Rα2 fold change relative to vehicle-treated cells. D, 231BR and JmT1BR3 cells expressing EV or shIL13RA2 were treated with doxycycline (1 μg/mL), and percentage of confluence (for clonal 231BR cells) or Turbo-RFP expression (for pooled JmT1BR3 cells) was measured over time using Incucyte live imaging (n = 5/6 treatment). Data analyzed with repeated measures ANOVA followed by multiple comparison post hoc corrections. ****, P < 0.001 at the last time point. E, 231BR cells expressing EV or shIL13RA2 were induced with doxycycline for 72 hours then treated with BrdUrd by 1 hour. BrdUrd incorporation (%, left) and cell-cycle analysis by PI (right) were measured by flow cytometry (n = 4). Adjusted P values are shown. F, Human IL13Rα2 with a hemagglutinin (HA) tag was overexpressed (OE) in a doxycycline inducible system in BT474M1 cells. IL13RA2 mRNA levels normalized to GAPDH and relative to the vehicle-treated cells (left). WB shows anti-HA and anti-IL13Rα2 (right). Induction with 0.5 μg/mL of doxycycline was allowed by 48 and 96 hours for qRT-PCR and WB, respectively. G, BT474M1 EV and OE-IL13RA2 cells were treated with 0.5 μg/mL of doxycycline and percentage of confluence measured over time as in D. Fold change in confluence relative to day 0 ± S.E.M. H, DNA replication and cell cycle were determined by BrdUrd (2 hours pulse) and propidium iodide (PI) incorporation in BT474M1 cells as in (E). ****, P < 0.001.
Figure 3. High levels of IL13Rα2 repress invasion of BC cells. A, 231BR cells expressing EV and shIL13RA2 were plated in a confluent monolayer and serum-starved overnight, and a modified Matrigel-filled scratch-wound was used to assess invasion. Left, Graph shows relative wound density (RWD) over time (left). Data analyzed with repeated measures ANOVA followed by multiple comparison post hoc corrections. ****, P < 0.001 at the last time point. Right, Representative images show invasive front. Blue line marks initial wound-edge. B, 231BR serum-starved cells were assessed for their ability to invade through a Matrigel-coated filter (8-μm pore size) in Boyden chambers. Graph shows number of cells in the lower reservoir after 24 hours. C, Invasion assay in organotypic brain slices. 231BR and BT474M1 eGFP+ spheres expressing EV, shIL13RA2 (for 231BR cells) or OE-IL13RA2 (for BT474M1 cells) were seeded on top of organotypic brain slices. Edges of spheres were monitored over time by fluorescence microcopy and new intersections to concentric circles determined. Representative images for the same sphere/treatment at 0 and 48 hours are shown. D, 231BR EV or shIL13RA2 cells were assayed as in C and new intersections quantified after 24 hours. Left, Median number of new intersections/sphere in 5-μm increments from initial sphere edge 24 hours. Right, Total number of new intersections per sphere after 24 hours. E, Invasion of BT474M1 EV or OE-IL13RA2 cells was analyzed as in D.
Figure 3.
High levels of IL13Rα2 repress invasion of BC cells. A, 231BR cells expressing EV and shIL13RA2 were plated in a confluent monolayer and serum-starved overnight, and a modified Matrigel-filled scratch-wound was used to assess invasion. Left, Graph shows relative wound density (RWD) over time (left). Data analyzed with repeated measures ANOVA followed by multiple comparison post hoc corrections. ****, P < 0.001 at the last time point. Right, Representative images show invasive front. Blue line marks initial wound-edge. B, 231BR serum-starved cells were assessed for their ability to invade through a Matrigel-coated filter (8-μm pore size) in Boyden chambers. Graph shows number of cells in the lower reservoir after 24 hours. C, Invasion assay in organotypic brain slices. 231BR and BT474M1 eGFP+ spheres expressing EV, shIL13RA2 (for 231BR cells) or OE-IL13RA2 (for BT474M1 cells) were seeded on top of organotypic brain slices. Edges of spheres were monitored over time by fluorescence microcopy and new intersections to concentric circles determined. Representative images for the same sphere/treatment at 0 and 48 hours are shown. D, 231BR EV or shIL13RA2 cells were assayed as in C and new intersections quantified after 24 hours. Left, Median number of new intersections/sphere in 5-μm increments from initial sphere edge 24 hours. Right, Total number of new intersections per sphere after 24 hours. E, Invasion of BT474M1 EV or OE-IL13RA2 cells was analyzed as in D.
Figure 4. Downregulation of IL13RA2 decreases FAK/SRC but upregulates Ephrin B signaling. A, 231BR cells expressing EV or shIL13RA2 were induced with doxycycline for 48 hours, and treated with vehicle or 10 ng/mL human recombinant IL-13 (hrIL-13) in an invasion assay. Graph shows relative wound density (RWD) over time (n = 6–10 wells per group), in a modified Matrigel-filled scratch-wound assay. Data analyzed with repeated measures ANOVA followed by multiple comparison post hoc corrections. Adjusted P value at last time point *, P < 0.05; **, P < 0.01. B, WB show signaling pathways in 231BR EV or shIL13RA2 cells induced with doxycycline for 72 hours, serum starved overnight, and then treated with 10 ng/mL hrIL-13 for the indicated times. Plot shows quantification of pFAK/FAK and P-SRC/SRC from two independent experiments. C, WB shows P-FAK and FAK in BT474.M1 cells expressing EV or OE-IL13RA2, induced with doxycycline for 72 hours and treated with vehicle or 10 ng/mL hrIL-13 for 5 minutes. GAPDH is loading control. D, Global RNA sequencing was performed in doxycycline-induced 231BR EV versus 231BR shIL13RA2 cells 48 hours after doxycycline induction (n = 3/group). Volcano plot shows differentially expressed genes in EV versus shIL13RA2 cells. Red dots are genes with log2 FC>1.5 and P < 0.05. E, Ingenuity Pathway Analysis (IPA). The P value (calculated with Fischer's exact test) and Z-score were determined to establish any probable association between our set of genes and a specific pathway. Left, Ephrin B signaling is the only pathway modulated in shIL13RA2 cells with a significant P value and ≥2 positive Z-score. Right, The log2-transformed fold change in expression of upregulated genes in the Ephrin B1 signaling pathway (KALRN, EPHB1, CXCR4, and EFNB1). F, Relative mRNA expression of EphB1 receptor (EPHB1) and ephrin B1-ligand (EFNB1) in EV versus shIL13RA2 231BR cells (n = 3). G, WB shows ephrin B1 expression in 231BR expressing EV or shIL13RA2, and BT474 cells expressing EV or OE-IL13RA2. GAPDH was used as loading control. Numbers show ephrin B1 levels normalized to GAPDH and relative to EV control. H, IHC staining of ephrin B1 expression in BCBMs. Representative images of the tumor invasive front in late BM are shown in zoom-in.
Figure 4.
Downregulation of IL13RA2 decreases FAK/SRC but upregulates Ephrin B signaling. A, 231BR cells expressing EV or shIL13RA2 were induced with doxycycline for 48 hours, and treated with vehicle or 10 ng/mL human recombinant IL-13 (hrIL-13) in an invasion assay. Graph shows relative wound density (RWD) over time (n = 6–10 wells per group), in a modified Matrigel-filled scratch-wound assay. Data analyzed with repeated measures ANOVA followed by multiple comparison post hoc corrections. Adjusted P value at last time point *, P < 0.05; **, P < 0.01. B, WB show signaling pathways in 231BR EV or shIL13RA2 cells induced with doxycycline for 72 hours, serum starved overnight, and then treated with 10 ng/mL hrIL-13 for the indicated times. Plot shows quantification of pFAK/FAK and P-SRC/SRC from two independent experiments. C, WB shows P-FAK and FAK in BT474.M1 cells expressing EV or OE-IL13RA2, induced with doxycycline for 72 hours and treated with vehicle or 10 ng/mL hrIL-13 for 5 minutes. GAPDH is loading control. D, Global RNA sequencing was performed in doxycycline-induced 231BR EV versus 231BR shIL13RA2 cells 48 hours after doxycycline induction (n = 3/group). Volcano plot shows differentially expressed genes in EV versus shIL13RA2 cells. Red dots are genes with log2 FC>1.5 and P < 0.05. E, Ingenuity Pathway Analysis (IPA). The P value (calculated with Fischer's exact test) and Z-score were determined to establish any probable association between our set of genes and a specific pathway. Left, Ephrin B signaling is the only pathway modulated in shIL13RA2 cells with a significant P value and ≥2 positive Z-score. Right, The log2-transformed fold change in expression of upregulated genes in the Ephrin B1 signaling pathway (KALRN, EPHB1, CXCR4, and EFNB1). F, Relative mRNA expression of EphB1 receptor (EPHB1) and ephrin B1-ligand (EFNB1) in EV versus shIL13RA2 231BR cells (n = 3). G, WB shows ephrin B1 expression in 231BR expressing EV or shIL13RA2, and BT474 cells expressing EV or OE-IL13RA2. GAPDH was used as loading control. Numbers show ephrin B1 levels normalized to GAPDH and relative to EV control. H, IHC staining of ephrin B1 expression in BCBMs. Representative images of the tumor invasive front in late BM are shown in zoom-in.
Figure 5. Downregulation of EFNB1 impairs invasion and promotes DNA synthesis. A, 231BR cells expressing EV or shRNAs targeting EFNB1 (shEFNB1–1/2) or EPHB1 (shEPHB1–1/2) were cultured for 48 hours. EFNB1 and EPHB1 mRNA levels were detected by RT-qPCR, normalized to GAPDH, and reported as relative to EV. B, 231BR cells expressing EV and shEFNB1–1/2 were plated in a confluent monolayer and serum starved overnight, and a modified Matrigel-filled scratch wound was used to assess invasion. Graph shows relative wound density (RWD) over time (n = 6–10 wells per group). Data analyzed with repeated measures ANOVA followed by multiple comparison post hoc corrections. **, P < 0.01; ****, P < 0.001 at the last time point. C, 231BR cells expressing EV or shIL13RA2 were transduced with shNC or shEFNB1 as indicated, and induced with doxycycline for 72 hours before plating. Invasion was measured as in B. *, P < 0.05; **, P < 0.01. D, 231BR cells were transfected with a lentiviral empty vector (EV) or overexpressing EFNB1 gene (OE-EFNB1). Left, Graph shows EFNB1 mRNA levels normalized to GAPDH and relative to EV cells. Right, Graphs show invasion of 231-EV and OE-EFNB1 analyzed as in B. ****, P < 0.001 at the last time point. E, 231BR cells expressing EV or shEPHB1–1/2 were plated and analyzed for invasion as in B. F, 231BR cells expressing EV and shEFNB1–1/2 or shEPHB1–1/2 were plated for 48 hours, treated with BrdUrd, 1 hour stained with PI for cell-cycle analysis. Graph shows cell-cycle analysis by flow cytometry (n = 4). Adjusted P values are shown. G, BrdUrd incorporation measured in cells from F. H, 231BR cells expressing EV and shEFNB1–1/2 or shEPHB1–1/2 were plated, and percentage of confluence was measured over time using Incucyte live imaging (n = 5 wells per treatment). Data analyzed with repeated measures ANOVA followed by multiple comparison post hoc corrections. ****, P < 0.001 at the last time point.
Figure 5.
Downregulation of EFNB1 impairs invasion and promotes DNA synthesis. A, 231BR cells expressing EV or shRNAs targeting EFNB1 (shEFNB1–1/2) or EPHB1 (shEPHB1–1/2) were cultured for 48 hours. EFNB1 and EPHB1 mRNA levels were detected by RT-qPCR, normalized to GAPDH, and reported as relative to EV. B, 231BR cells expressing EV and shEFNB1–1/2 were plated in a confluent monolayer and serum starved overnight, and a modified Matrigel-filled scratch wound was used to assess invasion. Graph shows relative wound density (RWD) over time (n = 6–10 wells per group). Data analyzed with repeated measures ANOVA followed by multiple comparison post hoc corrections. **, P < 0.01; ****, P < 0.001 at the last time point. C, 231BR cells expressing EV or shIL13RA2 were transduced with shNC or shEFNB1 as indicated, and induced with doxycycline for 72 hours before plating. Invasion was measured as in B. *, P < 0.05; **, P < 0.01. D, 231BR cells were transfected with a lentiviral empty vector (EV) or overexpressing EFNB1 gene (OE-EFNB1). Left, Graph shows EFNB1 mRNA levels normalized to GAPDH and relative to EV cells. Right, Graphs show invasion of 231-EV and OE-EFNB1 analyzed as in B. ****, P < 0.001 at the last time point. E, 231BR cells expressing EV or shEPHB1–1/2 were plated and analyzed for invasion as in B. F, 231BR cells expressing EV and shEFNB1–1/2 or shEPHB1–1/2 were plated for 48 hours, treated with BrdUrd, 1 hour stained with PI for cell-cycle analysis. Graph shows cell-cycle analysis by flow cytometry (n = 4). Adjusted P values are shown. G, BrdUrd incorporation measured in cells from F. H, 231BR cells expressing EV and shEFNB1–1/2 or shEPHB1–1/2 were plated, and percentage of confluence was measured over time using Incucyte live imaging (n = 5 wells per treatment). Data analyzed with repeated measures ANOVA followed by multiple comparison post hoc corrections. ****, P < 0.001 at the last time point.
Figure 6. Downregulation of IL13Rα2 reduces brain metastatic progression. A, Female NSG mice were injected intracardially with 175.000 231BR-EV (n = 10) or shIL13RA2 cells (N = 9) expressing luciferase, and cells were allowed to seed and colonize for 7 days before induction with doxycycline. Brain metastatic burden was measured via in vivo imaging immediately after cell injection and the indicated times. Head total flux for each animal was normalized to brain signal at time 0 (Fold Change FC). Left, Graph shows Log-transformed FC ± SEM over time for EV versus shIL13RA2-injected mice. Arrow indicates start point for doxycycline treatment. Normally distributed Log-transformed FC values were analyzed using Repeated Measures Mixed effects. Right, Representative image of brain metastatic burden in mice injected with shEV and shIL13RA2. ***, P = 0.0007 at the indicated time point. B, Histologic quantification of BMs from mice in A. Left, Each dot represents the median number of micrometastases (<300 μm) per mouse, and the line designates the group median. Right, Each dot represents the total number of metastatic clusters per mouse. Data were analyzed using the Mann–Whitney test. C, Female NSG mice were injected as in A (n = 10/group), but cells and mice had been pretreated with doxycycline for 2 days before cell injection. Left, Graph shows Log-transformed FC ± SEM over time for EV versus shIL13RA2 injected mice. Normally distributed Log-transformed FC values were analyzed using Repeated Measures Mixed effects. *, P = 0.045; **, P = 0.0052 at the indicated time points. Right, Representative image of brain metastatic burden in mice injected with shEV and shIL13RA2 in this experiment. D, Histologic quantification of BMs for mice in C surviving at day 19 (n = 7 for EV, N = 10 for shIL13RA2). E, Representative images of BM in EV versus shIL13RA2 from A to B. Blue arrows denote BMs with a “less invasive” growth pattern, black arrows BMs with invasive fronts. F, Mice from A were injected with BrdUrd 2 hours before euthanasia, and BrdUrd incorporation in BMs was quantified by IF. Top, Representative image of BrdUrd staining in macro- and micromets from EV versus shIL13RA2 mice. Bottom, Percentage of BrdUrd+ cells quantified in individual metastases from four mice with histologically detectable BMs per group. G, Double-IF staining of p-FAK (red) and ephrin B1 (green) in BMs from EV versus shIL13RA2 mice. Blue is DAPI.
Figure 6.
Downregulation of IL13Rα2 reduces brain metastatic progression. A, Female NSG mice were injected intracardially with 175.000 231BR-EV (n = 10) or shIL13RA2 cells (N = 9) expressing luciferase, and cells were allowed to seed and colonize for 7 days before induction with doxycycline. Brain metastatic burden was measured via in vivo imaging immediately after cell injection and the indicated times. Head total flux for each animal was normalized to brain signal at time 0 (Fold Change FC). Left, Graph shows Log-transformed FC ± SEM over time for EV versus shIL13RA2-injected mice. Arrow indicates start point for doxycycline treatment. Normally distributed Log-transformed FC values were analyzed using Repeated Measures Mixed effects. Right, Representative image of brain metastatic burden in mice injected with shEV and shIL13RA2. ***, P = 0.0007 at the indicated time point. B, Histologic quantification of BMs from mice in A. Left, Each dot represents the median number of micrometastases (<300 μm) per mouse, and the line designates the group median. Right, Each dot represents the total number of metastatic clusters per mouse. Data were analyzed using the Mann–Whitney test. C, Female NSG mice were injected as in A (n = 10/group), but cells and mice had been pretreated with doxycycline for 2 days before cell injection. Left, Graph shows Log-transformed FC ± SEM over time for EV versus shIL13RA2 injected mice. Normally distributed Log-transformed FC values were analyzed using Repeated Measures Mixed effects. *, P = 0.045; **, P = 0.0052 at the indicated time points. Right, Representative image of brain metastatic burden in mice injected with shEV and shIL13RA2 in this experiment. D, Histologic quantification of BMs for mice in C surviving at day 19 (n = 7 for EV, N = 10 for shIL13RA2). E, Representative images of BM in EV versus shIL13RA2 from A to B. Blue arrows denote BMs with a “less invasive” growth pattern, black arrows BMs with invasive fronts. F, Mice from A were injected with BrdUrd 2 hours before euthanasia, and BrdUrd incorporation in BMs was quantified by IF. Top, Representative image of BrdUrd staining in macro- and micromets from EV versus shIL13RA2 mice. Bottom, Percentage of BrdUrd+ cells quantified in individual metastases from four mice with histologically detectable BMs per group. G, Double-IF staining of p-FAK (red) and ephrin B1 (green) in BMs from EV versus shIL13RA2 mice. Blue is DAPI.

Similar articles

Cited by

References

    1. Lee SS, Ahn J-H, Kim MK, Sym SJ, Gong G, Ahn SD, et al. Brain metastases in breast cancer: prognostic factors and management. Breast Cancer Res Treat 2008;111:523–30. - PubMed
    1. Palmieri D, Smith QR, Lockman PR, Bronder J, Gril B, Chambers AF, et al. Brain metastases of breast cancer. Breast Dis 2006;26:139–47. - PubMed
    1. Morris PG, Murphy CG, Mallam D, Accordino M, Patil S, Howard J, et al. Limited overall survival in patients with brain metastases from triple-negative breast cancer. Breast J 2012;18:345–50. - PubMed
    1. Barderas R, Bartolomé RA, Fernandez-Aceñero MJ, Torres S, Casal JI. High expression of IL-13 receptor α2 in colorectal cancer is associated with invasion, liver metastasis, and poor prognosis. Cancer Res 2012;72:2780–90. - PubMed
    1. Bos PD, Zhang XH-F, Nadal C, Shu W, Gomis RR, Nguyen DX, et al. Genes that mediate breast cancer metastasis to the brain. Nature 2009;459:1005–9. - PMC - PubMed

Publication types

MeSH terms

Substances