. 2021 Nov 3;41(44):9257-9273.
doi: 10.1523/JNEUROSCI.0718-21.2021. Epub 2021 Sep 20.

Somatostatin-Positive Interneurons Contribute to Seizures in SCN8A Epileptic Encephalopathy

Affiliations

Somatostatin-Positive Interneurons Contribute to Seizures in SCN8A Epileptic Encephalopathy

Eric R Wengert et al. J Neurosci. .

Abstract

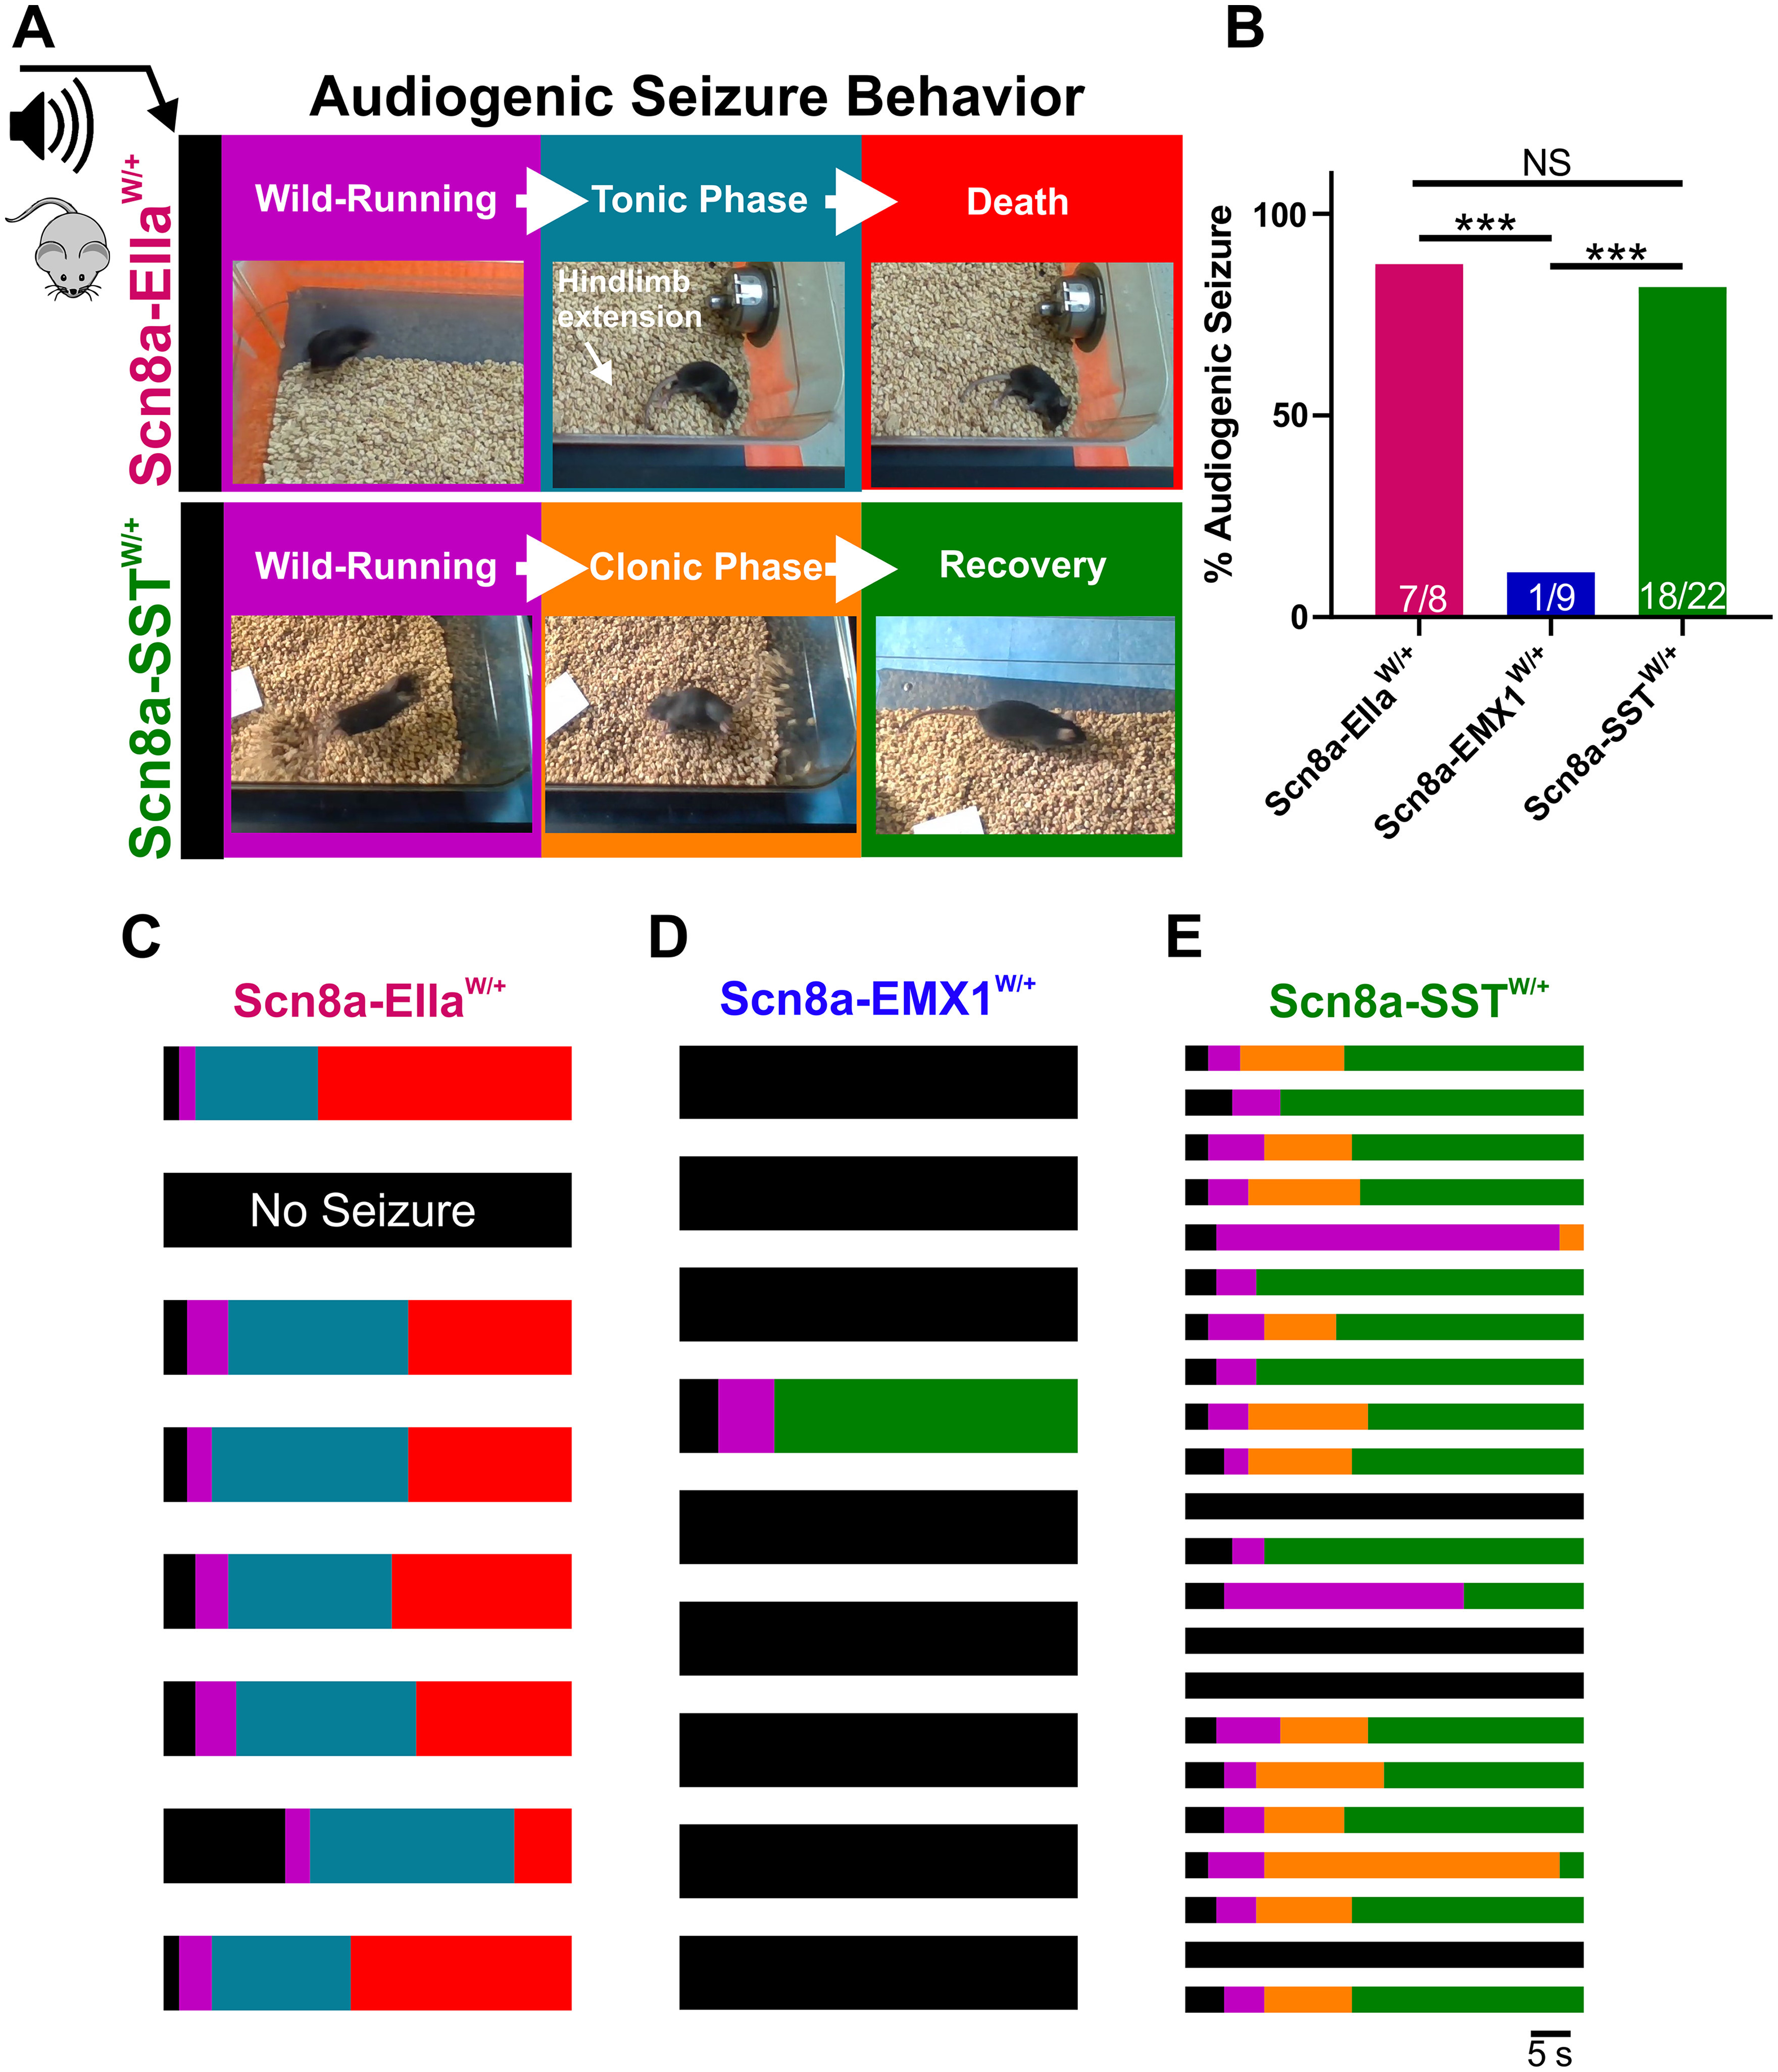
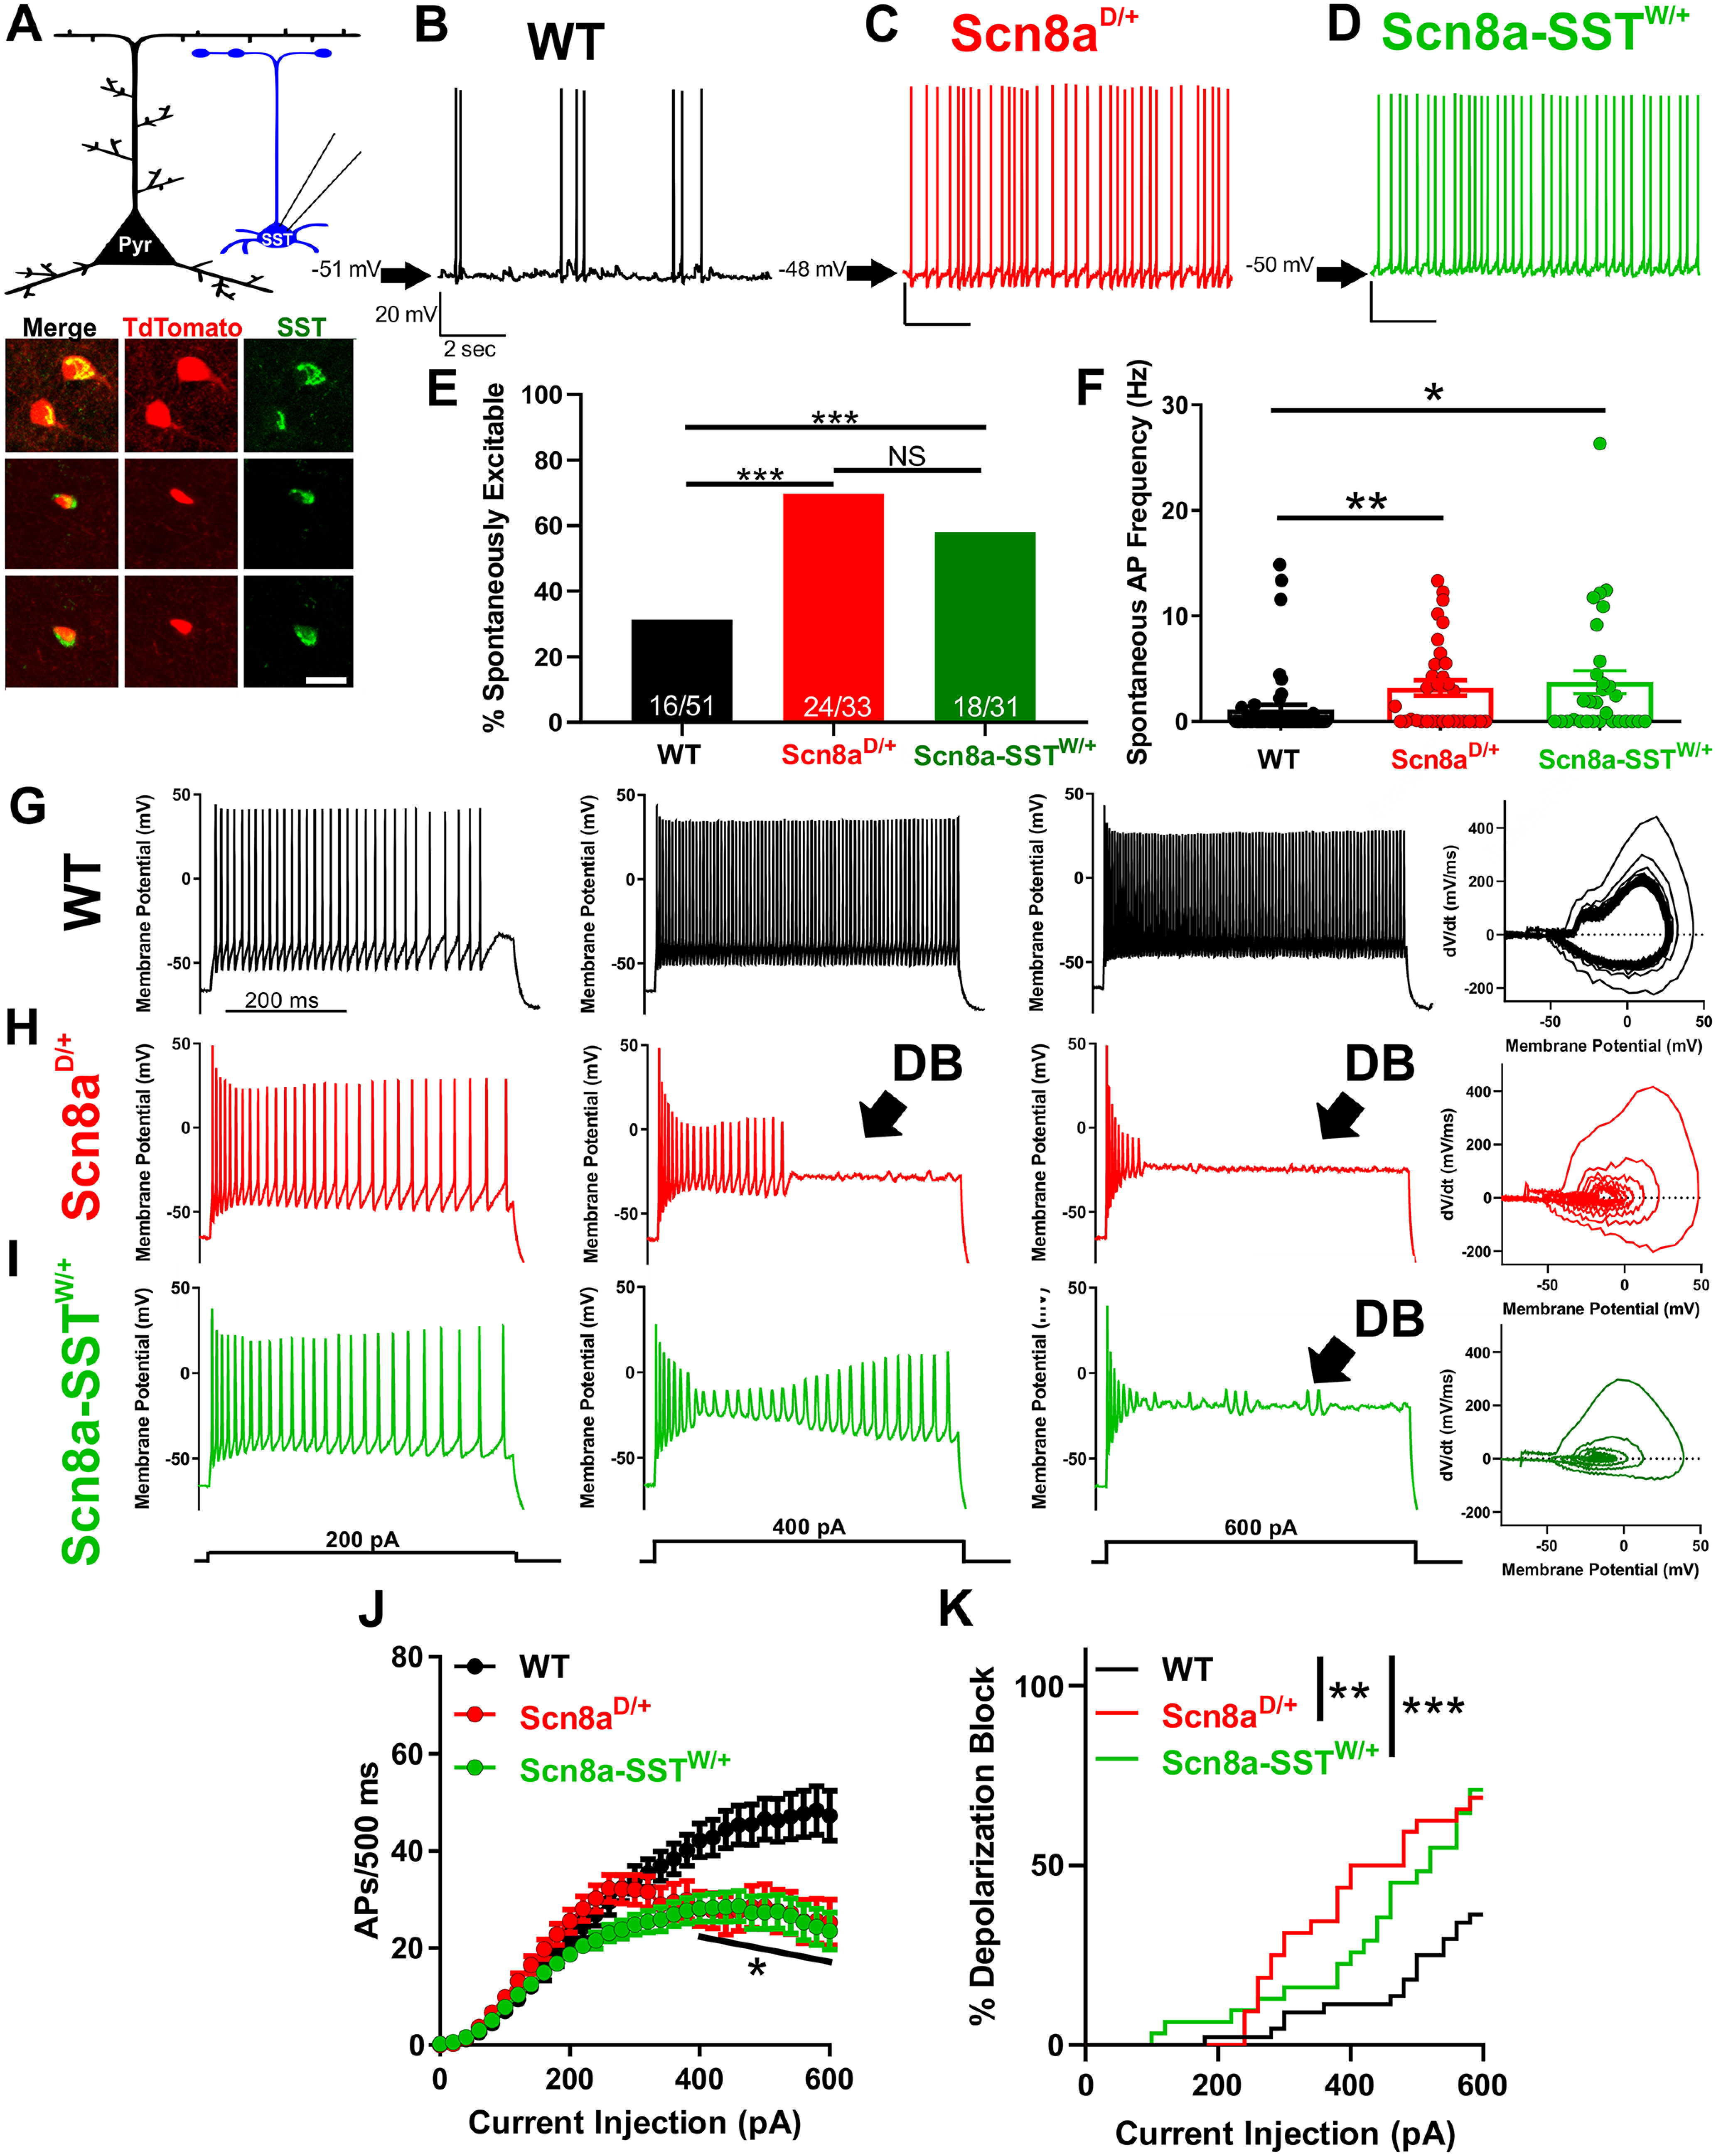
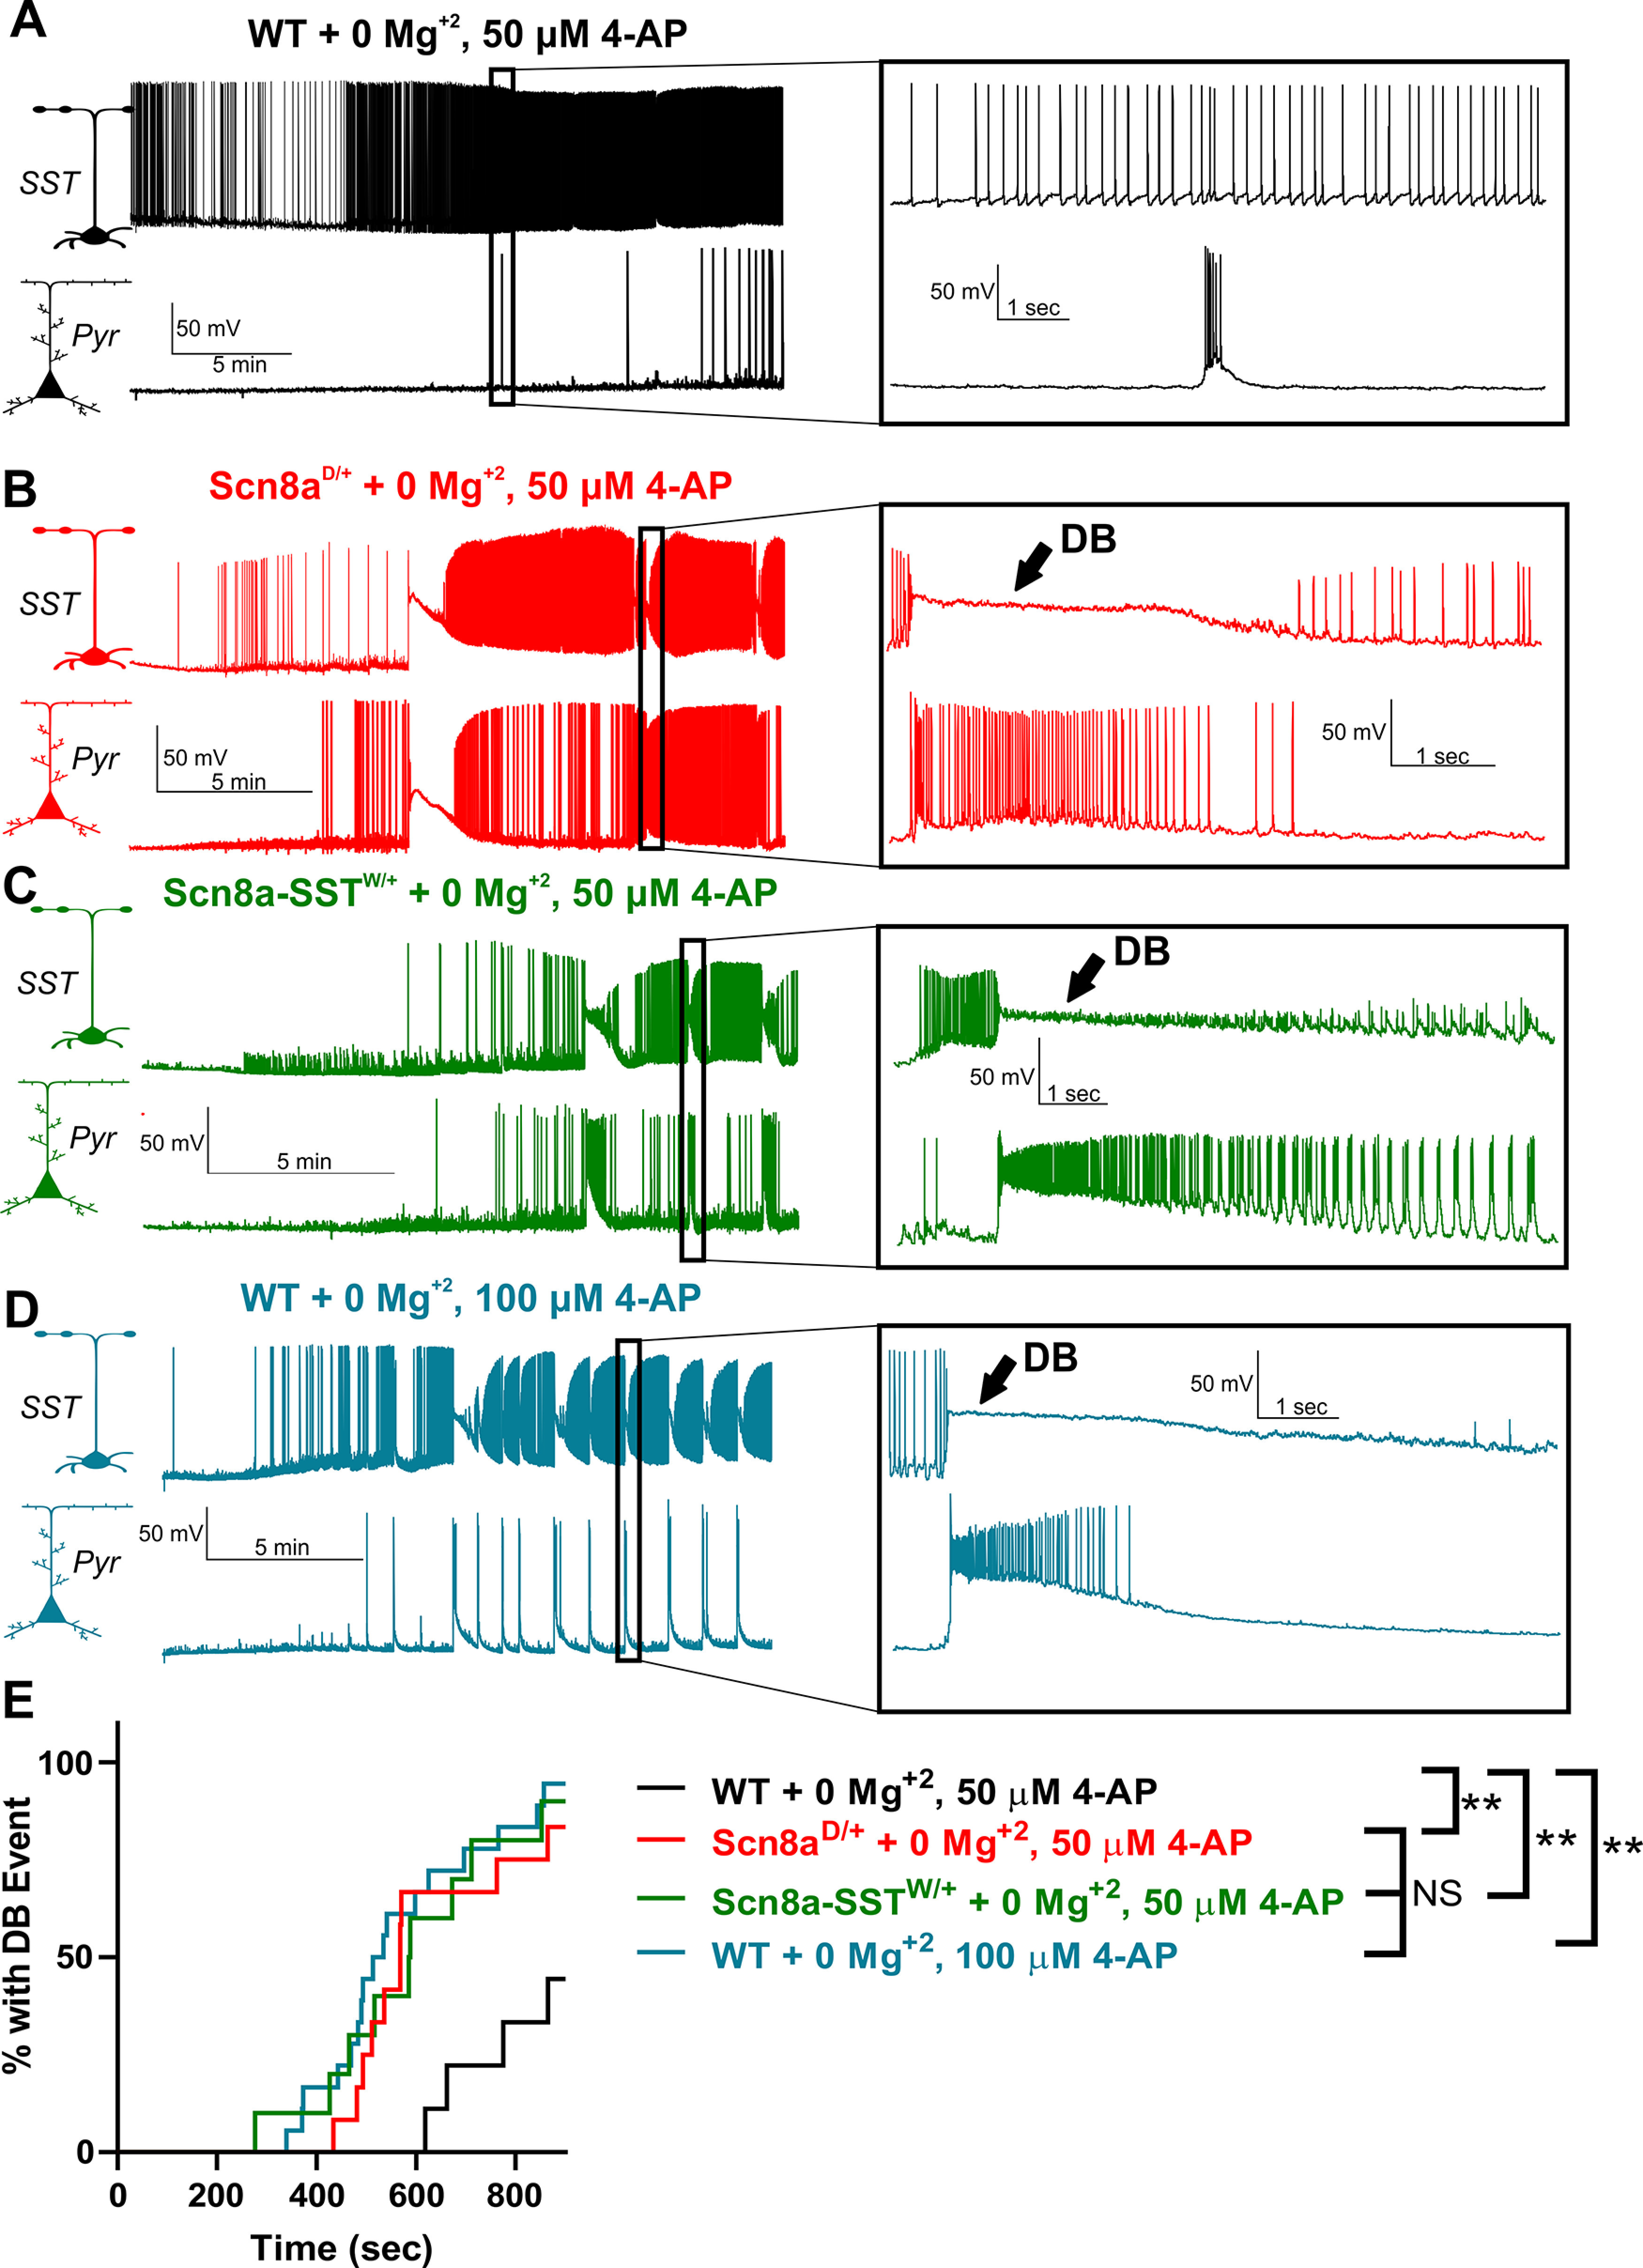
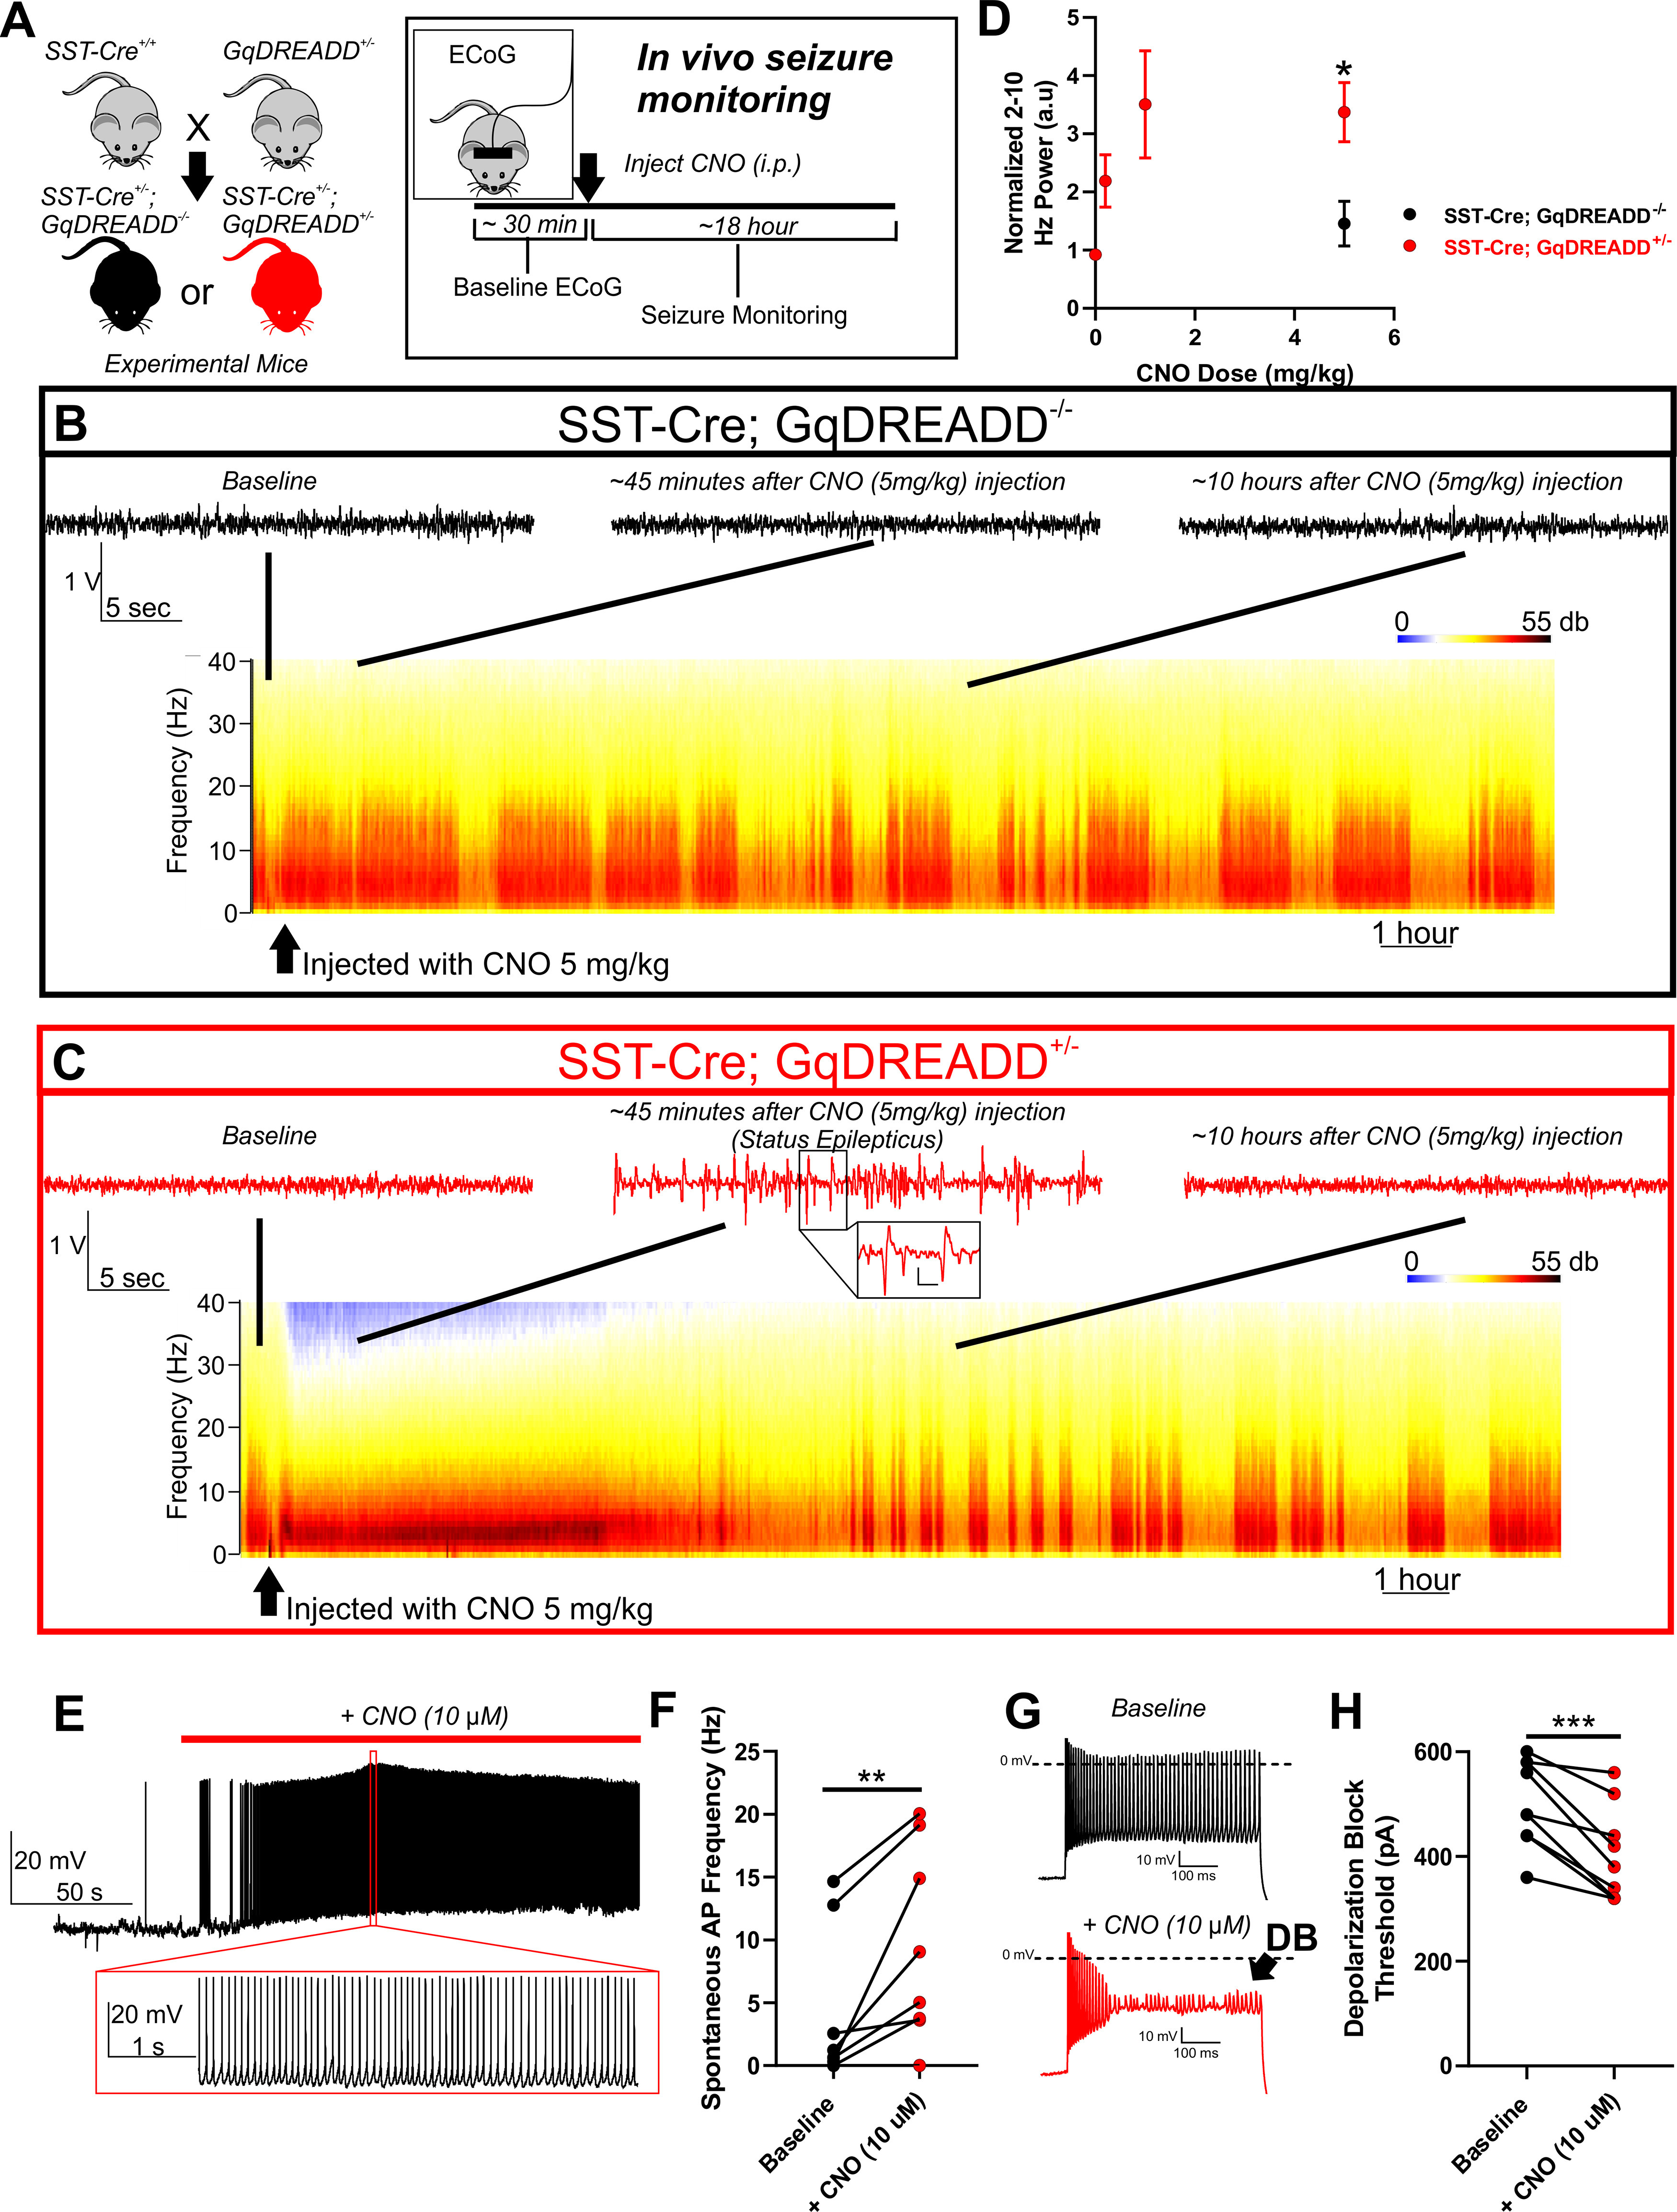
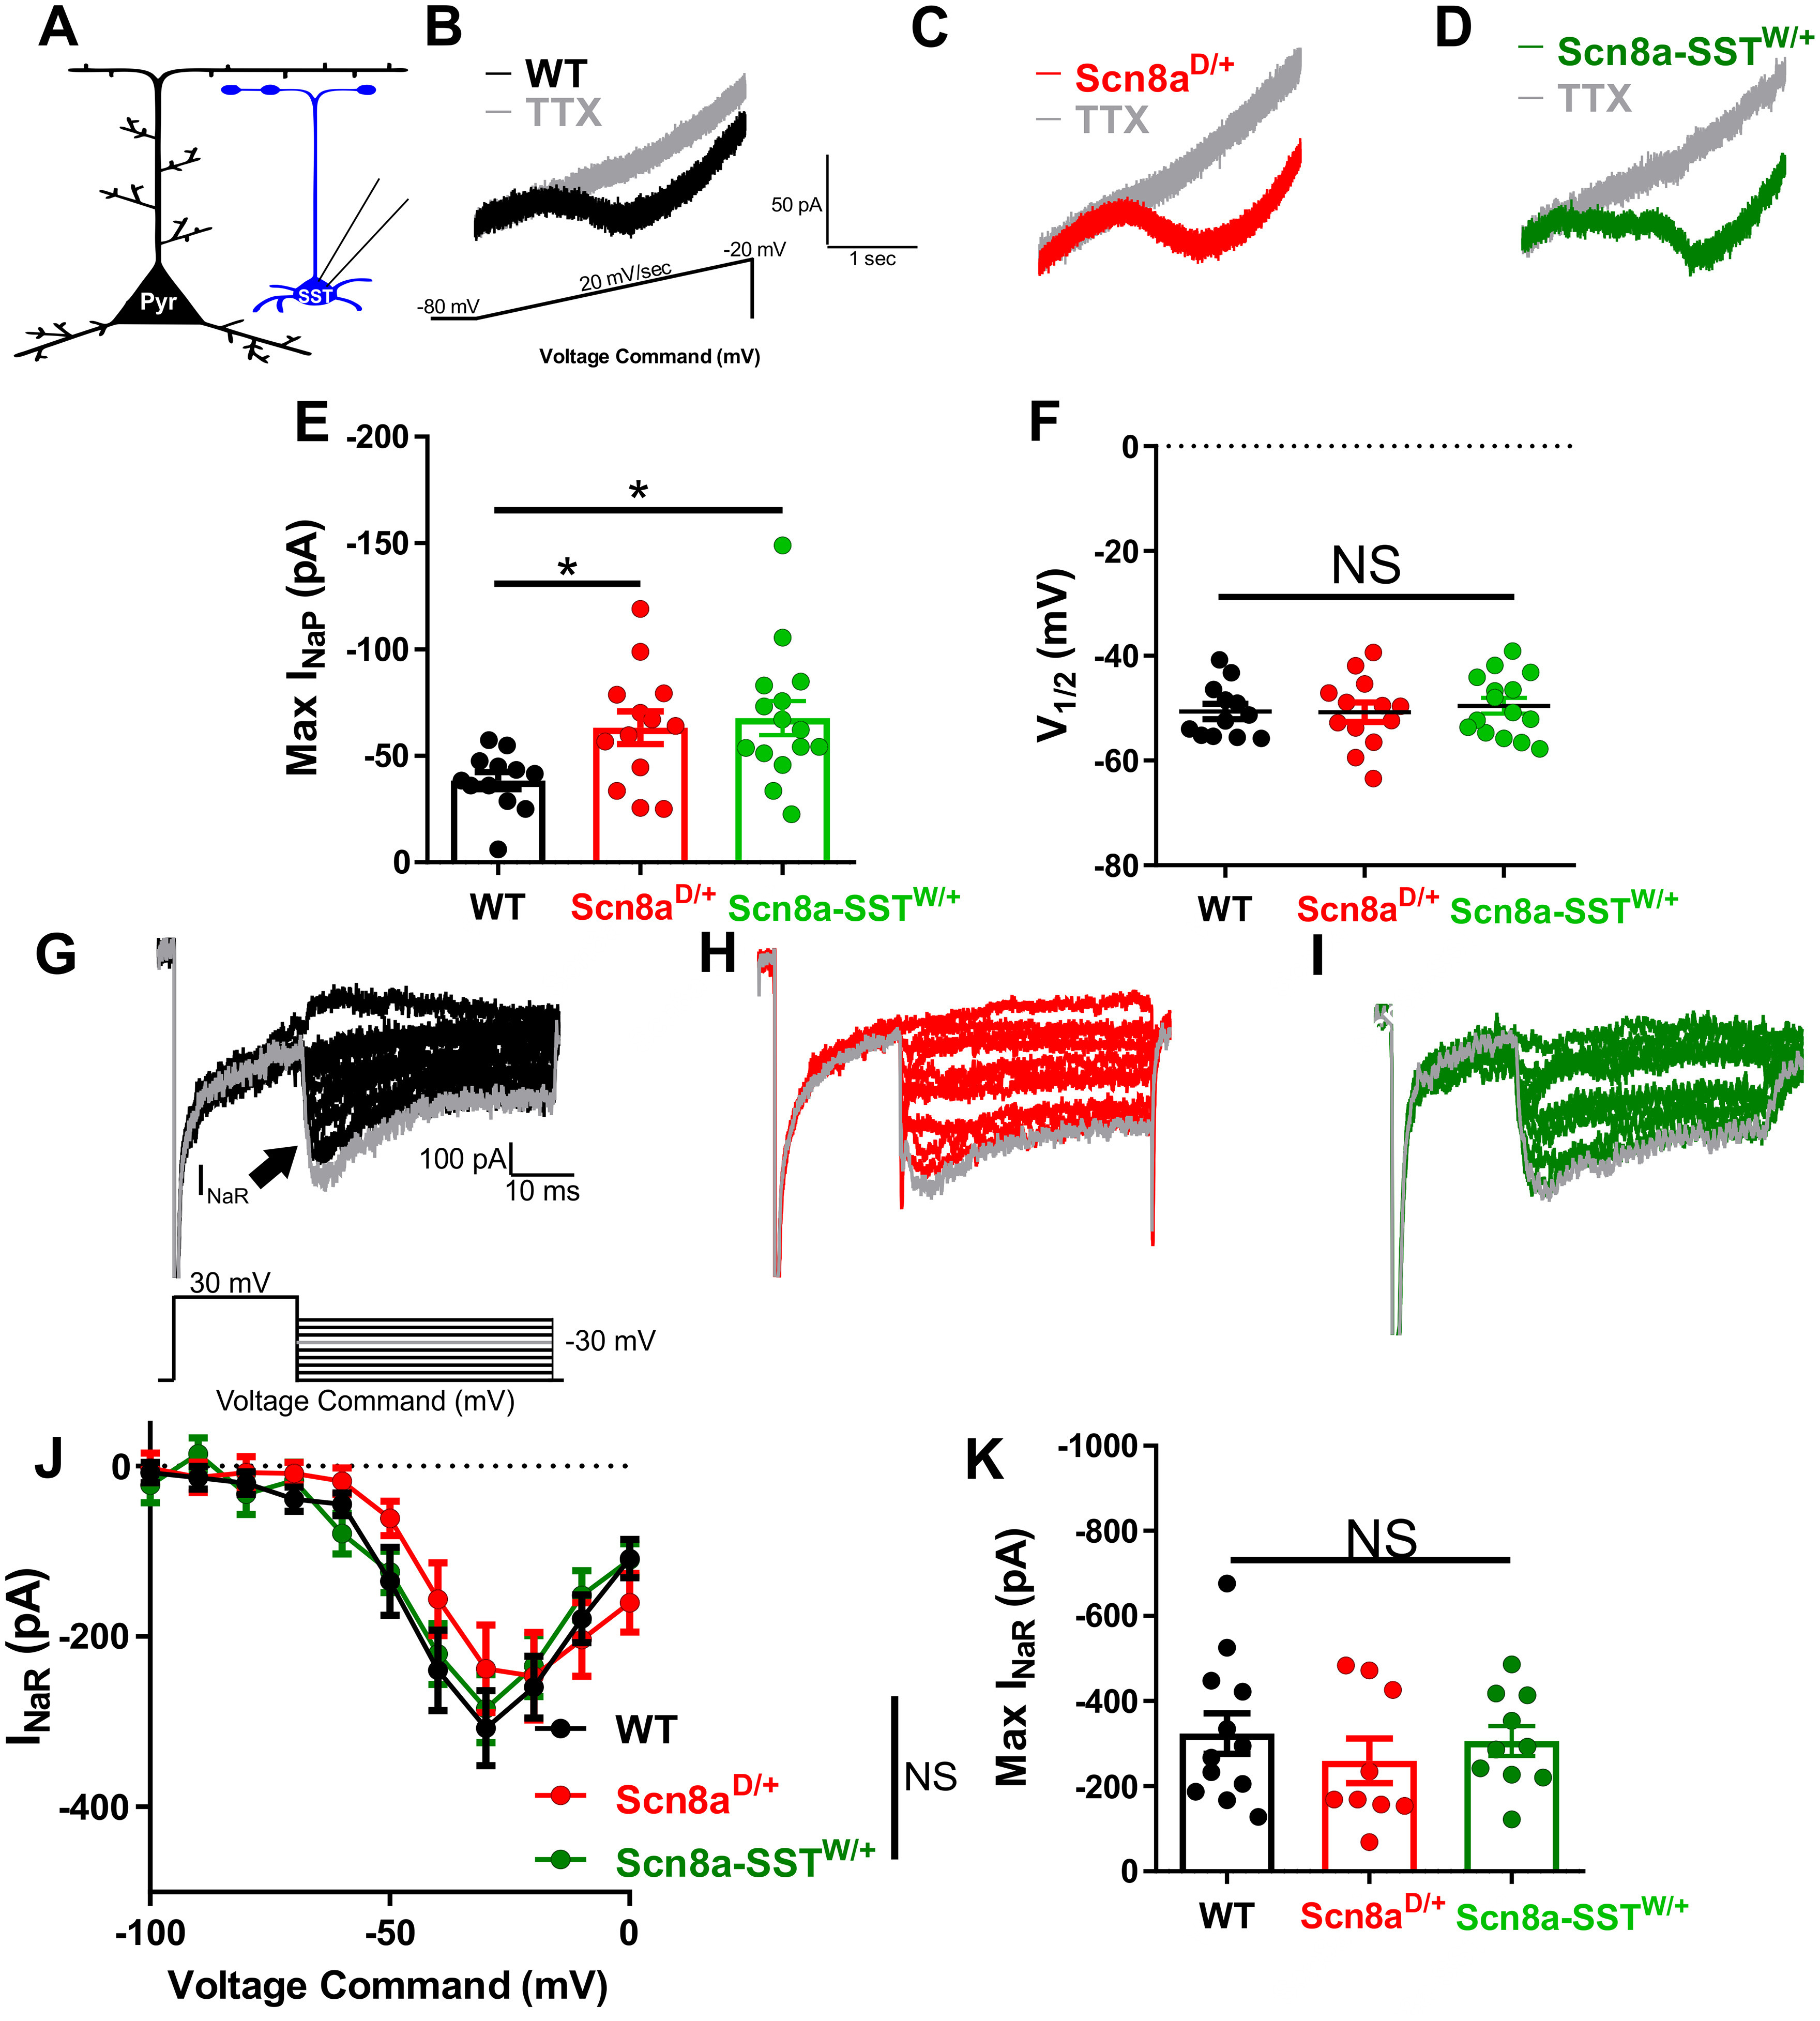
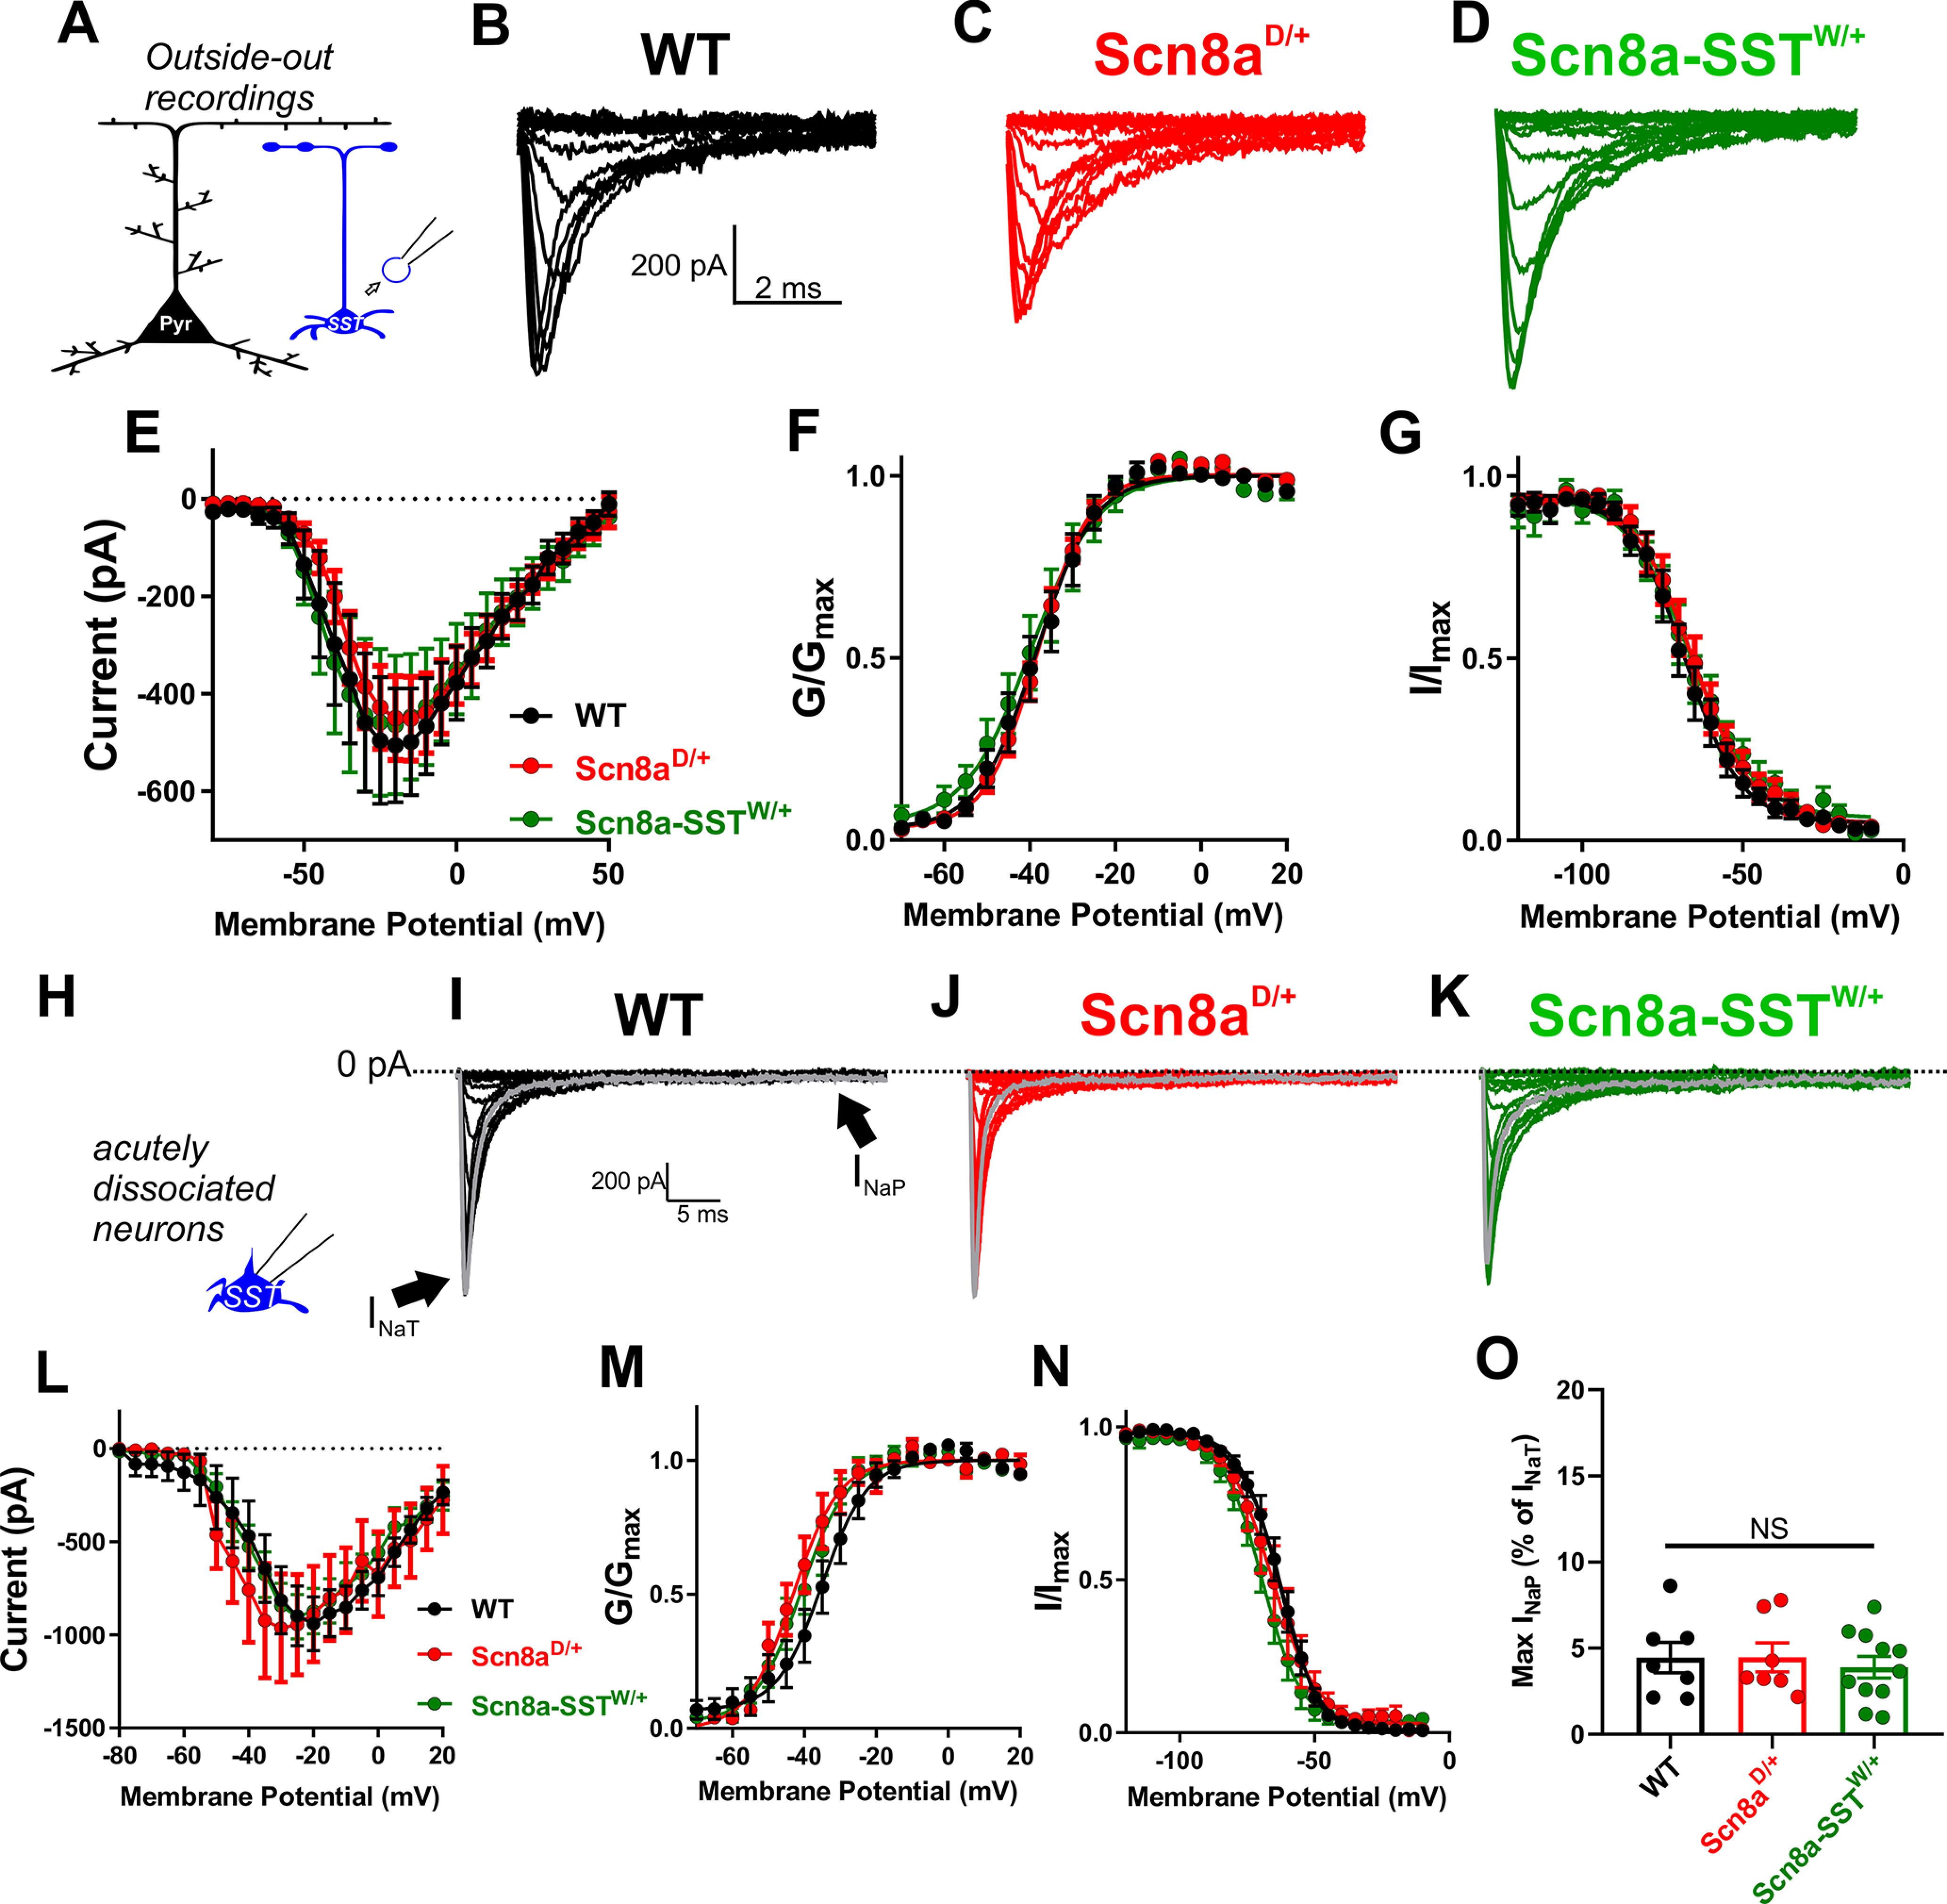
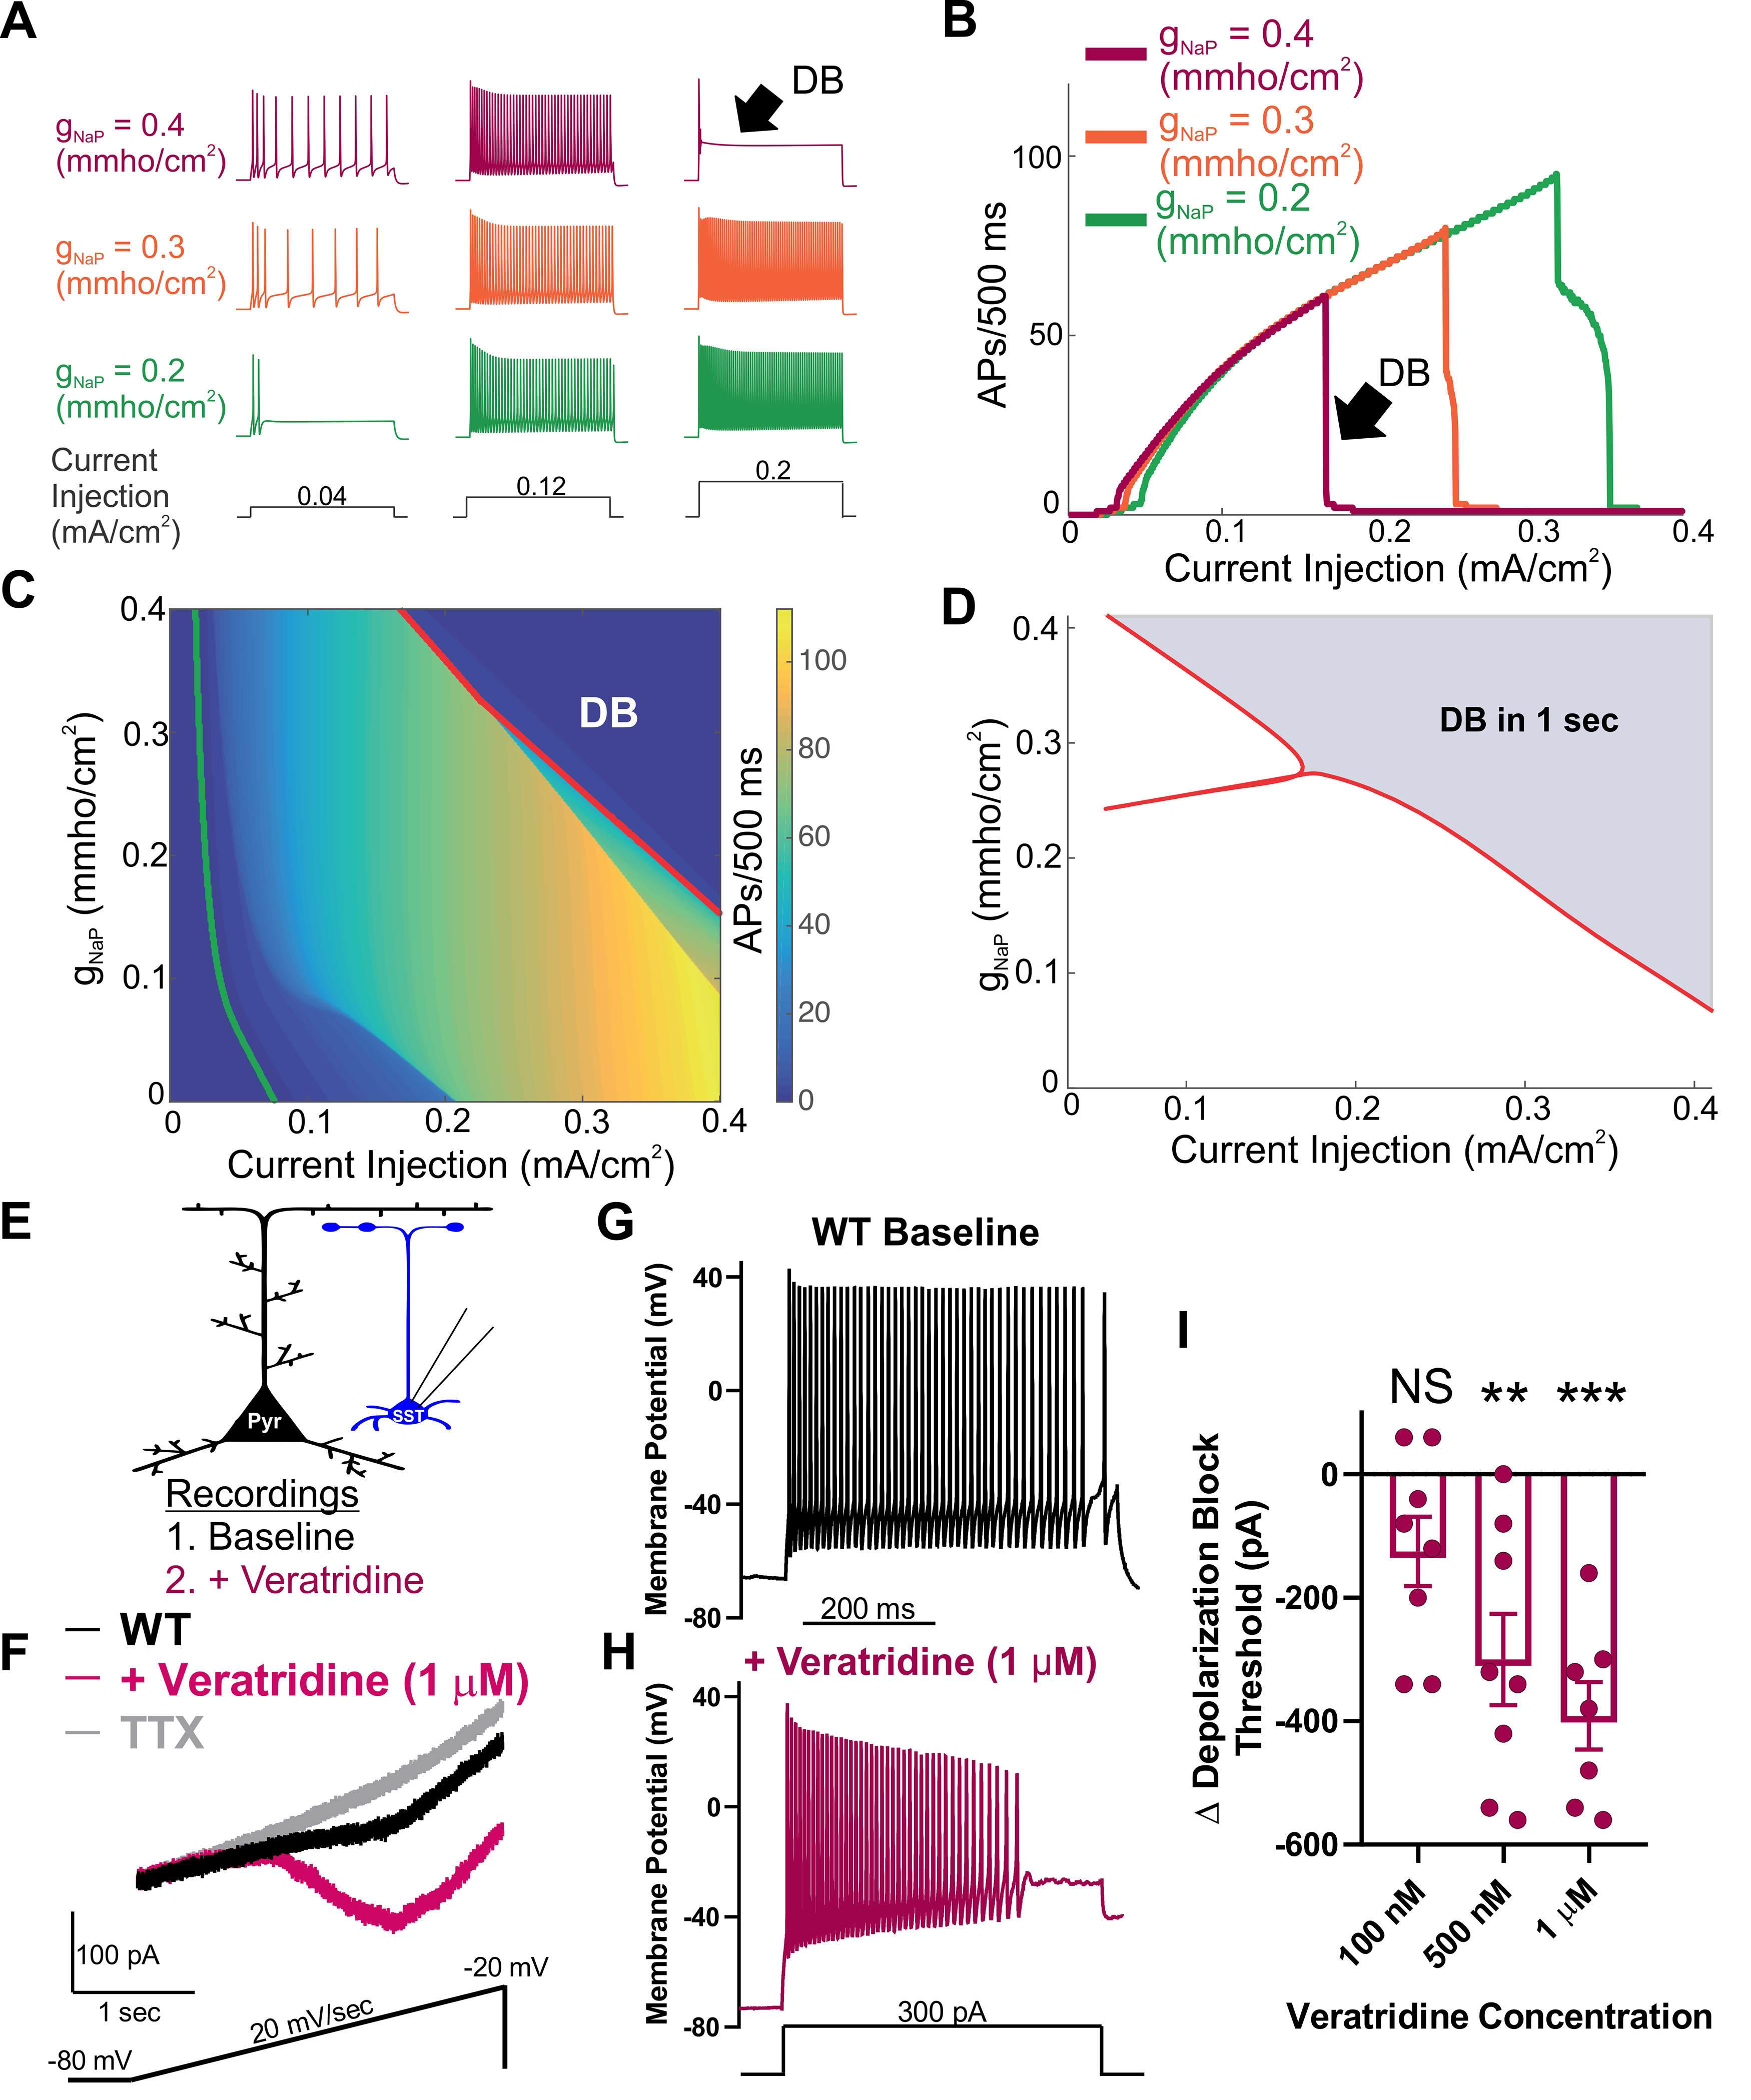
SCN8A epileptic encephalopathy is a devastating epilepsy syndrome caused by mutant SCN8A, which encodes the voltage-gated sodium channel NaV1.6. To date, it is unclear if and how inhibitory interneurons, which express NaV1.6, influence disease pathology. Using both sexes of a transgenic mouse model of SCN8A epileptic encephalopathy, we found that selective expression of the R1872W SCN8A mutation in somatostatin (SST) interneurons was sufficient to convey susceptibility to audiogenic seizures. Patch-clamp electrophysiology experiments revealed that SST interneurons from mutant mice were hyperexcitable but hypersensitive to action potential failure via depolarization block under normal and seizure-like conditions. Remarkably, GqDREADD-mediated activation of WT SST interneurons resulted in prolonged electrographic seizures and was accompanied by SST hyperexcitability and depolarization block. Aberrantly large persistent sodium currents, a hallmark of SCN8A mutations, were observed and were found to contribute directly to aberrant SST physiology in computational modeling and pharmacological experiments. These novel findings demonstrate a critical and previously unidentified contribution of SST interneurons to seizure generation not only in SCN8A epileptic encephalopathy, but epilepsy in general.SIGNIFICANCE STATEMENTSCN8A epileptic encephalopathy is a devastating neurological disorder that results from de novo mutations in the sodium channel isoform Nav1.6. Inhibitory neurons express NaV1.6, yet their contribution to seizure generation in SCN8A epileptic encephalopathy has not been determined. We show that mice expressing a human-derived SCN8A variant (R1872W) selectively in somatostatin (SST) interneurons have audiogenic seizures. Physiological recordings from SST interneurons show that SCN8A mutations lead to an elevated persistent sodium current which drives initial hyperexcitability, followed by premature action potential failure because of depolarization block. Furthermore, chemogenetic activation of WT SST interneurons leads to audiogenic seizure activity. These findings provide new insight into the importance of SST inhibitory interneurons in seizure initiation, not only in SCN8A epileptic encephalopathy, but for epilepsy broadly.

Keywords: depolarization block; epilepsy; interneuron; ion channel; seizure; voltage-gated sodium channel.


Figures

Figure 1.
Figure 1.
SST interneuron-specific expression of mutant Scn8a is sufficient for susceptibility to audiogenic seizures. A, Audiogenic seizure behavior in mice with cell type-specific expression of R1872W Scn8a mutation. Upon high-intensity acoustic stimulation, Scn8a-EIIaW/+ mice exhibit wild-running (purple) followed by a tonic phase characterized by hindlimb extension (blue), which is followed by collapse of breathing and death (red). Scn8a-SSTW/+ mice exhibit wild-running (purple) but progress to a convulsive clonic phase characterized by repetitive shaking and limb-jerking (orange) followed by recovery (green). B, Propensity of audiogenic seizures in Scn8a-EIIaW/+ (magenta: ∼87%), Scn8a-EMX1W/+ (∼11%), and Scn8a-SSTW/+ (green: ∼82%) mice. *p < 0.01, ***p < 0.001, Fisher's exact test. C-E, Color-coded raster plots for seizure behavior of individual Scn8a-EIIaW/+ (C), Scn8a-EMX1W/+ (D), and Scn8a-SSTW/+ (E) mice.
Figure 2.
Figure 2.
Scn8aD/+ and Scn8a-SSTW/+ SST interneurons are hyperexcitable and readily enter depolarization block. A, Whole-cell recordings collected from WT, Scn8aD/+, and Scn8a-SSTW/+ somatosensory layer V SST interneurons (blue). Example immunohistochemistry images showing colocalization of TdTomato (red) and SST (green) immunofluorescence. Scale bar, 20 μm. B-D, Representative example traces of spontaneous excitability of WT (B; black), Scn8aD/+ (C; red) and Scn8a-SSTW/+ (D; green) SST interneurons. Arrows indicate membrane potential between spontaneous APs. E, Only 16 of 51 (∼31%) WT SST interneurons were spontaneously excitable, whereas 24 of 33 (∼73%) Scn8aD/+ and 18 of 31 (∼58%) Scn8a-SSTW/+ spontaneously fired APs (***p < 0.01 by Fisher's exact test). F, Average spontaneous firing frequencies for WT (black), Scn8aD/+ (red), and Scn8a-SSTW/+ (green) SST interneurons. *p < 0.05, **p < 0.01, Kruskal–Wallis test followed by Dunn's multiple comparisons. G-I, Representative traces for WT (G; black), Scn8aD/+ (H; red), and Scn8a-SSTW/+ (I; green) SST interneurons eliciting APs in response to 500 ms current injections of 200, 400, and 600 pA. Depolarization block is indicated (arrow; DB) in the Scn8aD/+ (H; red) and Scn8a-SSTW/+ (I; green) interneurons. Right, Phase plot corresponding to the 600 pA current traces for WT (G; black), Scn8aD/+ red (H; red), and Scn8a-SSTW/+ (I; green). J, Average number of APs elicited relative to current injection magnitude for WT (black; n = 51, 10 mice), Scn8aD/+ (red; n = 33, 6 mice), and Scn8a-SSTW/+ (green; n = 31, 4 mice). At current injections >400 pA, both Scn8aD/+ and Scn8a-SSTW/+ AP frequencies were reduced relative to WT. *p < 0.05, two-way ANOVA followed by Tukey's correction for multiple comparisons. K, Cumulative distribution of SST interneuron entry into depolarization block relative to current injection magnitude for WT (black), Scn8aD/+ (red), and Scn8a-SSTW/+ (green) mice. Curve comparison by log-rank Mantel-Cox test (**p < 0.01).
Figure 3.
Figure 3.
Hypersensitivity of mutant SST interneurons to depolarization block during seizure-like activity. A-D, Representative example traces of WT (A; black), Scn8aD/+ (B; red), and Scn8a-SSTW/+ (C; green) SST-pyramidal neuron pairs exposed to bath solution containing 0 Mg2+, 50 μm 4-AP (A-C) and WT SST-pyramidal neuron pairs exposed to 0 Mg2+, 100 μm 4-AP (D; blue). Expanded views represent example synchronous SST interneuron depolarization block and pyramidal neuron ictal discharge events (B-D), which were not present in most neuronal pairs in the control group (A). E, Cumulative distribution plot of seizure-like events over time reveals that Scn8aD/+ + 0 Mg2+; 50 μm 4-AP (red), Scn8a-SSTW/+ + 0 Mg2+; 50 μm 4-AP (green), and WT + 0 Mg2+; 100 μm 4-AP (blue) were hypersensitive to depolarization block-mediated seizure-like events relative to WT + 0 Mg2+; 50 μm 4-AP neuron pairs (black; **p < 0.01; Log-rank Mantel-Cox test).
Figure 4.
Figure 4.
Chemogenetic activation of SST interneurons in WT mice is sufficient to induce seizures. A, Breeding strategy: Female mice homozygous for SST-cre (SST-cre+/+) were bred with male mice heterozygous for a floxed GqDREADD allele (GqDREADD+/−) to produce offspring that were either SST-Cre+/−; GqDREADD−/− control mice (black) or SST-Cre+/−; GqDREADD+/− experimental mice (red). For in vivo seizure monitoring, ECoG was recorded from each mouse for ∼30 min of baseline activity, then treated with vehicle or CNO (i.p. at 0.2, 1, and 5 mg/kg), and monitored for seizure activity for ∼18 h. B, C, Example relative power spectra of ECoG activity for ∼18 h with representative ECoG traces before CNO injection (baseline), ∼45 min after CNO injection, and ∼10 h after CNO injection. B, Example traces indicating that, in mice lacking the GqDREADD receptor (black), CNO treatment (5 mg/kg) did not lead to seizure behavior or changes in ECoG activity. C, Example traces reveal that, on CNO administration, GqDREADD+/− mice (red) exhibited highly synchronized ECoG activity and spike-wave discharges indicative of status epilepticus, which recovers within ∼8 h. Inset, Expanded view of example spike-wave discharges. Calibration: 0.25 V, 0.2 s. D, Normalized 2-10 Hz power relative to pre-injection baseline observed in response to vehicle and CNO (0.2, 1, and 5 mg/kg). SST-Cre; GqDREADD+/− mice (n = 5 for vehicle, 0.2, and 1 mg/kg, n = 8 for 5 mg/kg; red) experienced a robust and dose-dependent increase in 2-10 Hz power. SST-Cre; GqDREADD−/− control mice (black) did not show a significant increase in 2-10 Hz power on administration of 5 mg/kg CNO (n = 4) and was significantly less than SST-Cre; GqDREADD+/− mice. *p < 0.05 (unpaired t test). E, Representative example trace of an SST-Cre; GqDREADD+/− SST interneuron showing spontaneous increase in excitability in response to bath application of CNO (10 μm; red bar). Expanded view illustrates the high firing frequency during CNO exposure. F, Spontaneous firing frequencies of SST interneurons from SST-Cre; GqDREADD+/− mice before (black) and after (red) treatment with CNO (10 μm; n = 8, 4 mice). **p < 0.01 (paired t test). G, Example traces of SST interneuron excitability from an SST-Cre; GqDREADD+/− mouse in response to a 600 pA current injection before (black), and after (red) CNO (10 μm) bath application. Premature depolarization block (DB, arrow) is observed after CNO treatment. H, Depolarization block threshold for each SST-Cre; GqDREADD+/− SST interneuron before (black) and after (red) treatment with CNO (10 μm; n = 8, 4 mice). ***p < 0.001 (paired t test).
Figure 5.
Figure 5.
Elevated persistent sodium currents in Scn8aD/+ and Scn8a-SSTW/+ SST interneurons. A, Whole-cell recordings were collected from SST interneurons (blue) to measure whole-cell persistent sodium currents. B-D, Example traces of steady-state INaP evoked by slow voltage ramps (−80 mV to −20 mV at 20 mV/s) before (black, red, or green) and after addition of TTX (500 nm; gray) for WT (B; black), Scn8aD/+ (C; red), and Scn8a-SSTW/+ (D; green) SST interneurons. E, Elevated maximum INaP in Scn8aD/+ SST interneurons (red; n = 13, 4 mice; *p < 0.05) and Scn8a-SSTW/+ (green; n = 14, 3 mice; *p < 0.05) compared with WT SST interneurons (black; n = 12, 4 mice; one-way ANOVA followed by Dunnett's multiple comparisons test). F, Half-maximal voltage of activation between WT, Scn8aD/+, and Scn8a-SSTW/+ SST interneurons was not significantly different between groups (NS; p > 0.05; one-way ANOVA followed by Dunnett's multiple comparisons test). G-I, Example traces of TTX-subtracted INaR for WT (G, black), Scn8aD/+ (H, red), and Scn8a-SSTW/+ (I, green), evoked by voltage commands in which the cell was stepped to membrane potentials of −100 to 0 mV, increments of 10 mV for 40 ms after first being stepped to 30 mV for 20 ms. The INaR (arrow) is observed for steps to −50 mV through 0 mV. J, No differences were observed in the INaR current–voltage relationship between WT (black; n = 12, 4 mice), Scn8aD/+ (red; n = 9, 3 mice), and Scn8a-SSTW/+ (green; n = 10, 3 mice). K, Maximum INaR magnitudes were not different between groups.
Figure 6.
Figure 6.
Somatic voltage-gated sodium currents in WT, Scn8aD/+ and Scn8a-SSTW/+ SST interneurons. A, Somatic transient sodium current was assessed in SST interneurons (blue) using patch-clamp recordings in the outside-out configuration. B-D, Example traces for family of voltage-dependent sodium currents recorded from outside-out excised patches from WT (B; black), Scn8aD/+ (C; red), and Scn8a-SSTW/+ (D; green) SST interneurons. E, Current–voltage relationship for WT (black; n = 9, 4 mice), Scn8aD/+ (red; n = 13, 5 mice), and Scn8a-SSTW/+ (green; n = 8, 3 mice) SST interneurons. F, G, Voltage-dependent conductance and steady-state inactivation curves for WT (black), Scn8aD/+ (red), and Scn8a-SSTW/+ (green) SST interneurons. H, Voltage-gated sodium channel currents were also examined in acutely dissociated neurons, which remove much of the distal neuronal processes. I-K, Example traces for family of voltage-dependent sodium currents recorded from acutely dissociated SST interneurons from WT (I; black), Scn8aD/+ (J; red), and Scn8a-SSTW/+ (K; green) mice. Arrows indicate the fast transient (INaT) and persistent (INaP) sodium currents. L, Current–voltage relationship for WT (black; n= 7, 3 mice), Scn8aD/+ (red; n = 7, 3 mice), and Scn8a-SSTW/+ (green; n = 11, 3). M, N, Boltzmann curves for voltage-dependent activation (M) and steady-state inactivation (N). O, Maximum magnitude of the INaP elicited by voltage steps in acutely dissociated SST interneurons.
Figure 7.
Figure 7.
Augmentation of the persistent sodium current induces depolarization block. A, Example traces of APs elicited in response to 500 ms current injections in an in silico neuronal model. The maximal persistent sodium conductance was varied from gNaP = 0.2 mmho/cm2 (green), through gNaP = 0.3 mmho/cm2 (orange) to gNaP = 0.4 mmho/cm2 (magenta), while the magnitude of the current injection was increased from 0.04 mA/cm2 (left), through 0.12 mA/cm2 (middle) to 0.2 mA/cm2 (right). Increasing gNaP increased the number of APs observed over the stimulation period at low current magnitudes, and led to failure of AP initiation at higher current injection magnitudes (black arrow, DB). B, Number of APs observed over the 500 ms stimulus relative to the current magnitude. As gNaP increases, the current magnitude required to induce depolarization block (black arrow, DB) decreases. C, Heat map showing the number of APs as both gNaP and the current injection magnitude are varied. Also shown is the rheobase current required to induce at least one AP (green line) and the curve at which the neuron ceases to generate repetitive APs as it enters depolarization block (red line, DB). D, Two parameter bifurcation showing the location of dynamic transitions leading to depolarization block as the gNaP and the current magnitude are varied. Red line indicates the shaded region of parameter space in which depolarization block occurs (over a 1s current pulse) from the unshaded region in which it does not. E, Experimental design: Whole-cell recordings were made from an SST interneuron (blue) before (baseline) and after bath application of the INaP current activator, veratridine (magenta). F, Example trace of INaP current before (black), after application of veratridine (1 μm; magenta) followed by application of TTX (500nM: gray). G, H, Example traces of a WT SST interneuron before (G; black) and after (H; magenta) bath application of INaP current-activator veratridine (1 μm). I, Shift in depolarization block threshold in response to bath-applied veratridine at 100 nm (n = 8, 3 mice), 500 nm (n = 8, 3 mice), and 1 μm (n = 7, 3 mice). **p < 0.01, ***p < 0.001, comparing before and after treatment with veratridine (paired t test).

References

    1. Alkadhi KA, Tian LM (1996) Veratridine-enhanced persistent sodium current induces bursting in CA1 pyramidal neurons. Neuroscience 71:625–632. 10.1016/0306-4522(95)00488-2 - DOI - PubMed
    1. Baker EM, Thompson CH, Hawkins NA, Wagnon JL, Wengert ER, Patel MK, George AL, Meisler MH, Kearney JA (2018) The novel sodium channel modulator GS-458967 (GS967) is an effective treatment in a mouse model of SCN8A encephalopathy. Epilepsia 59:1166–1176. 10.1111/epi.14196 - DOI - PMC - PubMed
    1. Barker BS, Nigam A, Ottolini M, Gaykema RP, Hargus NJ, Patel MK (2017) Pro-excitatory alterations in sodium channel activity facilitate subiculum neuron hyperexcitability in temporal lobe epilepsy. Neurobiol Dis 108:183–194. 10.1016/j.nbd.2017.08.018 - DOI - PMC - PubMed
    1. Berecki G, Bryson A, Terhag J, Maljevic S, Gazina EV, Hill SL, Petrou S (2019) SCN1A gain of function in early infantile encephalopathy. Ann Neurol 85:514–525. 10.1002/ana.25438 - DOI - PubMed
    1. Bernard C, Cossart R, Hirsch JC, Esclapez M, Ben-Ari Y (2000) What is GABAergic inhibition? How is it modified in epilepsy? Epilepsia 41 Suppl 6:S90–S95. 10.1111/j.1528-1157.2000.tb01564.x - DOI - PubMed

Publication types