. 2021 Sep 20;12(1):5531.
doi: 10.1038/s41467-021-25709-x.

Comprehensive molecular characterization of pediatric radiation-induced high-grade glioma

Affiliations

Comprehensive molecular characterization of pediatric radiation-induced high-grade glioma

John DeSisto et al. Nat Commun. .

Abstract

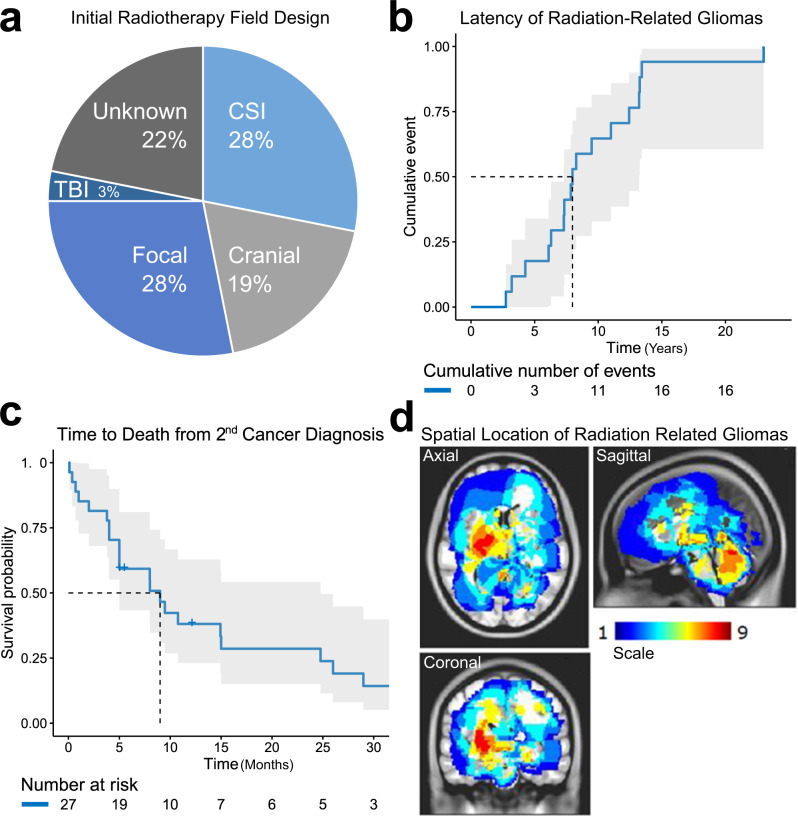
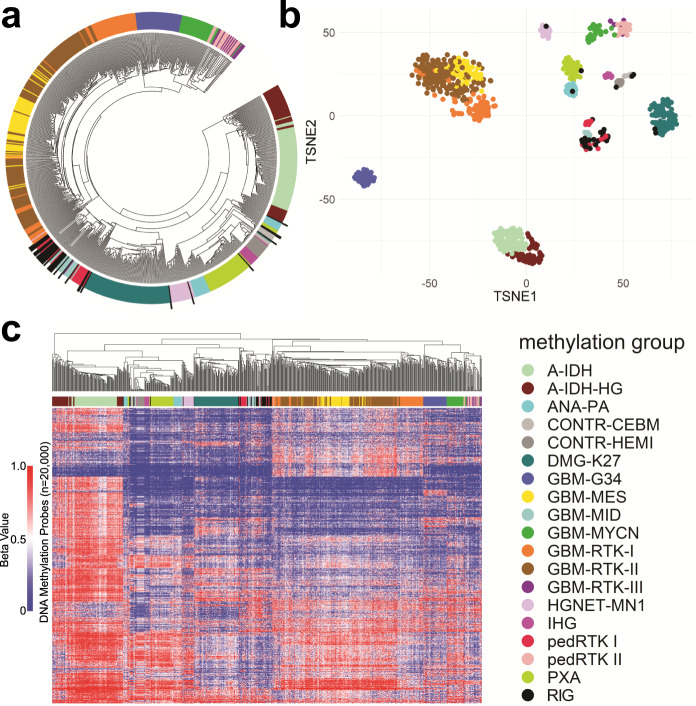
Radiation-induced high-grade gliomas (RIGs) are an incurable late complication of cranial radiation therapy. We performed DNA methylation profiling, RNA-seq, and DNA sequencing on 32 RIG tumors and an in vitro drug screen in two RIG cell lines. We report that based on DNA methylation, RIGs cluster primarily with the pediatric receptor tyrosine kinase I high-grade glioma subtype. Common copy-number alterations include Chromosome (Ch.) 1p loss/1q gain, and Ch. 13q and Ch. 14q loss; focal alterations include PDGFRA and CDK4 gain and CDKN2A and BCOR loss. Transcriptomically, RIGs comprise a stem-like subgroup with lesser mutation burden and Ch. 1p loss and a pro-inflammatory subgroup with greater mutation burden and depleted DNA repair gene expression. Chromothripsis in several RIG samples is associated with extrachromosomal circular DNA-mediated amplification of PDGFRA and CDK4. Drug screening suggests microtubule inhibitors/stabilizers, DNA-damaging agents, MEK inhibition, and, in the inflammatory subgroup, proteasome inhibitors, as potentially effective therapies.


Conflict of interest statement

The authors declare no competing interests.

Figures

Fig. 1
Fig. 1. RIG cohort characteristics.
a Radiotherapy field type used to treat the initial (pre-RIG) cancer. b Time to the diagnosis of RIG from initial cancer diagnosis. c Time to death following RIG diagnosis. Two patients survived beyond 35 months but were deceased at study closure. d Anatomic location of RIG. Color scale indicates the number of cases anatomically overlapping at each point in space. RIG radiation-induced high-grade glioma, CSI craniospinal irradiation, TBI total body irradiation. The gray region around each line in (b, c) represents the 95% confidence interval around the estimate.
Fig. 2
Fig. 2. Methylation group-based classification of RIG.
a Circular dendrogram indicating the location of RIG (black bars) relative to reference CNS tumors. b Localization of RIGs relative to other CNS cancers in t-SNE space (legend shown below). c Dendrogram and heatmap of RIG cases clustered against reference CNS tumors (legend to right). A-IDH astrocytoma, subclass IDH-mutant, A-IDH-HG high-grade astrocytoma, subclass IDH-mutant, ANA PA anaplastic pilocytic astrocytoma, CONTR-CEBM control cerebellum, CONTR-HEMI control cerebral cortex, DMG-K27 diffuse midline glioma, H3K27M-mutant, GBM-G34 glioblastoma, subclass H3.3 p.G34R-mutant, GBM-MES glioblastoma, subclass mesenchymal, GBM-MID glioblastoma, IDH-wild type, subclass midline, GBM-MYCN glioblastoma, subclass MYCN-amplified, GBM-RTK-I, adult glioblastoma, subclass RTK I, GBM-RTK-II adult glioblastoma, subclass RTK II, GBM-RTK-III adult glioblastoma, subclass RTK III, HGNET-MN1 high-grade neuroepithelial tumor with MN1 alteration, IHG infantile high-grade glioma, pedRTK I pediatric glioblastoma, subclass RTK I, pedRTK II pediatric glioblastoma, subclass RTK II, PXA pleomorphic xanthoastrocytoma, RIG radiation-induced high-grade glioma, t-SNE t-distributed stochastic neighbor embedding.
Fig. 3
Fig. 3. Frequent copy-number alterations in RIG.
a Copy-number frequency plot showing the percentage of samples with gain or loss by chromosome. Locations of specific copy-number alterations discussed in the text are labeled. b Expression-based confirmation of high-frequency copy-number alterations in PDGFRA (P = 0.016) and BCOR (P = 0.0001); mean and SEM are shown. c Frequency of copy-number gain and loss across all RIG; boxes show median and first and third quartiles, with whiskers representing the range limited to 1.5× the interquartile range from the box edge. d Frequency of chromothripsis in RIG vs. primary NBS-HGG, primary DIPG, and combined NBS-HGG and DIPG (one-sided Fisher’s exact test). RIG radiation-induced high-grade glioma, NBS-HGG nonbrainstem high-grade glioma, DIPG diffuse intrinsic pontine glioma, pHGG pediatric high-grade glioma, SEM standard error of the mean. In panel b, the P value for BCOR is computed using Student’s single-sample, two-sided t test; the P value for PDGFRA is computed using Student’s two-sample, two-sided t test.
Fig. 4
Fig. 4. Recurrent molecular alterations in RIG.
Summary by RIG sample of clinical characteristics, histopathological features, methylation profile, tier1 mutations, genes affected by copy-number gain/loss, and fusion genes. The second sample for Case 2 is shown as Case 2B, whereas the second samples for Case 14 and Case 12 are not shown but are annotated in Supplementary Data 1. ANA PA anaplastic pilocytic astrocytoma, CONTR-CEBM control cerebellum, DMG-K27 diffuse midline glioma H3.3 K27M, GBM-MID glioblastoma IDH-wild type, subclass midline, HGNET-MN1 high-grade neuroepithelial tumor with MN1 alteration, PXA pleomorphic xanthoastrocytoma, RIG radiation-induced high-grade glioma. Sequencing/array platforms for each case are also shown in the bottom row.
Fig. 5
Fig. 5. Gene expression profiling of RIG versus de novo GBM.
a Clustering of RIGs with microarray-based transcriptomic data (n = 13) versus de novo pediatric GBM (n = 24), infant GBM (n = 4), and adult GBM (n = 14) using t-SNE analysis. b Heatmap of genes whose mean expression differs between RIG Groups A and B (n = 2961, P < 0.05) (Labels A1–A6 represent subgroup A RIG tumors and B1–B7 represent subgroup B tumors). The scale represents fold change of Group A vs. Group B. c Upper panel: methylation clustering showing locations of RIGs versus PedRTK I and GBM reference clusters; Lower panel: methylation-based clustering of RIGs showing transcriptomic group A and group B locations. Despite overlap of a few samples, group A and group B clustered separately by methylation (P < 0.05); d Metascape analysis based on GO genesets shows cellular pathways and processes that differ based on gene expression between RIG and de novo GBM (from panel A); color scale represents the P value; comparisons are non-directional between sample sets. e GSEA using GO genesets identifies differences in gene expression between RIG and de novo GBM (from panel A); number scale represents the log of the FDR (with FDR = 0 set to a value of 5 for purposes of plotting); colors represent the ratio of GSEA normalized enrichment score (NES) of RIG/de novo GBM. GO gene ontology, GSEA geneset enrichment analysis, RIG radiation-induced high-grade glioma, GBM glioblastoma, FDR false discovery rate.
Fig. 6
Fig. 6. Gene expression and genetic profiling of Group A versus Group B RIG.
a GSEA results showing GO NES differences by category between Group A (blue) and Group B (red) RIG tumors; horizontal axis is NES for comparing RIG Group B vs. RIG Group A (NES > 0 means enrichment in Group B and NES < 0 means enrichment in Group A; FDR values for comparisons are listed in Supplementary Data 15); Box-plot midline shows median; hinges are at 25th and 75th percentiles; whiskers show minimum and maximum NES values for each geneset. b For RIG samples with germline and somatic genome sequencing and transcriptomic data, germline variant load was identical between subgroups, but the somatic load was approximately ninefold greater in Group B (P = 0.0037); the RIG sample with MSH2 mismatch repair defect was excluded from this analysis. c GSEA results for DNA-repair pathways for Group B versus Group A germline and tumor samples; negative numbers represent depletion in Group B versus Group A. d Differences in expression for pre-selected individual genes from the DNA-repair genesets that were judged to be most reflective of DNA-repair efficiency are shown by decreasing P value (top to bottom); colors represent the log10 ratio of fold change in Group B versus Group A. NES normalized enrichment score, RIG radiation-induced high-grade glioma, GSEA geneset enrichment analysis, FDR false discovery rate. Significance testing in panels b and d was performed using Student’s two-sample t-test; tests were two-sided. Adjustments for multiple comparisons were not performed in part d because genes were chosen a priori. NES and FDR q values were calculated within the GSEA software (see “Methods” for parameters).
Fig. 7
Fig. 7. RIG preclinical drug screen.
a In silico-predicted response of RIG vs. de novo GBM tumors to drug classes based on GSEA (NES, FDR, and number of genes in the geneset). b In vitro drug-screening results by drug class combined for RIG cell lines MAF-145 (gene expression Group B) and MAF-496 (gene expression Group A) showing percentage reduction in survival by drug class relative to the vehicle; the screen was performed using FDA-approved anticancer agents at a concentration of 1 μM for 120 h. c In vitro drug screen results in RIG cell lines using a 1 μM concentration; Group A (MAF-496) cell line response (surviving fraction vs. vehicle) is plotted on the x axis and Group B cell line (MAF-145) on the y axis. Dot colors correspond to drug class as shown in the legend. d In vitro validation results in RIG cell lines MAF-145 and MAF-496 for candidate drugs identified through the in vitro drug screen, IC50 in nM. GSEA geneset enrichment analysis, NES normalized enrichment score, RIG radiation-induced high-grade glioma, GBM glioblastoma, FDR false discovery rate, FDA Food and Drug Administration.

References

    1. Woods D, Turchi JJ. Chemotherapy induced DNA damage response: convergence of drugs and pathways. Cancer Biol. Ther. 2013;14:379–389. doi: 10.4161/cbt.23761. - DOI - PMC - PubMed
    1. Jekimovs, C. et al. Chemotherapeutic compounds targeting the DNA double-strand break repair pathways: the good, the bad, and the promising. Front. Oncol.4, 86 (2014). - PMC - PubMed
    1. De Ruysscher D, et al. Radiotherapy toxicity. Nat. Rev. Dis. Prim. 2019;5:13. doi: 10.1038/s41572-019-0064-5. - DOI - PubMed
    1. Armstrong GT, et al. Long-term outcomes among adult survivors of childhood central nervous system malignancies in the Childhood Cancer Survivor Study. J. Natl Cancer Inst. 2009;101:946–958. doi: 10.1093/jnci/djp148. - DOI - PMC - PubMed
    1. Armstrong GT, et al. Late mortality among 5-year survivors of childhood cancer: a summary from the Childhood Cancer Survivor Study. J. Clin. Oncol. 2009;27:2328–2338. doi: 10.1200/JCO.2008.21.1425. - DOI - PMC - PubMed

Publication types