. 2021 Sep 20;12(1):5544.
doi: 10.1038/s41467-021-25744-8.

Peak learning of mass spectrometry imaging data using artificial neural networks

Affiliations

Peak learning of mass spectrometry imaging data using artificial neural networks

Walid M Abdelmoula et al. Nat Commun. .

Abstract

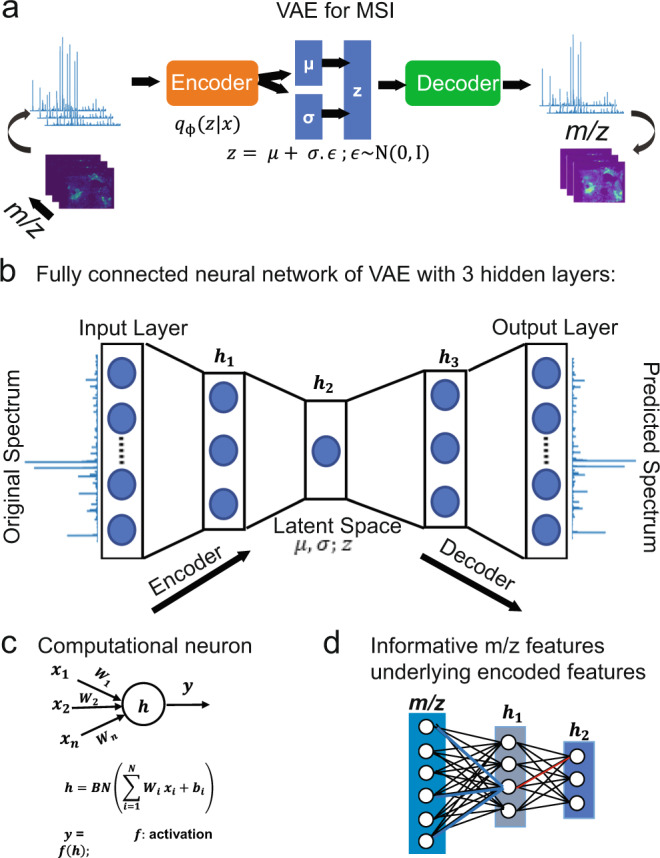
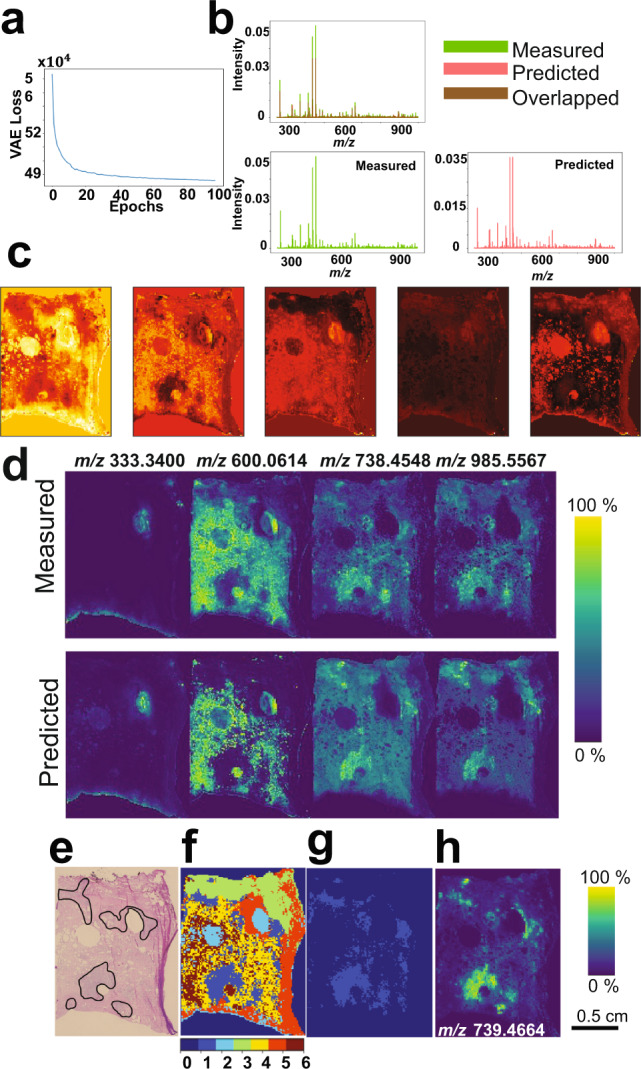
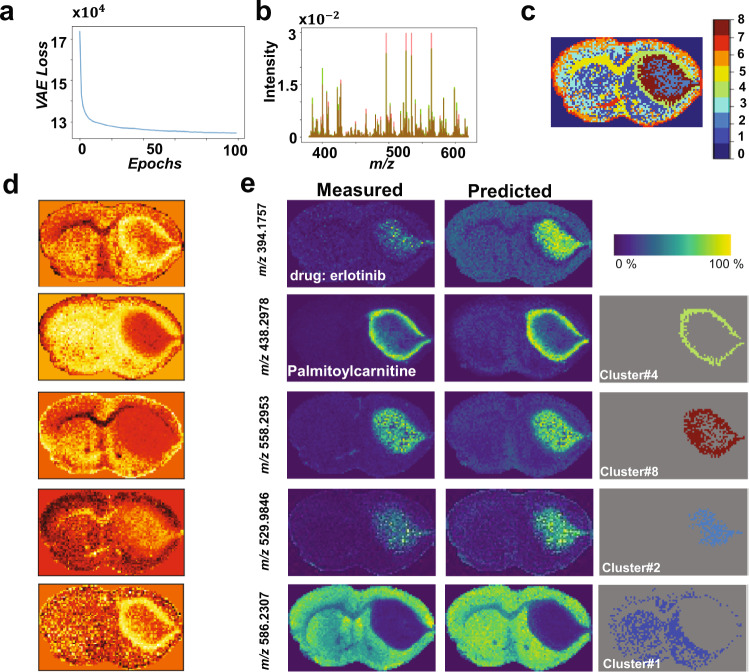
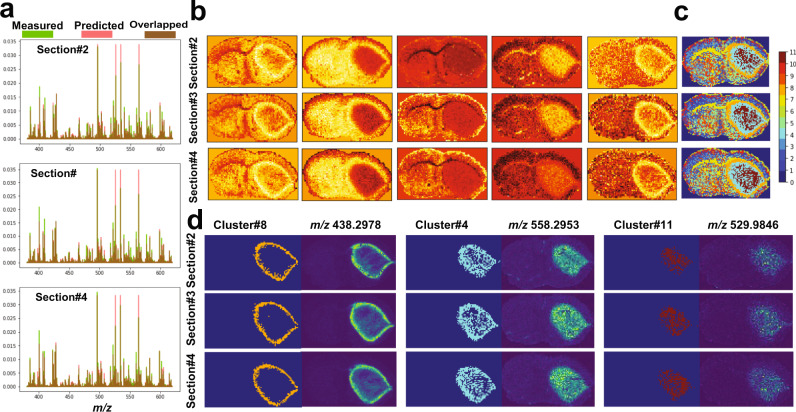
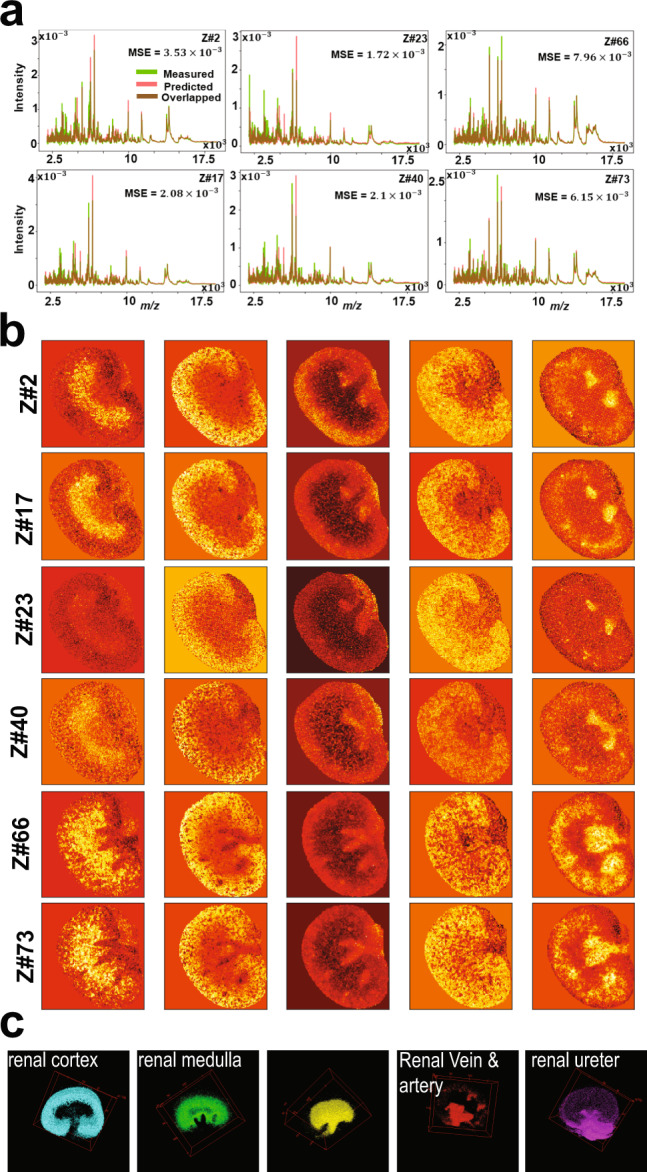
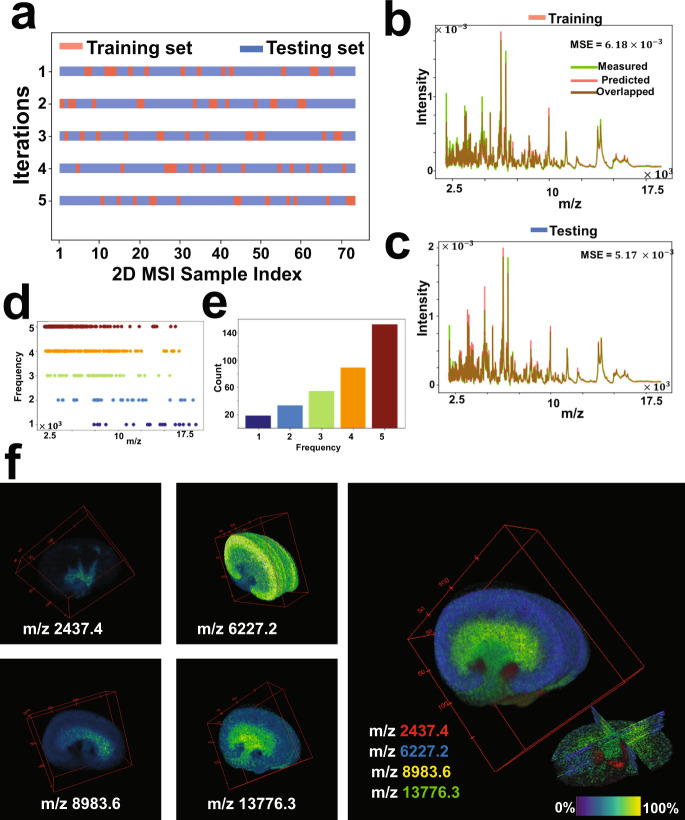
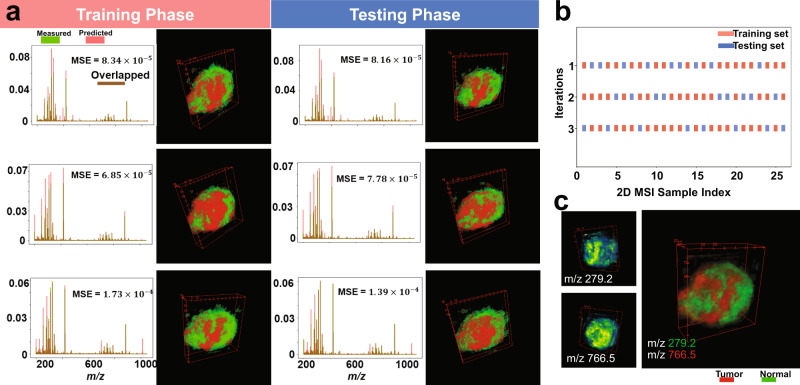
Mass spectrometry imaging (MSI) is an emerging technology that holds potential for improving, biomarker discovery, metabolomics research, pharmaceutical applications and clinical diagnosis. Despite many solutions being developed, the large data size and high dimensional nature of MSI, especially 3D datasets, still pose computational and memory complexities that hinder accurate identification of biologically relevant molecular patterns. Moreover, the subjectivity in the selection of parameters for conventional pre-processing approaches can lead to bias. Therefore, we assess if a probabilistic generative model based on a fully connected variational autoencoder can be used for unsupervised analysis and peak learning of MSI data to uncover hidden structures. The resulting msiPL method learns and visualizes the underlying non-linear spectral manifold, revealing biologically relevant clusters of tissue anatomy in a mouse kidney and tumor heterogeneity in human prostatectomy tissue, colorectal carcinoma, and glioblastoma mouse model, with identification of underlying m/z peaks. The method is applied for the analysis of MSI datasets ranging from 3.3 to 78.9 GB, without prior pre-processing and peak picking, and acquired using different mass spectrometers at different centers.


Conflict of interest statement

W.M.A. is now an employee of inviCRO. N.Y.R.A. is a scientific advisor to BayesianDx and inviCRO, and key opinion leader to Bruker Daltonics. The remaining authors declare no competing interests.

Figures

Fig. 1
Fig. 1. The proposed neural-network architecture of variational autoencoder (VAE) for mass spectrometry imaging data analysis and peak learning.
a Schematic overview of the VAE model, which was impelemnted as a fully connected neural network (b) of five layers and trains on TIC-normalized spectra without considering their spatial relationships (b). The parametrized lower-dimensional latent variable (Z) is captured at hidden layer h2. c The neural network is regularized using batch normalization (BN), and informative mass-to-charge ratio (m/z) values were identified using statistical analysis on the neural-network weight parameter (d).
Fig. 2
Fig. 2. Deep-learning-based analysis of an ultrahigh spectral resolution of 2D FT-ICR MSI of prostate cancer tissue.
a Distribution of the optimization convergence with the number of iterations (epochs). b The TIC-normalized distribution of original and predicted average spectra. c Five-dimensional-encoded features (latent variable z) represent the learned nonlinear manifold that enabled visualization and captured molecular patterns of the original high-dimensional MSI data of 61343 dimensions. These encoded features are of high quality as it were used to predict the original data with an overall mean squared error of 2.42×10⁵. d Spatial distribution of a few arbitrary m/z peaks for original and predicted MSI data and it reveals high estimation quality of the original observed data. Comparison between H&E stained histology and clustered molecular patterns reveals molecular-based tumor region: e Histopathological annotation of the tumor regions, f Gaussian-mixture model (with k = 6) was applied to cluster the encoded features, and the tumor-associated pattern is represented by the light-blue structure (cluster#1) that was extracted (g) and correlated with the reduced MSI data. The highest Pearson correlation value was with the ion feature at m/z 739.4664 ± 0.001 and it reveals elevation in the tumor region (h).
Fig. 3
Fig. 3. Analysis of 2D MALDI FT-ICR MSI dataset of PDX mouse brain model of glioblastoma.
a Distribution of optimization convergence, and b Overlay of the mean spectrum of both TIC-normalized original (green) and predicted (red) data with an overall mean squared error of 4.5×10⁴. c The clustered image of the encoded features (d) using GMM (k = 8) reveals biologically interesting tissue types, such as: normal tissue (cluster#1), tumor heterogeneity (cluster#2 and cluster#8) and a rim around the tumor (cluster#4). e Spatial distribution of a few biologically interesting m/z ions that were found highly colocalized within the clusters of interest, and there is a close similarity between the predicted and measured m/z ions.
Fig. 4
Fig. 4. Analysis  of 3D MALDI FT-ICR test dataset of a PDX mouse brain of glioblastoma.
Analysis on test dataset of MALDI FT-ICR of three consecutive section from a PDX mouse brain of glioblastoma based on the trained model shown in Fig. 3. The analysis was performed independently on each tissue section to reveal: a overlay of the overall mean spectrum of both TIC-normalized original (green) and predicted (red) data, b five-dimensional encoded features capture molecular structures located on a nonlinear manifold in the original high-dimensional data, c GMM-based clustering (k = 11) of the encoded features reveal biologically interesting clusters such as: tumor heterogenous regions (cluster4 and cluster#11) and a rim around the tumor (cluster#8), and d spatial distribution of a few learned m/z peaks that were found highly colocalized within distinct tumor clusters.
Fig. 5
Fig. 5. Analysis of 3D MALDI MSI test dataset of mouse kidney.
Analysis of 3D MALDI MSI test dataset of mouse kidney of total 72 tissue sections in which spectra of each 2D MSI dataset were independently analyzed: a distribution of average spectrum of both TIC-normalized original and predicted data of six datasets samples at different volumetric tissue depth (z-direction). b Low dimensional encoded features capture molecular structures from original high-dimensional data. c 3D distribution of distinct clusters in the entire dataset that were identified by clustering the encoded features of the entire dataset using GMM (k = 8) and each cluster represents a molecular pattern that reconciles the kidney’s anatomy.
Fig. 6
Fig. 6. Cross-validation analysis for the 3D MALDI MSI data of mouse kidney.
a The full MSI dataset (73 consecutive sections) was randomly shuffled and split into a 20% training set and an 80% testing set, and this process was repeated five times as such for each time the msiPL model was applied on the training set to optimize the artificial neural network and the trained model was then applied on the unseen test set. b The best cross-validation model was able to predict the original associated training dataset with minimal mean squared error of 6.18×10³, and showing close distribution of their average TIC-normalized spectra. c The trained model was applied on the unseen test set and revealed comparable performance. The stability of peak learning across different cross-validation models is with the frequency distribution of all m/z peaks identified in the five-fold cross-validation analyses (d), and the peaks count for each frequency (e). Overall, 69.6% of the peaks were found stable as they were consistently identified in 80% of the cross-validation analyses. f 3D Spatial distribution of selected stable m/z values and each of which reveals high localization to a specific structure that reconciles with the kidney’s anatomy, thereby reflecting relevance of the learned peaks.
Fig. 7
Fig. 7. Cross-validation analysis for the 3D DESI MSI dataset of a human specimen of colorectal carcinoma.
a The training set was used to optimize the neural network and then the trained model was applied on the testing set, and this process was repeated three times (rows) according to three-fold cross-validation shown in (b) in which the full dataset was randomly shuffled and split into training and testing sets. There is a close consensus in the performance of the cross-validated models in predicting the original data, learning the nonlinear manifold, and identifying the tumor and normal clusters. c The three cross-validated models showed stability in learning peaks of interest such as m/z 279.2 and m/z 766.5 that were found localized (>0.7 Pearson correlation) and elevated in the tumor and normal clusters, respectively.

References

    1. Aichler M, Walch A. MALDI Imaging mass spectrometry: current frontiers and perspectives in pathology research and practice. Lab Invest. 2015;95:422–431. doi: 10.1038/labinvest.2014.156. - DOI - PubMed
    1. Schulz S, Becker M, Groseclose MR, Schadt S, Hopf C. Advanced MALDI mass spectrometry imaging in pharmaceutical research and drug development. Curr. Opin. Biotechnol. 2019;55:51–59. doi: 10.1016/j.copbio.2018.08.003. - DOI - PubMed
    1. Basu SS, et al. Rapid MALDI mass spectrometry imaging for surgical pathology. npj Precis. Oncol. 2019;3:17. doi: 10.1038/s41698-019-0089-y. - DOI - PMC - PubMed
    1. McDonnell LA, Heeren RM. Imaging mass spectrometry. Mass Spectrom. Rev. 2007;26:606–643. doi: 10.1002/mas.20124. - DOI - PubMed
    1. Santagata S, et al. Intraoperative mass spectrometry mapping of an onco-metabolite to guide brain tumor surgery. Proc. Natl Acad. Sci. USA. 2014;111:11121–11126. doi: 10.1073/pnas.1404724111. - DOI - PMC - PubMed

Publication types

Substances