. 2022 Jan;34(2):e2104555.
doi: 10.1002/adma.202104555. Epub 2021 Sep 21.

Biosensor-Enabled Multiplexed On-Site Therapeutic Drug Monitoring of Antibiotics

Affiliations

Biosensor-Enabled Multiplexed On-Site Therapeutic Drug Monitoring of Antibiotics

H Ceren Ates et al. Adv Mater. 2022 Jan.

Abstract

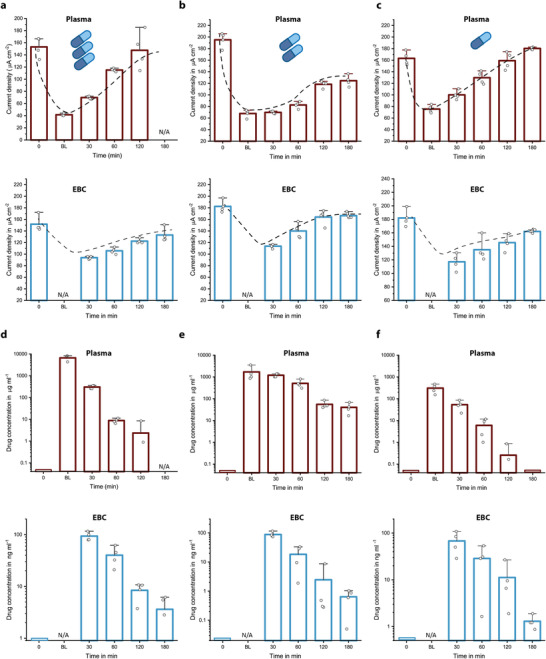
Personalized antibiotherapy ensures that the antibiotic concentration remains in the optimal therapeutic window to maximize efficacy, minimize side effects, and avoid the emergence of drug resistance due to insufficient dosing. However, such individualized schemes need frequent sampling to tailor the blood antibiotic concentrations. To optimally integrate therapeutic drug monitoring (TDM) into the clinical workflow, antibiotic levels can either be measured in blood using point-of-care testing (POCT), or can rely on noninvasive sampling. Here, a versatile biosensor with an antibody-free assay for on-site TDM is presented. The platform is evaluated with an animal study, where antibiotic concentrations are quantified in different matrices including whole blood, plasma, urine, saliva, and exhaled breath condensate (EBC). The clearance and the temporal evaluation of antibiotic levels in EBC and plasma are demonstrated. Influence of matrix effects on measured drug concentrations is determined by comparing the plasma levels with those in noninvasive samples. The system's potential for blood-based POCT is further illustrated by tracking ß-lactam concentrations in untreated blood samples. Finally, multiplexing capabilities are explored successfully for multianalyte/sample analysis. By enabling a rapid, low-cost, sample-independent, and multiplexed on-site TDM, this system can shift the paradigm of "one-size-fits-all" strategy.

Keywords: exhaled breath condensate; multiplexing; noninvasive diagnostics; point-of-care testing; ß-lactam antibiotics.


Conflict of interest statement

The authors declare no conflict of interest.

Figures

Figure 1
Figure 1
Utilization of proposed microfluidic biosensor (miLab) with the envisioned POC scenario. Both invasive and noninvasive samples collected from Landrace pigs given overdose, normal dose, and underdose piperacillin/tazobactam are analyzed using our electrochemical biosensor. The miLab chip consists of two consecutive zones separated by a hydrophobic stopping barrier. By separating the electrochemical detection zone from immobilization area, our platform can bypass the electrode fouling issue and operate with complex biofluids, like whole blood. A competitive and antibody‐free assay using penicillin‐binding proteins enables a rapid (less than 90 min) and highly sensitive (ng mL−1 range) detection of ß‐lactams. Combining with multiplexed microfluidics, our biosensor has the potential to be used in multianalyte/sample measurements as well as PK/PD and correlation studies for individualized drug therapy.
Figure 2
Figure 2
a–f) Measured current densities (a–c) and calculated free drug concentrations (d–f) for plasma and EBC samples of animals given overdose (a,d), normal dose (b,e), and underdose (c,f) piperacillin/tazobactam. A similar clearance behavior and expected concentration decrease with respect to drug dosing regimen were observed for both plasma and EBC measurements over a time period starting from before antibiotic administration (0), after 5 (BL), 30, 60, 120, and 180 min. For EBC measurements, the collection time is 30 min and thus, the first samples were collected at t = 30 min. For overdose animal, no plasma sample was collected at t = 180 min. Bar plot for n = 4 replicates. The error bars represent ±standard deviation (SD).
Figure 3
Figure 3
a–d) Demonstration of the measured current densities over a time period starting from before antibiotic administration (0), after 5 (BL), 30, 60, 120, and 180 min for plasma (a), saliva (b), urine (c), and EBC (d) samples of animals given overdose piperacillin/tazobactam. Bar plot for n = 4 replicates. Error bars represent ±SD. e) The drug concentration profiles for noninvasive samples revealing the decay in drug concentrations, and f) plasma piperacillin concentration gauged with HPLC measurement (gold standard) and our biosensor platform. Data points are fitted with an exponential decay function to demonstrate clearance behavior (n = 7; the error bars represent ±SD).
Figure 4
Figure 4
a–f) Measured current densities (a–c) and calculated free drug concentrations (d–f) for untreated whole blood samples of animals given overdose (a,d), normal dose (b,e), and underdose (c,f) piperacillin/tazobactam over a time period starting from before antibiotic administration (0), after 5 (BL), 30, 60, 120, 180, and 240 min. The effects of the drug dosing regimen on drug clearance and measured concentrations were observed. One anomaly was observed during the measurements of normal dosed animals at t = 180 min, which was later found to be related to the emergency dosage of anesthetic drug. Bar plot for n = 4 replicates. The error bars represent ±SD.
Figure 5
Figure 5
Multianalyte/sample capability of the proposed biosensing technology. a,b) 3D rendering of the stacked multiplexed biosensor (Biosensor X), and four different incubation areas (a), and individual electrochemical cells and Teflon barriers preventing electrode fouling (b). c) Exemplary amperometric signal readout of the multianalyte measurement. The first four successive peaks correspond to the accumulation of electrochemically active species in the immobilization area during stop‐flow protocol. During the “flow” phase, these species are passing through neighboring electrochemical cells in addition to their own individual electrochemical cell, which creates the following faint peaks. d) Demonstration of multisample measurement capability of Biosensor X via temporal evaluation of four different sample types on the same chip. Bar plot for n = 4 replicates. The error bars represent ±SD. e) Time‐dependent analysis of two different ß‐lactam in plasma samples of animals given normal dosage of piperacillin/tazobactam and meropenem. Bar plot for n = 4 replicates. The error bars represent ±SD. f) Validation of Biosensor X via comparing clearance behavior of piperacillin/tazobactam in plasma samples obtained with Biosensor X and miLab. Box and whisker plot for n = 7 (miLab) and n = 4 (Biosensor X) replicates. The error bars represent the outlier range.

References

    1. Ates H. C., Roberts J. A., Lipman J., Cass A. E. G., Urban G. A., Dincer C., Trends Biotechnol. 2020, 38, 1262. - PubMed
    1. Roberts J. A., Ulldemolins M., Roberts M. S., McWhinney B., Ungerer J., Paterson D. L., Lipman J., Int. J. Antimicrob. Agents 2010, 36, 332. - PubMed
    1. Wong G., Briscoe S., McWhinney B., Ally M., Ungerer J., Lipman J., Roberts J. A., J. Antimicrob. Chemother. 2018, 73, 3087. - PubMed
    1. Jelliffe R., Neely M., Bayard D., Handb. Anal. Sep. 2020, 7, 135.
    1. Individualized Drug Therapy for Patients (Eds: Jelliffe R. W., Neely M.), Elsevier B.V., The Netherlands 2017.

Substances

LinkOut - more resources