. 2021 Oct;27(10):2604-2618.
doi: 10.3201/eid2710.210103.

Predictors of Test Positivity, Mortality, and Seropositivity during the Early Coronavirus Disease Epidemic, Orange County, California, USA

Predictors of Test Positivity, Mortality, and Seropositivity during the Early Coronavirus Disease Epidemic, Orange County, California, USA

Daniel M Parker et al. Emerg Infect Dis. 2021 Oct.

Abstract

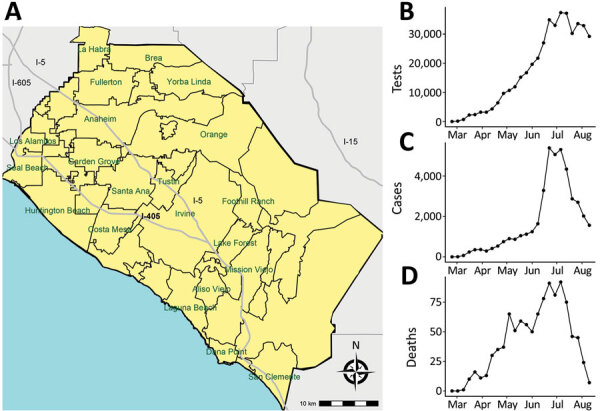
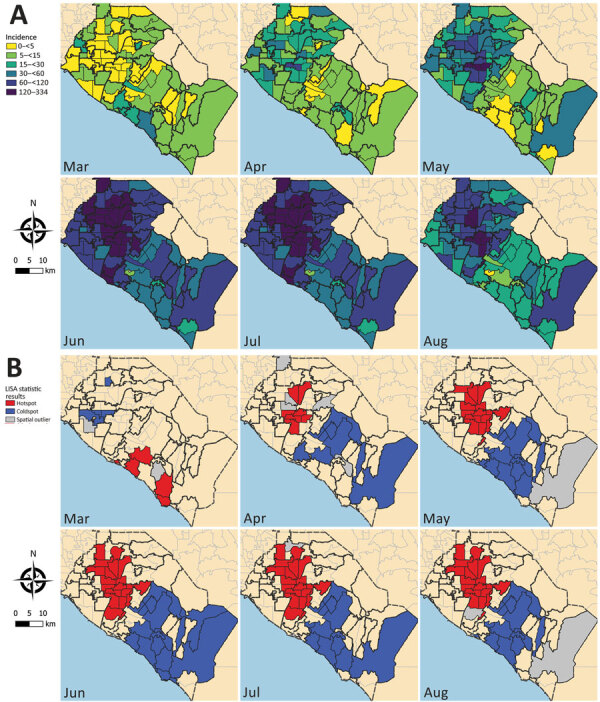
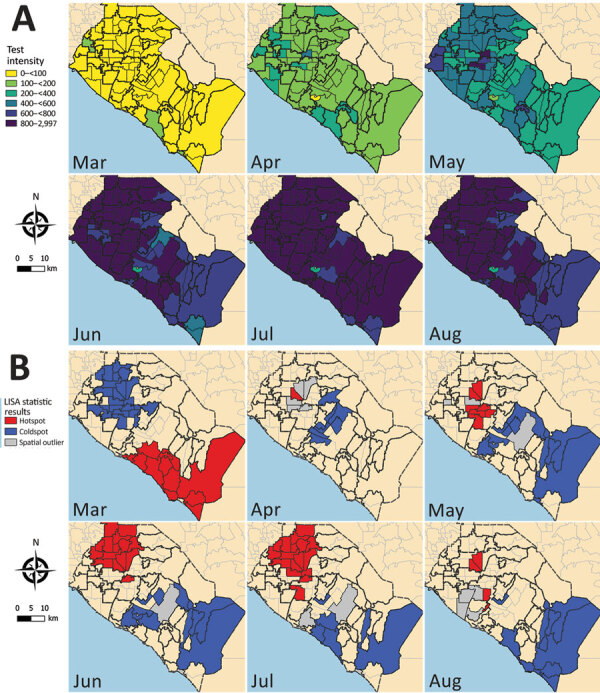
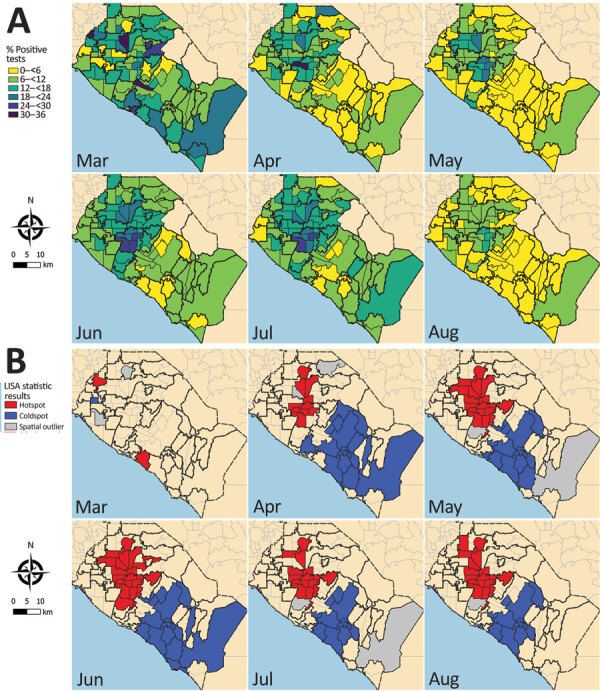
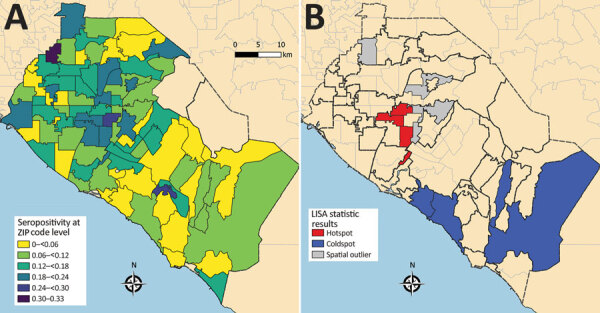
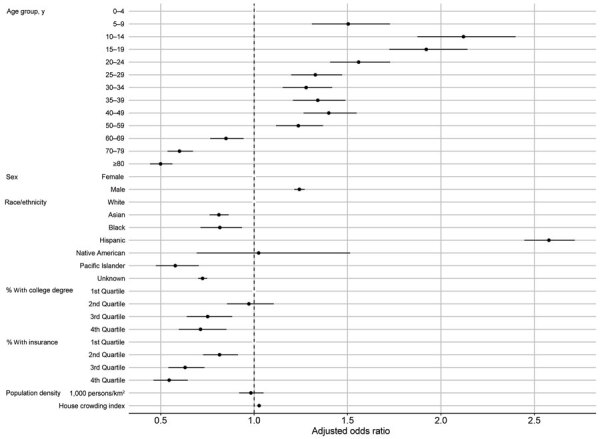
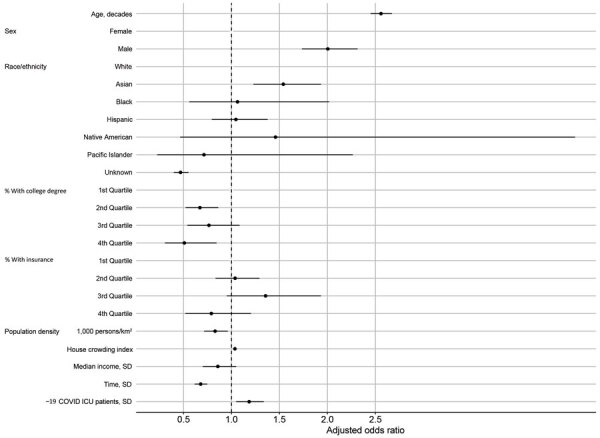
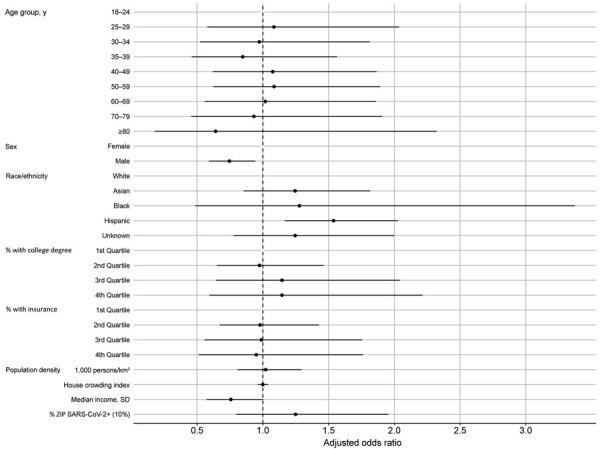
We conducted a detailed analysis of coronavirus disease in a large population center in southern California, USA (Orange County, population 3.2 million), to determine heterogeneity in risks for infection, test positivity, and death. We used a combination of datasets, including a population-representative seroprevalence survey, to assess the actual burden of disease and testing intensity, test positivity, and mortality. In the first month of the local epidemic (March 2020), case incidence clustered in high-income areas. This pattern quickly shifted, and cases next clustered in much higher rates in the north-central area of the county, which has a lower socioeconomic status. Beginning in April 2020, a concentration of reported cases, test positivity, testing intensity, and seropositivity in a north-central area persisted. At the individual level, several factors (e.g., age, race or ethnicity, and ZIP codes with low educational attainment) strongly affected risk for seropositivity and death.

Keywords: COVID-19; California; Orange County; SARS-CoV-2; United States; coronavirus disease; health equity; mortality; respiratory infections; seropositivity; severe acute respiratory syndrome coronavirus 2; test positivity; viruses; zoonoses.


Figures

Figure 1
Figure 1
Locations of major cities (A), number of weekly severe acute respiratory syndrome coronavirus 2 tests (B), weekly confirmed coronavirus disease cases (C), and weekly coronavirus disease deaths (D), Orange County, California, USA, July–August 2020.
Figure 2
Figure 2
Coronavirus disease incidence, Orange County, California, USA, July–August 2020. A) Reported case incidence of coronavirus by month. Case incidence is calculated as the number of cases per 100,000 persons per week.B) Results from tests of statistical clustering (based on LISA statistics [24]). LISA, local indicators of spatial autocorrelation.
Figure 3
Figure 3
Severe acute respiratory syndrome coronavirus 2 test intensity, Orange County, California, USA, July–August 2020. A) Test intensity by month, calculated as the number of tests per 100,000 persons per week at the ZIP code level. B) Results from tests of statistical clustering (based on LISA statistics [24]). LISA, local indicators of spatial autocorrelation.
Figure 4
Figure 4
Severe acute respiratory syndrome coronavirus 2 test positivity, Orange County, California, USA, July–August 2020. A) Test positivity at ZIP code level by month. B) Results from tests of statistical clustering (based on LISA statistics [24]). LISA, local indicators of spatial autocorrelation.
Figure 5
Figure 5
Severe acute respiratory syndrome coronavirus 2 seropositivity, Orange County, California, USA, July–August 2020. A) Seropositivity at ZIP code level. B) Results from tests of statistical clustering (based on LISA statistics [24]). LISA, local indicators of spatial autocorrelation.
Figure 6
Figure 6
Model-adjusted odds ratios and 95% CIs from the logistic regression for odds of testing positive for severe acute respiratory syndrome coronavirus 2, Orange County, California, USA, July–August 2020. Corresponding data presented in Table 2.
Figure 7
Figure 7
Three dimensional plot of the smoothed interaction between ZIP code–level median household income and time as a predictor of testing positive for severe acute respiratory syndrome coronavirus 2, Orange County, California, USA, July–August 2020.
Figure 8
Figure 8
Model-adjusted odds ratios and 95% CIs from the logistic regression for the odds of dying from COVID-19, Orange County, California, USA, July–August 2020. Corresponding data presented in Table 3. COVID-19, coronavirus disease; ICU, intensive care unit.
Figure 9
Figure 9
Model-adjusted odds ratios and 95% CIs from the logistic regression for the odds of being seropositive for severe acute respiratory syndrome coronavirus 2, Orange County, California, USA, July–August 2020. Corresponding data presented in Table 4.. +, positive.

References

    1. Dowd JB, Andriano L, Brazel DM, Rotondi V, Block P, Ding X, et al. Demographic science aids in understanding the spread and fatality rates of COVID-19. Proc Natl Acad Sci U S A. 2020;117:9696–8. 10.1073/pnas.2004911117 - DOI - PMC - PubMed
    1. Dorn AV, Cooney RE, Sabin ML. COVID-19 exacerbating inequalities in the US. Lancet. 2020;395:1243–4. 10.1016/S0140-6736(20)30893-X - DOI - PMC - PubMed
    1. Yancy CW. COVID-19 and African Americans. JAMA. 2020;323:1891–2. 10.1001/jama.2020.6548 - DOI - PubMed
    1. Garg S, Kim L, Whitaker M, O’Halloran A, Cummings C, Holstein R, et al. Hospitalization rates and characteristics of patients hospitalized with laboratory-confirmed coronavirus disease 2019—COVID-NET, 14 states, March 1–30, 2020. MMWR Morb Mortal Wkly Rep. 2020;69:458–64. 10.15585/mmwr.mm6915e3 - DOI - PMC - PubMed
    1. Dondorp AM, Hayat M, Aryal D, Beane A, Schultz MJ. Respiratory support in novel coronavirus disease (COVID-19) patients, with a focus on resource-limited settings. Am J Trop Med Hyg. 2020;102:1191–7. 10.4269/ajtmh.20-0283 - DOI - PMC - PubMed