. 2022 Feb;87(2):574-588.
doi: 10.1002/mrm.29018. Epub 2021 Sep 21.

Uncertainty in denoising of MRSI using low-rank methods

Affiliations

Uncertainty in denoising of MRSI using low-rank methods

William T Clarke et al. Magn Reson Med. 2022 Feb.

Abstract

Purpose: Low-rank denoising of MRSI data results in an apparent increase in spectral SNR. However, it is not clear if this translates to a lower uncertainty in metabolite concentrations after spectroscopic fitting. Estimation of the true uncertainty after denoising is desirable for downstream analysis in spectroscopy. In this work, the uncertainty reduction from low-rank denoising methods based on spatiotemporal separability and linear predictability in MRSI are assessed. A new method for estimating metabolite concentration uncertainty after denoising is proposed. Automatic rank threshold selection methods are also assessed in simulated low SNR regimes.

Methods: Assessment of denoising methods is conducted using Monte Carlo simulation of proton MRSI data and by reproducibility of repeated in vivo acquisitions in 5 subjects.

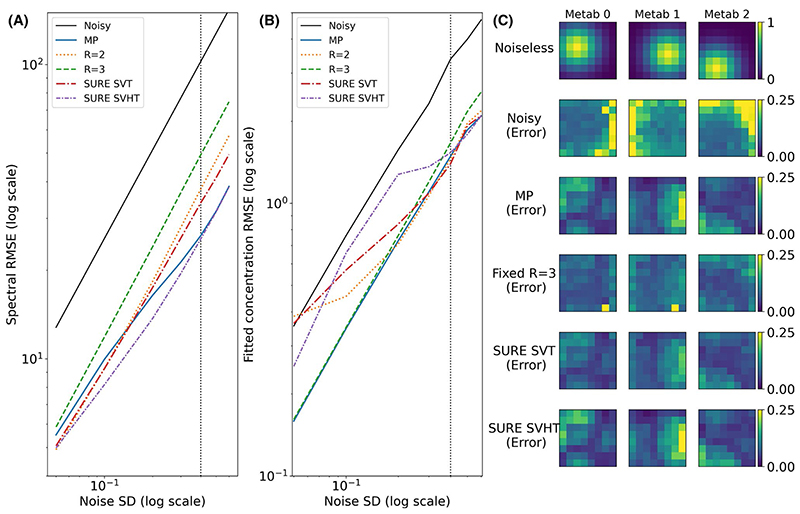
Results: In simulated and in vivo data, spatiotemporal based denoising is shown to reduce the concentration uncertainty, but linear prediction denoising increases uncertainty. Uncertainty estimates provided by fitting algorithms after denoising consistently underestimate actual metabolite uncertainty. However, the proposed uncertainty estimation, based on an analytical expression for entry-wise variance after denoising, is more accurate. It is also shown automated rank threshold selection using Marchenko-Pastur distribution can bias the data in low SNR conditions. An alternative soft-thresholding function is proposed.

Conclusion: Low-rank denoising methods based on spatiotemporal separability do reduce uncertainty in MRS(I) data. However, thorough assessment is needed as assessment by SNR measured from residual baseline noise is insufficient given the presence of non-uniform variance. It is also important to select the right rank thresholding method in low SNR cases.

Keywords: MRS; MRSI; denoising; low rank; spectroscopy.


Figures

Figure 1
Figure 1
(A) Example synthetic data at each of the 5 noise levels. (B) The 9-min equivalent data is shown denoised by each of the 5 methods
Figure 2
Figure 2
Spectral RMSE (A) and concentration RMSE (B) of the 5 different thresholding approaches of the simulated rank = 3 data, compared to the noisy data. (C) The noiseless concentration maps for each of the 3 “metabolites” and the absolute error for each method at a single noise level (dotted vertical line in A and B). High bias is observed for SURE SVHT and MP, with less seen in SURE SVT and R = 3. However, the fixed R = 3 shows higher average error
Figure 3
Figure 3
(A-C) Voxel-wise error distributions for 3 methods at 3 different noise levels. (D-F) Magnitude mean error, SD, and skew of the distributions formed by the voxel-wise error
Figure 4
Figure 4
(A) Single peak after application of different low-rank denoising methods (black line) and Monte Carlo 95% confidence intervals (shaded). (B) Monte Carlo SD of the denoised data (black) and the noise level estimated from a signal-free region of baseline (red). Although the original noisy data (left) has uniform and high variance the denoised data shows very inhomogeneous variance, with higher values in areas with signal present. Data shown has original noise SD of 0.1. Only a limited frequency range is shown in each panel
Figure 5
Figure 5
The variance estimated using the proposed method (blue) after global ST (A) and local ST (B) compared to the Monte Carlo variance estimate (grey). Shown is the noise variance before denoising (red) and that which would be estimated from the denoised signal-free baseline (black)
Figure 6
Figure 6
Single peak fitted amplitude uncertainty (SD) relative to “Noisy” for each denoising algorithm. Data shows the Monte Carlo estimated actual uncertainty (“MC”), the conventional uncertainty (“Fit”), and the Bootstrap estimated uncertainty (“BS”), as mean and SD across all simulated noise levels. The LP algorithm (green) increases uncertainty, all others decrease uncertainty. The conventionally estimated uncertainty is not accurate and for the global ST case is equal to that which would be estimated for the spatial average of all voxels. The proposed bootstrapping method provides an accurate estimate of the uncertainty for both the local and global ST algorithms
Figure 7
Figure 7
(A) Mean uncertainty of the fitted concentrations of the “high signal” metabolites expressed as a ratio to the original noisy data. Actual uncertainty measured by Monte Carlo simulation is compared with that conventionally estimated by the FSL-MRS fitting algorithm. (B) Normalized RMSE of the noisy and denoised data comparing the fitted concentrations of the “high signal” metabolites to that of the noiseless synthetic data
Figure 8
Figure 8
Estimated uncertainty at different noise levels by Monte Carlo simulation, FSL-MRS fitting, and bootstrap fitting for a single combined resonance (A) (NAA+NAAG), and all “high signal” metabolites (B)
Figure 9
Figure 9
(A) RMSE for high signal metabolites in denoised 4.5-min scans compared to the 45-min equivalent average. Blue shading indicates values lower than the noisy baseline; red indicates values higher. (B) Rainfall plots of the relative reproducibility (SD of the ten 4.5-min scans) for the “high signal” metabolites. Relative reproducibility is the voxel-wise SD of the ten 4.5-min scans measured relative to the “Noisy” median. Lower values represent more reproducible voxels. (C) Correlation of bootstrap measured relative uncertainty with relative reproducibility for the ST global (left) and ST local (right) denoised data

References

    1. Nguyen HM, Peng X, Do MN, Liang Z. Denoising MR spectroscopic imaging data with low-rank approximations. IEEE Trans Biomed Eng. 2013;60:78–89. - PMC - PubMed
    1. Veraart J, Novikov DS, Christiaens D, Ades-aron B, Sijbers J, Fieremans E. Denoising of diffusion MRI using random matrix theory. Neuroimage. 2016;142:394–406. - PMC - PubMed
    1. Moeller S, Pisharady PK, Ramanna S, et al. NOise reduction with DIstribution Corrected (NORDIC) PCA in dMRI with complex-valued parameter-free locally low-rank processing. Neuroimage. 2021;226:117539. - PMC - PubMed
    1. Vizioli L, Moeller S, Dowdle L, et al. A paradigm change in functional brain mapping: suppressing the thermal noise in fMRI. bioRxiv. 2020:2020.11.04.368357
    1. Lam F, Liang Z-P. A subspace approach to high-resolution spectroscopic imaging. Magn Reson Med. 2014;71:1349–1357. - PMC - PubMed

Publication types

LinkOut - more resources