Review
. 2021 Nov;301(2):250-262.
doi: 10.1148/radiol.2021204288. Epub 2021 Sep 21.

Quantification of Liver Fat Content with CT and MRI: State of the Art

Affiliations
Review

Quantification of Liver Fat Content with CT and MRI: State of the Art

Jitka Starekova et al. Radiology. 2021 Nov.

Abstract

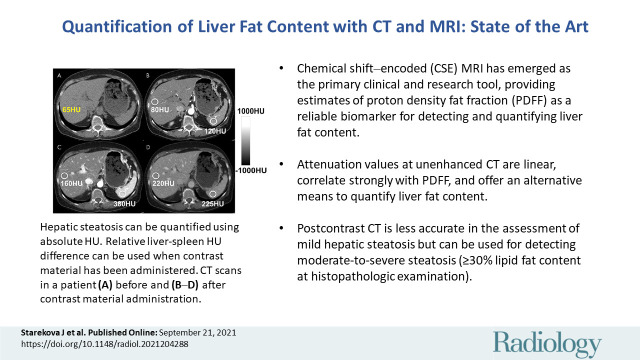
Hepatic steatosis is defined as pathologically elevated liver fat content and has many underlying causes. Nonalcoholic fatty liver disease (NAFLD) is the most common chronic liver disease worldwide, with an increasing prevalence among adults and children. Abnormal liver fat accumulation has serious consequences, including cirrhosis, liver failure, and hepatocellular carcinoma. In addition, hepatic steatosis is increasingly recognized as an independent risk factor for the metabolic syndrome, type 2 diabetes, and, most important, cardiovascular mortality. During the past 2 decades, noninvasive imaging-based methods for the evaluation of hepatic steatosis have been developed and disseminated. Chemical shift-encoded MRI is now established as the most accurate and precise method for liver fat quantification. CT is important for the detection and quantification of incidental steatosis and may play an increasingly prominent role in risk stratification, particularly with the emergence of CT-based screening and artificial intelligence. Quantitative imaging methods are increasingly used for diagnostic work-up and management of steatosis, including treatment monitoring. The purpose of this state-of-the-art review is to provide an overview of recent progress and current state of the art for liver fat quantification using CT and MRI, as well as important practical considerations related to clinical implementation.


Conflict of interest statement

Disclosures of Conflicts of Interest: J.S. disclosed no relevant relationships. D.H. is a cofounder of Calimetrix. P.J.P. is a paid consultant for Zebra and Bracco; has stock/stock options in SHINE and Elucent. S.B.R. is a Romnes Faculty Fellow and has received an award provided by the University of Wisconsin-Madison Office of the Vice Chancellor for Research and Graduate Education with funding from the Wisconsin Alumni Research Foundation; is a cofounder of Calimetrix.

Figures

None
Graphical abstract
Among the noninvasive modalities used for quantification of liver fat,
chemical shift–encoded (CSE) MRI–based proton density fat fraction
(PDFF) mapping has the best combination of accuracy, precision, and
reproducibility in the measurement of liver fat content. Estimation of hepatic
fat content using US is based on increased echogenicity and sound attenuation
and has low accuracy for detection of mild-to-moderate steatosis. Decreased
x-ray attenuation (Hounsfield units) on noncontrast CT scans can be used to
quantify liver fat and correlates closely and linearly with MRI PDFF. CSE MRI
generates confounder-corrected volumetric quantitative maps of PDFF, a
fundamental property of tissue. (A, D) Conventional US images, (B, E)
noncontrast CT images, and (C, F) MRI PDFF maps in 44-year-old man (patient 1)
with mild-to-moderate hepatic steatosis (MRI PDFF = 12%, CT attenuation = 43 HU)
and 59-year-old woman (patient 2) without steatosis (MRI PDFF = 2%, CT
attenuation = 65 HU).
Figure 1:
Among the noninvasive modalities used for quantification of liver fat, chemical shift–encoded (CSE) MRI–based proton density fat fraction (PDFF) mapping has the best combination of accuracy, precision, and reproducibility in the measurement of liver fat content. Estimation of hepatic fat content using US is based on increased echogenicity and sound attenuation and has low accuracy for detection of mild-to-moderate steatosis. Decreased x-ray attenuation (Hounsfield units) on noncontrast CT scans can be used to quantify liver fat and correlates closely and linearly with MRI PDFF. CSE MRI generates confounder-corrected volumetric quantitative maps of PDFF, a fundamental property of tissue. (A, D) Conventional US images, (B, E) noncontrast CT images, and (C, F) MRI PDFF maps in 44-year-old man (patient 1) with mild-to-moderate hepatic steatosis (MRI PDFF = 12%, CT attenuation = 43 HU) and 59-year-old woman (patient 2) without steatosis (MRI PDFF = 2%, CT attenuation = 65 HU).
Triglycerides have lower x-ray absorption than normal liver
parenchyma, leading to decreased CT attenuation (measured in Hounsfield
units) with increasing liver fat content. Shown are three example
noncontrast CT images in patients with increasing degrees of fat content.
Images were obtained in (A) a patient with normal liver and (B, C) patients
with moderate-to-severe (B) and severe (C) hepatic steatosis. The MRI proton
density fat fraction equivalent values to 65 HU, 23 HU, and –3 HU are
approximately 0.5%, 25%, and 40%, respectively.
Figure 2:
Triglycerides have lower x-ray absorption than normal liver parenchyma, leading to decreased CT attenuation (measured in Hounsfield units) with increasing liver fat content. Shown are three example noncontrast CT images in patients with increasing degrees of fat content. Images were obtained in (A) a patient with normal liver and (B, C) patients with moderate-to-severe (B) and severe (C) hepatic steatosis. The MRI proton density fat fraction equivalent values to 65 HU, 23 HU, and –3 HU are approximately 0.5%, 25%, and 40%, respectively.
Hepatic steatosis can be quantified using the absolute unenhanced CT
attenuation measured in Hounsfield units. Relative liver-spleen Hounsfield
unit difference can be used when iodinated contrast material has been
administered. An important pitfall to avoid is use of arterial phases where
the spleen enhances earlier than the liver, which could be mistaken for
hepatic steatosis using the spleen as the reference. CT scans obtained in a
patient (A) before and (B–D) after contrast material administration
in the arterial (B), late arterial (C), and portal venous (D) phases. No
steatosis is seen on unenhanced CT scan (65 HU) (A). CT scans obtained in
early (B) and late (C) arterial phase show liver Hounsfield unit is 40 HU
and 220 HU less, respectively, than that in the spleen, mimicking steatosis.
In portal venous phase (D), attenuation of liver and spleen is essentially
equal.
Figure 3:
Hepatic steatosis can be quantified using the absolute unenhanced CT attenuation measured in Hounsfield units. Relative liver-spleen Hounsfield unit difference can be used when iodinated contrast material has been administered. An important pitfall to avoid is use of arterial phases where the spleen enhances earlier than the liver, which could be mistaken for hepatic steatosis using the spleen as the reference. CT scans obtained in a patient (A) before and (B–D) after contrast material administration in the arterial (B), late arterial (C), and portal venous (D) phases. No steatosis is seen on unenhanced CT scan (65 HU) (A). CT scans obtained in early (B) and late (C) arterial phase show liver Hounsfield unit is 40 HU and 220 HU less, respectively, than that in the spleen, mimicking steatosis. In portal venous phase (D), attenuation of liver and spleen is essentially equal.
Detection and quantification of liver fat at CT is confounded by
substances that increase the attenuation of the liver, such as amiodarone,
iron, or glycogen. (A, B) Unenhanced CT images in a patient before (A) and
after (B) long-term treatment with amiodarone. (C, D) CT scans obtained in
patients with hereditary hemochromatosis (C) and transfusional hemosiderosis
(D) show increased liver attenuation.
Figure 4:
Detection and quantification of liver fat at CT is confounded by substances that increase the attenuation of the liver, such as amiodarone, iron, or glycogen. (A, B) Unenhanced CT images in a patient before (A) and after (B) long-term treatment with amiodarone. (C, D) CT scans obtained in patients with hereditary hemochromatosis (C) and transfusional hemosiderosis (D) show increased liver attenuation.
Chemical shift–encoded (CSE) MRI enables simultaneous
estimation of both liver fat and iron deposition. Fat-corrected R2*
(R2* = 1/T2*) mapping is a natural byproduct of multi-echo CSE
acquisitions used for R2*-corrected proton density fat fraction
(PDFF) mapping. Shown are representative MRI scans in three patients with
various fat and iron levels throughout the liver.
Figure 5:
Chemical shift–encoded (CSE) MRI enables simultaneous estimation of both liver fat and iron deposition. Fat-corrected R2* (R2* = 1/T2*) mapping is a natural byproduct of multi-echo CSE acquisitions used for R2*-corrected proton density fat fraction (PDFF) mapping. Shown are representative MRI scans in three patients with various fat and iron levels throughout the liver.
Motion-related ghosting from adipose tissue into the liver can lead to
substantial bias and variability of proton density fat fraction (PDFF)
measurements. Although three-dimensional chemical shift–encoded (CSE)
MRI acquisitions are relatively short (approximately 15–20 seconds),
many patients are unable to hold their breath even for this modest
acquisition time. PDFF maps acquired using three-dimensional CSE MRI in the
same patient during (A) free-breathing and (B) breath-hold. Scan obtained
during free breathing shows artifactually increased PDFF value due to
ghosting artifact from adipose tissue (arrow in A)..
Figure 6:
Motion-related ghosting from adipose tissue into the liver can lead to substantial bias and variability of proton density fat fraction (PDFF) measurements. Although three-dimensional chemical shift–encoded (CSE) MRI acquisitions are relatively short (approximately 15–20 seconds), many patients are unable to hold their breath even for this modest acquisition time. PDFF maps acquired using three-dimensional CSE MRI in the same patient during (A) free-breathing and (B) breath-hold. Scan obtained during free breathing shows artifactually increased PDFF value due to ghosting artifact from adipose tissue (arrow in A)..
Free-breathing (FB) two-dimensional (2D) sequential chemical
shift–encoded (CSE) MRI with centric encoding and variable flip angle
(VFA) strategy is a promising technique that can mitigate respiratory motion
while achieving high signal-to-noise ratio (SNR). Example proton density fat
fraction (PDFF) maps using breath holding (BH) and free breathing are shown.
(A) Three-dimensional (3D) multi-echo spoiled gradient-echo CSE MRI provides
good SNR performance, but reliable breath holding is necessary to avoid
motion-related artifacts that can occur even during breath holding (arrows).
(B) Free-breathing two-dimensional CSE MRI freezes respiratory motion by
using a very short temporal window, at the expense of lower SNR due to the
use of low flip angles needed to avoid T1-related bias. (C) In contrast, a
recently proposed variable flip angle sequential approach shows promise to
avoid breathing artifacts and T1 bias while achieving high SNR performance
(101).
Figure 7:
Free-breathing (FB) two-dimensional (2D) sequential chemical shift–encoded (CSE) MRI with centric encoding and variable flip angle (VFA) strategy is a promising technique that can mitigate respiratory motion while achieving high signal-to-noise ratio (SNR). Example proton density fat fraction (PDFF) maps using breath holding (BH) and free breathing are shown. (A) Three-dimensional (3D) multi-echo spoiled gradient-echo CSE MRI provides good SNR performance, but reliable breath holding is necessary to avoid motion-related artifacts that can occur even during breath holding (arrows). (B) Free-breathing two-dimensional CSE MRI freezes respiratory motion by using a very short temporal window, at the expense of lower SNR due to the use of low flip angles needed to avoid T1-related bias. (C) In contrast, a recently proposed variable flip angle sequential approach shows promise to avoid breathing artifacts and T1 bias while achieving high SNR performance (101).
Flow chart shows diagnostic imaging work-up for hepatic steatosis and
nonalcoholic fatty liver disease (NAFLD). In patients with abnormal liver
function tests or incidental findings of hepatic steatosis at imaging and high
clinical suspicion for NAFLD, a rapid MRI protocol targeted for liver fat
quantification is the method of choice to estimate steatosis severity. MRI
elastography might be added to assess stiffnesses of liver tissue and fibrosis
presence. If the probability of having NAFLD is lower, but steatosis cannot be
excluded, an extended liver protocol should be considered. CSE-MRI = chemical
shift–encoded MRI, GBCA = gadolinium-based contrast agent, IP/OP =
in-phase and opposed-phase imaging, T2w = T2-weighted imaging.
Figure 8:
Flow chart shows diagnostic imaging work-up for hepatic steatosis and nonalcoholic fatty liver disease (NAFLD). In patients with abnormal liver function tests or incidental findings of hepatic steatosis at imaging and high clinical suspicion for NAFLD, a rapid MRI protocol targeted for liver fat quantification is the method of choice to estimate steatosis severity. MRI elastography might be added to assess stiffnesses of liver tissue and fibrosis presence. If the probability of having NAFLD is lower, but steatosis cannot be excluded, an extended liver protocol should be considered. CSE-MRI = chemical shift–encoded MRI, GBCA = gadolinium-based contrast agent, IP/OP = in-phase and opposed-phase imaging, T2w = T2-weighted imaging.
Chemical shift–encoded (CSE) MRI enables assessment of fat
content over the entire liver, unlike MR spectroscopy and biopsy, which
sample small regions of tissue and provide no information about the spatial
variability of steatosis.. Shown are three-dimensional CSE MRI proton
density fat fraction (PDFF) maps in three different patients with
heterogeneous pattern of steatosis.
Figure 9:
Chemical shift–encoded (CSE) MRI enables assessment of fat content over the entire liver, unlike MR spectroscopy and biopsy, which sample small regions of tissue and provide no information about the spatial variability of steatosis.. Shown are three-dimensional CSE MRI proton density fat fraction (PDFF) maps in three different patients with heterogeneous pattern of steatosis.
Nonalcoholic fatty liver disease can occur at an early age. Chemical
shift–encoded (CSE) MRI allows reliable noninvasive quantification of
liver fat content in children. These examples show representative proton
density fat fraction (PDFF) maps obtained with CSE MRI within a single
breath hold in (A) an 11-year-old boy with normal (<5%) liver fat
content, (B) a 12-year-old boy with moderate steatosis, (C) an 11-year-old
boy with moderate-to-severe steatosis, and (D) a 27-year-old man with severe
steatosis.
Figure 10:
Nonalcoholic fatty liver disease can occur at an early age. Chemical shift–encoded (CSE) MRI allows reliable noninvasive quantification of liver fat content in children. These examples show representative proton density fat fraction (PDFF) maps obtained with CSE MRI within a single breath hold in (A) an 11-year-old boy with normal (<5%) liver fat content, (B) a 12-year-old boy with moderate steatosis, (C) an 11-year-old boy with moderate-to-severe steatosis, and (D) a 27-year-old man with severe steatosis.

References

    1. Alkhouri N , Dixon LJ , Feldstein AE . Lipotoxicity in nonalcoholic fatty liver disease: not all lipids are created equal . Expert Rev Gastroenterol Hepatol 2009. ; 3 ( 4 ): 445 – 451 . - PMC - PubMed
    1. Brunt EM , Janney CG , Di Bisceglie AM , Neuschwander-Tetri BA , Bacon BR . Nonalcoholic steatohepatitis: a proposal for grading and staging the histological lesions . Am J Gastroenterol 1999. ; 94 ( 9 ): 2467 – 2474 . - PubMed
    1. Chalasani N , Younossi Z , Lavine JE , et al. . The diagnosis and management of nonalcoholic fatty liver disease: Practice guidance from the American Association for the Study of Liver Diseases . Hepatology 2018. ; 67 ( 1 ): 328 – 357 . - PubMed
    1. Younossi ZM , Koenig AB , Abdelatif D , Fazel Y , Henry L , Wymer M . Global epidemiology of nonalcoholic fatty liver disease-Meta-analytic assessment of prevalence, incidence, and outcomes . Hepatology 2016. ; 64 ( 1 ): 73 – 84 . - PubMed
    1. Schwimmer JB , Deutsch R , Kahen T , Lavine JE , Stanley C , Behling C . Prevalence of fatty liver in children and adolescents . Pediatrics 2006. ; 118 ( 4 ): 1388 – 1393 . - PubMed

Publication types

MeSH terms

LinkOut - more resources