. 2021 Nov 1;218(11):e20210846.
doi: 10.1084/jem.20210846. Epub 2021 Sep 21.

Implication of folate deficiency in CYP2U1 loss of function

Affiliations

Implication of folate deficiency in CYP2U1 loss of function

Claire Pujol et al. J Exp Med. .

Abstract

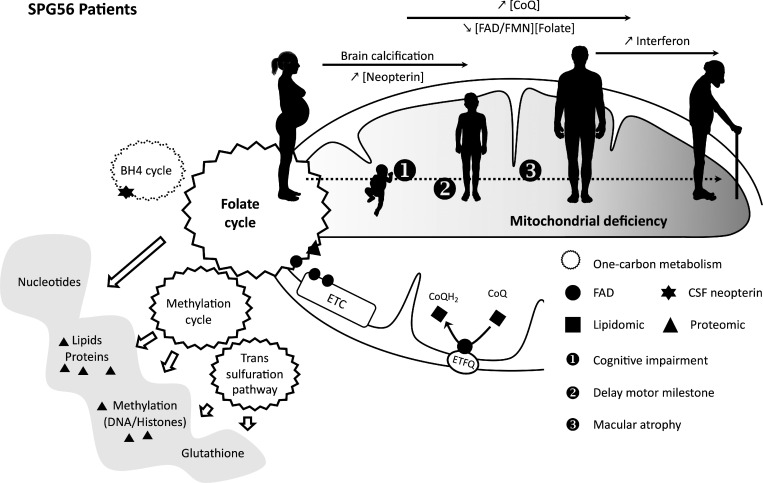
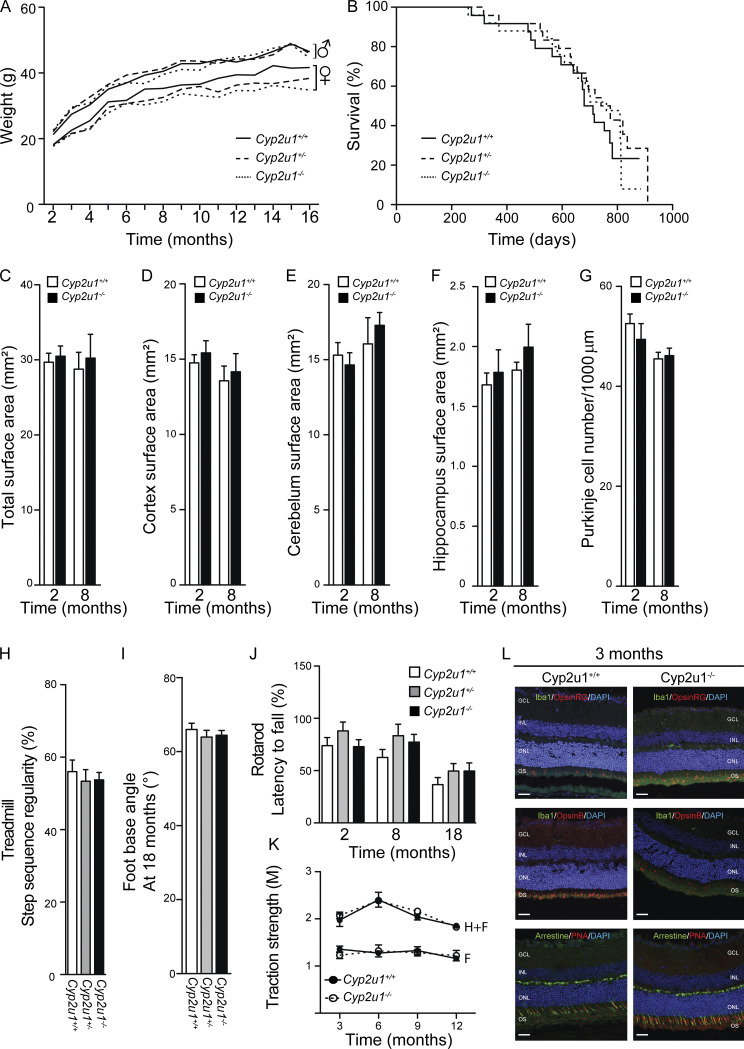
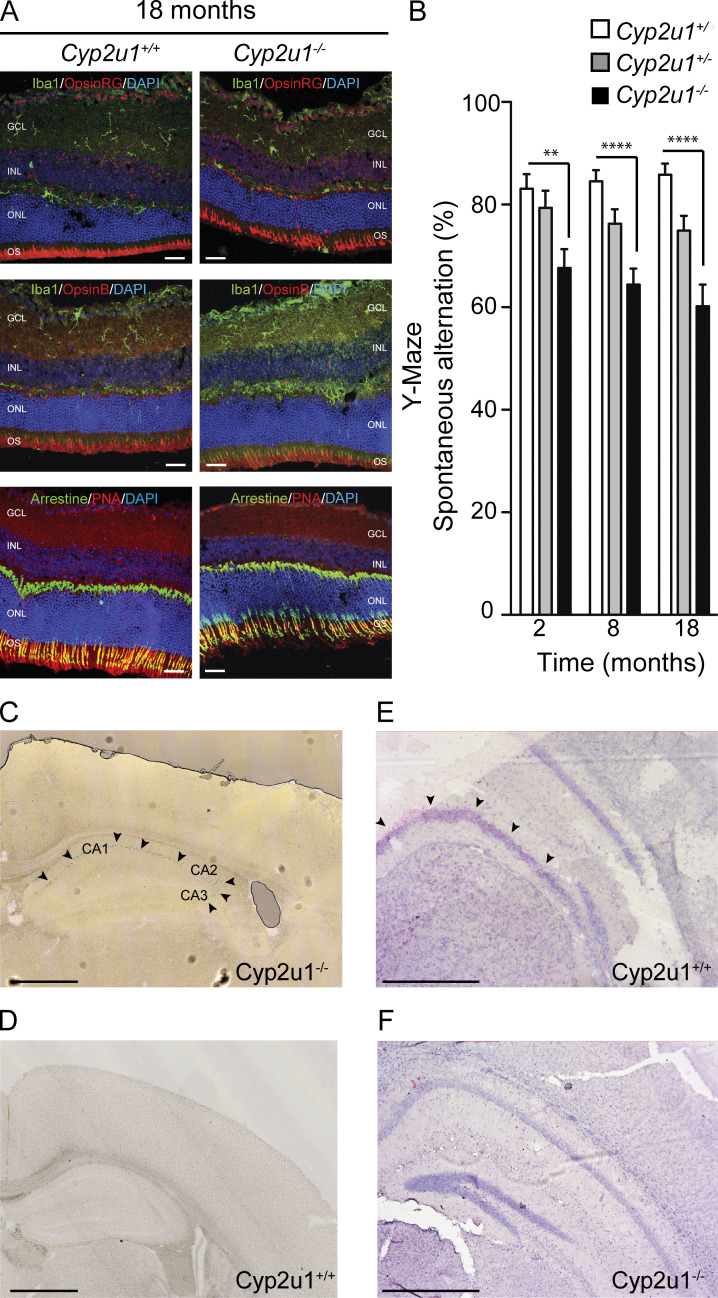
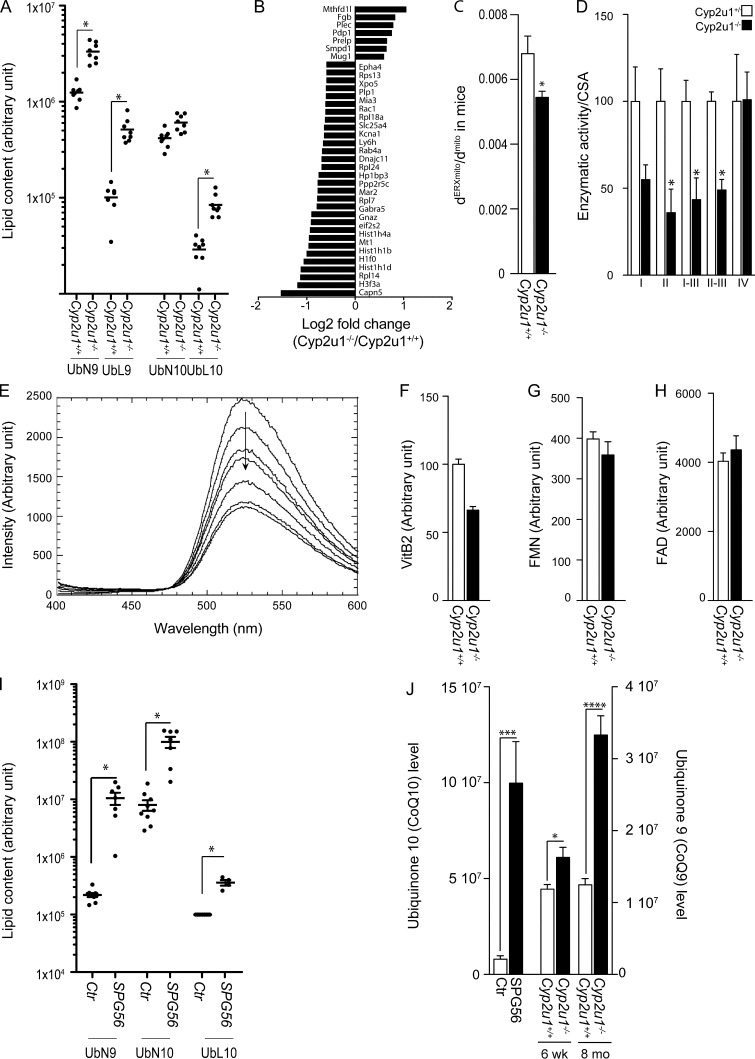
Hereditary spastic paraplegias are heterogeneous neurodegenerative disorders. Understanding of their pathogenic mechanisms remains sparse, and therapeutic options are lacking. We characterized a mouse model lacking the Cyp2u1 gene, loss of which is known to be involved in a complex form of these diseases in humans. We showed that this model partially recapitulated the clinical and biochemical phenotypes of patients. Using electron microscopy, lipidomic, and proteomic studies, we identified vitamin B2 as a substrate of the CYP2U1 enzyme, as well as coenzyme Q, neopterin, and IFN-α levels as putative biomarkers in mice and fluids obtained from the largest series of CYP2U1-mutated patients reported so far. We also confirmed brain calcifications as a potential biomarker in patients. Our results suggest that CYP2U1 deficiency disrupts mitochondrial function and impacts proper neurodevelopment, which could be prevented by folate supplementation in our mouse model, followed by a neurodegenerative process altering multiple neuronal and extraneuronal tissues.


Conflict of interest statement

Disclosures: F. Darios reports "other" from Dynacure SAS outside the submitted work. D. Galatolo is supported by a grant from Treat SPG56. G. Stevanin reports grants from ASL-HSP association, the Tom-Wahlig-Stiftung Foundation, and the European Union 7th Framework Programme (Neuromics); non-financial support from Agence Nationale de la Recherche (framework programme Investissements d'Avenir) during the conduct of the study; and grants from Biogen outside the submitted work. N. Vilain reports grants from Fondation Bettencourt-Schueller, Fondation Servier, Union Nationale pour les Intérêts de la Médecine, and Fondation pour la Recherche sur l'Alzheimer; non-financial support from Movement Disorders Society, Merz-Pharma, and GE Healthcare SAS; and "other" from Biogen, Eisai, Eli-Lilly, Roche, Janssen - Johnson & Johnson, and Alector outside the submitted work. No other disclosures were reported.

Figures

None
Graphical abstract
Figure S1.
Figure S1.
Characterization of Cyp2u1/ mice. (A) Mean body mass of female and male Cyp2u1+/+ (black line), Cyp2u1+/− (dashed line), and Cyp2u1/ (dotted line) at the indicated times (n = 26 animals per genotype). (B) Kaplan–Meier survival curves for overall mortality of Cyp2u1+/+ (black line, n = 26), Cyp2u1+/− (dashed line, n = 30), and Cyp2u1/ (dotted line, n = 34) mice. (C) Quantification of the total surface areas of brain coronal slices (sections cut between Bregma 0.90 and 0.60 mm) of Cyp2u1+/+ (white bars) and Cyp2u1/ (black bars) mice at 2 and 8 mo of age (n ≥ 5 slices/animal and n ≥ 5 animals/genotype/age). (D) Quantification of the surface areas of the cortex (sections cut between Bregma 0.90 and 0.60 mm) of Cyp2u1+/+ (white bars) and Cyp2u1/ (black bars) mice at 2 and 8 mo of age (n ≥ 5 slices/animal and n ≥ 5 animals/genotype/age). (E) Quantification of the cerebellum surface areas of brain coronal slices (sections cut between Bregma −6.00 and −6.30 mm) of Cyp2u1+/+ (white bars) and Cyp2u1/ (black bars) mice at 2 and 8 mo of age (n ≥ 5 slices/animal and n ≥ 5 animals/genotype/age). (F) Quantification of the hippocampal surface-areas of brain coronal slices (sections cut between Bregma −1.70 and −2.00 mm) of Cyp2u1+/+ (white bars) and Cyp2u1/ (black bars) mice at 2 and 8 mo of age (n ≥ 5 slices/animal and n ≥ 5 animals/genotype/age). (G) Cerebellar sections immunostained for GFAP (astrocyte marker), Calbindin (Purkinje cell marker), and Hoechst-33258 (nucleus marker) allowed the quantification of Purkinje cells in Cyp2u1/ mice (black bars) compared with control (white bars). (H) Step sequence regularity values recorded during a forced walk on a treadmill at moderate speed (10 cm/s) of 18-mo-old Cyp2u1+/+ (white bars, n = 7), Cyp2u1+/− (gray bars, n = 6), and Cyp2u1/ (black bars, n = 6) mice. Values shown are mean ± SEM. (I) Measurement of the foot/base angle for 18-mo-old Cyp2u1+/+ (white bars, n = 8), Cyp2u1+/− (gray bars, n = 7), and Cyp2u1/ (black bars, n = 7) mice. Values shown are mean ± SEM. (J) Rotarod duration of Cyp2u1+/+ (white bars), Cyp2u1+/− (gray bars), and Cyp2u1/ (black bars) mice at 2 mo (n = 16/genotype), 8 mo (n = 24/genotype), and 18 mo (n = 18/genotype). Values shown are mean ± SEM. (K) Grip test of Cyp2u1+/+ (black circle) and Cyp2u1/ (white circle) mice to test the muscular strength in both forelimbs (F) and hindlimbs (H) from 3–12-mo-old compared with control mice (n > 4 for 2/6/9 mo/genotype and n = 2 for 12-mo/genotype). (L) Immunofluorescence analysis on vertical sections of 3-mo-old wild-type and Cyp2u1/ mice retinas stained for Iba1/Arrestin (green) and OpsinRG/OpsinB/PNA (red) with DAPI counterstaining (blue). Exemplary images are shown from at least three experimental repetitions. With outer nuclear layer (ONL), inner nuclear layer (INL), ganglion cell layer (GCL), and outer segments (OS). Scale bar: 100 µm.
Figure 1.
Figure 1.
Characterization of Cyp2u1/ mice. (A) Immunofluorescence analysis on sections of vertical retinas of 18-mo-old mice stained for Iba1/Arrestin (green) and OpsinRG/OpsinB/PNA (red) with DAPI counterstaining (blue); n = 2. With outer nuclear layer (ONL), inner nuclear layer (INL), ganglion cell layer (GCL), and outer segments (OS). Scale bar: 100 µm. (B) Spontaneous alternation behavior in the Y-Maze task at various times, showing impaired spontaneous alternation worsening with time in Cyp2u1/ mice. Data pooled from at least two independent experiments with n = 16/genotype. Data are mean ± SEM. Unpaired two-tailed Student t test. **, P < 0.01; ****, P < 0.0001. (C–F) Expression of the Cyp2u1 gene in 2-mo-old mouse hippocampus through histochemical analysis of β-gal expression under Cyp2u1 promoter by X-gal staining, pinpointed by arrows in Cyp2u1/ mice (C). In D, note the absence of staining in Cyp2u1+/+ mice. RNAscope (pink labeling) targeting Cyp2u1 mRNA transcripts in wild-type (E) or knockout (F) animals. Note the absence of staining in Cyp2u1/ mice. Exemplary images are shown from at least two independent experiments. Scale bar: 1 mm.
Figure 2.
Figure 2.
Molecular and biochemical characterization of SPG56 patients and Cyp2u1/ mice. (A) Representation of the relative amounts of various classes of CoQ (ubiquinon 9 and 10 [UbN9, UbN10], ubiquinol 9 and 10 [UbL9, UbL10]) in the hippocampus of 2-mo-old Cyp2u1+/+ and Cyp2u1/ mice (n = 8/genotype). Arbitrary units. Nonparametric Kruskal–Wallis test without correction for multiple testing from log10-transformed data. *, P values below a threshold set at 0.05. (B) Proteomic analysis in wild-type and knockout mice. Representation of the log2 fold-change to show the functional enrichments of proteins up- and down-regulated in Cyp2u1/ vs. wild-type hippocampus of 2-mo-old mice (n = 6/genotype). (C) Quantitative analysis of the mitochondrial surface closely apposed to ER in control (n = 2; 170 contacts, white bar) and Cyp2u1/ (n = 2; 410 contacts, black bar) mice. Unpaired two-tailed Student’s t test. *, P < 0.05. (D) Enzymatic activity of electron transport chain complexes normalized to citrate synthase activity (CSA) in brain mitochondria of 12-mo-old mice (n = 4/genotype). Unpaired two-tailed Student’s t test. *, P < 0.05 between wild-type (white bars) and knockout (black bars) animals. (E) Typical experiment showing quenching of fluorescence of 10 µM riboflavin by increasing concentrations of CYP2U1 in vitro (0–8 µM). (F–H) Metabolomic analysis to measure the relative amounts of vitamin B2 (VitB2; F), FMN (G), and FAD (H) from hippocampus of Cyp2u1+/+ (white bars) and Cyp2u1/ (black bars) 2-mo-old mice (n = 4/genotype). (I) Representation of the relative amounts of various classes of CoQ (ubiquinon 9 and 10 [UbN9, UbN10], ubiquinol 10 [UbL10]) in plasma samples of 7 SPG56 patients and 9 age/gender-matched controls. For UbL10, the values for the controls were below the detection threshold, and an arbitrary value corresponding to the detection threshold was given to the control for the representation. Arbitrary units. P values using the nonparametric Kruskal–Wallis test without correction for multiple testing from log10-transformed data. *, P values below a threshold set at 0.05. (J) Representation of the main oxidized CoQ form; CoQ10 in 7 SPG56 patients (black bars) and 9 age/gender matched controls (white bars); CoQ9 in hippocampus of Cyp2u1+/+ (white bars) and Cyp2u1/ (black bars) mice at 6 wk and 8 mo of age (n = 8). *, P ≤ 0.05; ***, P ≤ 0.001; ****, P ≤ 0.0001.
Figure S2.
Figure S2.
Molecular and biochemical characterization of SPG56 patients and Cyp2u1/ mice. (A) Quantitative analysis of the mitochondrial surface closely apposed to ER in control and SPG56 patients’ fibroblasts (n = 33/genotype). *, P ≤ 0.05. (B) Schematic representation of CoQ biosynthesis in mammalian cells. (C) Transcript levels of genes encoding enzymes of the CoQ synthesis pathway in Cyp2u1+/+ (white bars) and Cyp2u1/ (black bars) with n = 4/genotype and normalization with β-2-microglobulin. (D) Levels of the biosynthetic proteins COQ5, COQ6, and COQ9 in hippocampus homogenates of 2- and 8-mo-old mice (n = 3/genotype). Tubulin was used as a loading control. Exemplary images are shown from at least two independent experiments. MW, molecular weight. (E) Steady-state levels of different OXPHOS system subunits determined by Western blot analysis of brain mitochondria from control and Cyp2u1/ mice at age 12 mo (n = 2/genotype). Exemplary images are shown from at least two independent experiments. (F and G) BN-PAGE using digitonin, followed by in-gel activity assay (F) and immunoblotting (G) used to define brain mitochondrial complexes and SCs in wild-type and Cyp2u1/ mice (n = 3/genotype). (F) In-gel activity (IGA) of CI (left) and CIV (right). (G) Western blot analysis of levels of NDUFA9 (CI), Fp subunit (CII), subunit core 1 (CIII), subunit I (CIV), and the α-subunit of ATP synthase (complex V). (H) Effects of increased concentrations of recombinant CYP2U1 on riboflavin fluorescence. Experiments were conducted in 50 mM phosphate buffer containing 10 µM of riboflavin, alone (black circles) or in the presence of 1 µM (red squares), 2 µM (empty squares), 4 µM (violet squares), and 8 µM (pink circles) of purified CYP2U1. λex = 385 nm; λem = 520 nm. Excitation and emission slit widths were 15 and 20 nm, respectively. (I) Replot of the percentage of riboflavin fluorescence in the presence of increasing concentrations of CYP2U1. Data are representative of a typical experiment. (J) Representative pose showing the positioning of riboflavin in close proximity with the heme in a 3D model. Distances between the two methyl groups of riboflavin and the iron are 8.38 and 6.03 Å. CDOCKER interaction energy = −54.36 kcal/mol. (K) Representative pose showing the positioning of riboflavin in close proximity with the heme. Distance between the NH group of riboflavin and the iron is 6.35 Å. CDOCKER interaction energy = −52.07 kcal/mol).
Figure 3.
Figure 3.
Folate implication in disease. (A) Schematic representation of FAD/FMN implications in mitochondria. A, FAD; M, FMN; MTR, methionine synthase reductase; THF, tetrahydrofolate; VitB2, vitamin B2. (B) Folate measurement in the plasma of mice (data pooled from at least three independent experiments with n = 16/genotype). (C) Head CT and brain MRI scans of five SPG56 patients. CT of patient 4 at 1 yr of age (a) showing subcortical calcifications with nodular and linear shape in frontal, parietal, and occipital lobes (arrows). Brain MRI (b–d) of the same patient at age 15. Pathological hypersignal in magnetization transfer T1 axial sequence (b) in bilateral pallidus (arrows), coupled with T2* hyposignal in the same region (c), suggestive of calcium deposition (arrows). Axial FLAIR sequences evidence confluent hyperintensities in deep periventricular white matter (d) with a radial distribution with respect to the lateral ventricles (arrowheads). Larger and confluent calcifications are evident in the brain CT (e) of his sibling (patient 3) at age 2 yr, especially in subcortical white matter at the level of the frontal and occipital horns (arrows). Head CT of patient 13 (f and g) at age 9 yr showing millimetric subcortical calcifications in left frontal and parietal lobes (arrows). Axial FLAIR sequence from brain MRI of patient 12 (h) at age 9 yr showing a nodular white matter hyperintensity in the right frontal lobe (arrowhead). Head CT of patient 12 at age 26 yr (i and j) evidencing minute cortico-subcortical calcifications in frontal lobes and massive confluent calcifications involving the lenticular nucleus bilaterally (arrows). Brain MRI of patient 2 at different time points (k­–o). Bilateral pallidal hyposignal, likely due to calcifications, at age 37 yr (axial T2* sequence; k, arrows), along with deep periventricular white matter hyperintensities (axial FLAIR sequence; l, arrowheads), increasing in size and number over time, as seen at age 44 yr (axial FLAIR sequence; m, arrowheads). Moderate cortical atrophy, most notably at frontal level (axial T1 sequence; n), and significant cerebellar atrophy (sagittal T1 sequence; o) were clearly evident at age 44 yr as well (arrows). (D) Spontaneous alternation behavior in the Y-Maze task by 2-mo-old mice complemented with folate. Data pooled from at least two independent experiments with n = 11/genotype. Folate supplementation improved this behavior in Cyp2u1/ animals only with n (%) spontaneous alternation behavior in Cyp2u1/ mice without folate complementation. Values are mean ± SEM.

Similar articles

Cited by

References

    1. Acosta, M.J., Vazquez Fonseca L., Desbats M.A., Cerqua C., Zordan R., Trevisson E., and Salviati L.. 2016. Coenzyme Q biosynthesis in health and disease. Biochim. Biophys. Acta. 1857:1079–1085. 10.1016/j.bbabio.2016.03.036 - DOI - PubMed
    1. Albani, S.H., McHail D.G., and Dumas T.C.. 2014. Developmental studies of the hippocampus and hippocampal-dependent behaviors: insights from interdisciplinary studies and tips for new investigators. Neurosci. Biobehav. Rev. 43:183–190. 10.1016/j.neubiorev.2014.04.009 - DOI - PMC - PubMed
    1. Balasubramaniam, S., Christodoulou J., and Rahman S.. 2019. Disorders of riboflavin metabolism. J. Inherit. Metab. Dis. 42:608–619. 10.1002/jimd.12058 - DOI - PubMed
    1. Bibi, F., Efthymiou S., Bourinaris T., Tariq A., Zafar F., Rana N., Salpietro V., Houlden H., Raja G.K., Saeed S., and Minhas N.M.. SYNaPS Study Group . 2020. Rare novel CYP2U1 and ZFYVE26 variants identified in two Pakistani families with spastic paraplegia. J. Neurol. Sci. 411:116669. 10.1016/j.jns.2020.116669 - DOI - PubMed
    1. Blau, N., Bonafé L., Krägeloh-Mann I., Thöny B., Kierat L., Häusler M., and Ramaekers V.. 2003. Cerebrospinal fluid pterins and folates in Aicardi-Goutières syndrome: a new phenotype. Neurology. 61:642–647. 10.1212/01.WNL.0000082726.08631.E7 - DOI - PubMed

Publication types