. 2021 Sep 28;5(18):3568-3580.
doi: 10.1182/bloodadvances.2020004098.

The brain-derived neurotrophic factor prompts platelet aggregation and secretion

Affiliations

The brain-derived neurotrophic factor prompts platelet aggregation and secretion

Imane Boukhatem et al. Blood Adv. .

Abstract

Brain-derived neurotrophic factor (BDNF) has both autocrine and paracrine roles in neurons, and its release and signaling mechanisms have been extensively studied in the central nervous system. Large quantities of BDNF have been reported in circulation, essentially stored in platelets with concentrations reaching 100- to 1000-fold those of neurons. Despite this abundance, the function of BDNF in platelet biology has not been explored. At low concentrations, BDNF primed platelets, acting synergistically with classical agonists. At high concentrations, BDNF induced complete biphasic platelet aggregation that in part relied on amplification from secondary mediators. Neurotrophin-4, but not nerve growth factor, and an activating antibody against the canonical BDNF receptor tropomyosin-related kinase B (TrkB) induced similar platelet responses to BDNF, suggesting TrkB could be the mediator. Platelets expressed, both at their surface and in their intracellular compartment, a truncated form of TrkB lacking its tyrosine kinase domain. BDNF-induced platelet aggregation was prevented by inhibitors of Ras-related C3 botulinum toxin substrate 1 (Rac1), protein kinase C, and phosphoinositide 3-kinase. BDNF-stimulated platelets secreted a panel of angiogenic and inflammatory cytokines, which may play a role in maintaining vascular homeostasis. Two families with autism spectrum disorder were found to carry rare missense variants in the BDNF gene. Platelet studies revealed defects in platelet aggregation to low concentrations of collagen, as well as reduced adenosine triphosphate secretion in response to adenosine diphosphate. In summary, circulating BDNF levels appear to regulate platelet activation, aggregation, and secretion through activation of a truncated TrkB receptor and downstream kinase-dependent signaling.


Figures

None
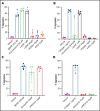
Graphical abstract
Figure 1.
Figure 1.
BDNF induces complete, biphasic platelet aggregation in washed platelets. Representative trace (A) and quantification (B) of platelet aggregation in response to 40, 125, and 370 nM BDNF. Repeated-measures ANOVA, P = .0004; vehicle vs 125 nM BDNF, P = .01; vehicle vs BDNF 370 nM, P < .0001. Example trace (C) and quantification (D) of neutralization of BDNF-induced aggregation by the mab#9 antibody (2.5 µg/mL). IgG2B was used as an isotype control (2.5 µg/mL). Results are representative of ≥5 independent experiments. Repeated-measures ANOVA, P < .0001; BDNF 370 nM vs BDNF 370 nM in the presence of mab#9, P < .0001. Example trace (E) and quantification (F) of BDNF-induced platelet aggregation in the presence of inhibitors of secondary mediators (30 µM aspirin, 1 µM AR-C66096 (ARC), and 9 µM eptifibatide (Integrilin)). Results are representative of 5 independent experiments. Repeated-measures ANOVA, P < .0001; compared with BDNF 370 nM: inhibition with aspirin, P = .001; inhibition with AR-C66096, P = .0002; and inhibition with eptifibatide, P < .0001. Arrowheads indicate the time point at which the agonist was added. Data are presented as median and IQR.
Figure 2.
Figure 2.
BDNF acts as a platelet primer to other classical agonists. Example trace and quantification of platelet aggregation of platelets pre-incubated with BDNF (40 nM) in response to subthreshold concentrations of collagen (A) (0.125-0.5 µg/mL; repeated-measures ANOVA test, P = .01; compared with vehicle, both BDNF and collagen, P > .05; compared with collagen alone, collagen + BDNF, P = .005), arachidonic acid (B) (0.5-2.5 µM; repeated-measures ANOVA test, P = .208), TRAP (C) (0.5 µM; repeated-measures ANOVA test, P = .0002; compared with vehicle, both BDNF and TRAP, P > .05; compared with TRAP alone, TRAP + BDNF, P = .008), and ADP (D) (0.5 µM; repeated-measures ANOVA test, P = .03; compared with vehicle, both BDNF and ADP, P > .05; compared with ADP alone, ADP + BDNF, P = .07). Example trace and quantification of platelet aggregation in the presence of the BDNF-neutralizing antibody (mab#9) in response to 1 µg/mL collagen (E) (repeated-measures ANOVA, P < .0001; compared with vehicle, collagen alone and/or in presence of mab#9, P < .0001; compared with collagen alone, collagen in the presence of mab#9, P > .05), 10 µM arachidonic acid (F) (repeated-measures ANOVA, P < .0001; compared with vehicle, arachidonic acid alone and/or in the presence of mab#9, P < .0001; compared with arachidonic acid alone, arachidonic acid in the presence of mab#9, P > .05); 3 µM TRAP (G) (repeated-measures ANOVA, P < .0001; compared with vehicle, TRAP alone and/or in the presence of mab#9, P < .0001; compared with TRAP alone, TRAP in the presence of mab#9, P > .05); and 10 µM ADP (H) (repeated-measures ANOVA, P = .01; compared with vehicle, ADP alone, P < .0001; compared with ADP in the presence of mab#9, both vehicle and ADP alone, P > .05). Arrowheads indicate the time point at which the agonist was added. Data are presented as median and IQR.
Figure 3.
Figure 3.
Platelets express truncated TrkB receptors. (A) Immunoblotting of TrkB from human platelet lysates (100 µg for Sino Biological clone 7H6E7B3 and 25 µg for Abnova clone 3D12) obtained from 4 different healthy volunteers. TrkB-Fc fusion protein (5 ng; expected molecular weight, 120 kDa) and human cortex whole cell lysate (5 µg; expected molecular weight of truncated TrkB and the full-length TrkB receptor, 95- and 140-kDa, respectively) were used as positive controls. β-Actin was used a loading control. Two different antibodies (clone 7H6E7B3 and clone 3D12) targeting the extracellular domain of TrkB were used. Blots are representative of ≥3 independent experiments. (B) Confocal fluorescence microscopy of platelets expressing TrkB. Washed platelets, PBMCs, U251-MG cells, and HEPG2 cells were labeled with anti-TrkB primary antibodies and Alexa Fluor 488–conjugated secondary antibodies. Nuclei of PBMCs, U251-MG cells, and HEPG2 cells were stained with 4′,6-diamidino-2-phenylindole, and IgG2B/IgG1 was used as an isotype control. Images were visualized at room temperature with Zeiss LSM510 using a 100× objective lens for platelets and PBMCs, a 63× objective lens for HEPG2 cells, and a 20× objective lens for U251-MG cells as well as 3× magnification. Scale bar represents 5 µm for PBMCs and platelets, 10 µm for HEPG2 cells, and 200 µm for U251-MG cells. Images are representative of 3 independent experiments. (C) Flow cytometry of surface and intracellular TrkB on washed human platelets; platelets expressed TrkB on both their surface (TrkB+: 27% ± 11%, n = 8) and their intracellular compartment (TrkB+: 82% ± 9%, n = 6). PBMCs were used as positive controls for TrkB labeling on both the surface (TrkB+: 45% ± 15%, n = 4) and the intracellular compartment (TrkB+: 88% ± 6%, n = 4). U251-MG cells were used as positive controls for TrkB labeling on both the surface (TrkB+: 30% ± 2%, n = 3) and the intracellular compartment (TrkB+: 94% ± 2%, n = 3). IgG1/2B was used as isotype control. HEPG2 cells were used as TrkB-low controls for TrkB labeling on both the surface (TrkB+: 6% ± 0.12%, n = 2) and the intracellular compartment (TrkB+: 17% ± 1%, n = 2). FITC, fluorescein isothiocyanate.
Figure 4.
Figure 4.
Known ligands of TrkB induce platelet aggregation. Example trace (A) and quantification (B) of platelet aggregation in response to 370 nM BDNF, 370 nM NT4, 10 µg/ml TrkB-activating antibody (n = 7), and 370 nM β-NGF (n = 3). IgG1 was used as an isotype control (10 µg/mL). Repeated-measures ANOVA, P = .005; compared with vehicle, BDNF 370 nM P < .0001, NT4 370 nM P < .0001 and TrkB-activating antibody, P = .037. Arrowheads indicate the time point at which the agonist was added. Data are presented as median and IQR.
Figure 5.
Figure 5.
BDNF-induced aggregation activates a kinase-dependent pathway. (A) BDNF-induced platelet aggregation in the presence of TrkB kinase domain inhibitors (cyclotraxin B 50 µM and GNF5837 1 µM and 30 µM) as well as broad-spectrum kinase inhibitors (K252a 10 µM and PP2 10 µM). (B) Collagen at 1 µg/mL was used as control (n = 5). Repeated-measures ANOVA, P < .0001; compared with BDNF: no inhibition observed with cyclotraxin B 50 µM and GN5837 1 µM, P > .05; inhibition of BDNF with GNF5837 30 µM, P = .0025; inhibition with K252a 10 µM, P = .004; and inhibition with PP2 10 µM, P = .001. (C) BDNF-induced aggregation in the presence of SFK inhibitors (PRT318 10 µM and dasatinib 10 µM; n = 5). (D) Collagen at 1 µg/mL was used as control (n = 5). Repeated-measures ANOVA, P = .23; inhibition of BDNF with dasatinib 10 µM, P = .34; inhibition with PRT318 10 µM, P = .20. Data are presented as median and IQR.
Figure 6.
Figure 6.
BDNF-induced aggregation recruits Rho GTPase Rac1 and activates PKC and PI3K/Akt pathway. (A) BDNF-induced aggregation in the presence of Rho GTPase inhibitors (zoledronic acid 50 µM, NSC23766 10 µM, and Y27632 10 µM; n = 5). Repeated-measures ANOVA, P < .0001; inhibition of BDNF with zoledronic acid, P = .0002; inhibition with NSC23766, P = .005; and inhibition with Y27632, P = .53. (B) BDNF-induced phosphorylation of Akt, STAT3, and PLC-γ2 in the presence of Rho GTPase inhibitors (zoledronic acid 50 µM, NSC23766 10 µM, and Y27632 10 µM). (C) BDNF-induced aggregation in the presence of PI3K and PKC inhibitors (wortmannin 100 nM and BIM-1 10 µM, n = 5). Repeated-measures ANOVA, P < .0001; inhibition of BDNF with BIM-1, P < .0001, inhibition with wortmannin, P < .0001. (D) BDNF-induced phosphorylation of Akt, STAT3, and PLC-γ2 in the presence of PI3K and PKC inhibitors (wortmannin 100 nM and BIM-1 10 µM). (E) Quantification of BDNF-induced phosphorylation of Akt, STAT3, and PLC-γ2 in the presence of PI3K and PKC inhibitors (wortmannin 100 nM and BIM-1 10 µM). One-way ANOVA; compared with vehicle: phosphorylation of Akt by BDNF is increased (P < .05), and there is no significant difference in the presence of BIM-1 and wortmannin. Phosphorylation of STAT3 by BDNF is increased (P < .05) with BDNF in the presence of wortmannin (P < .05), and there is no significant difference with BIM-1. Phosphorylation of PLC-γ2 by BDNF in the presence of wortmannin, P < .05; no significant difference with BDNF alone or in the presence of BIM-1. Density was measured with ImageJ and is expressed as a ratio of density of phosphorylated protein/density of total protein and standardized to the vehicle control. Functional data and phosphoblots are representative of ≥3 independent experiments.
Figure 7.
Figure 7.
BDNF N187S and M189T variants influence platelet function. (A) Modeled structure of BDNF and NT4. BDNF is represented in green and NT4 in orange. The arrows represent the B-strands, and the coiled regions are represented by the thin lines. N187S and M189T are indicated on the 3D structure of BDNF and are located on loop III. (B) Family trees of the 2 families carrying the rare BDNF variants. (C) Immunoblotting of BDNF in platelet lysates of the 2 ASD families; 50 µg of protein was loaded in each well, and 2 healthy volunteers were used as controls. Integrin β3 was used as a loading control. For carriers of BDNF N187S variant, traces of platelet aggregation in response to 0.25 µg/mL and 1 µg/mL collagen are shown, as well as ATP release in response to 2 µg/mL collagen (D). (E) Traces of platelet aggregation as well as ATP release in response to 10 µM of ADP. For carriers of BDNF M189T variant, traces of platelet aggregation in response to 0.25 µg/mL and 1 µg/mL collagen are shown, as well as ATP release in response to 2 µg/mL collagen (F). (G) Traces of platelet aggregation as well as ATP release in response to 10 µM of ADP. The green band corresponds to the local normal reference range for ATP secretion (n = 40). Participants are color-coded; their maximal platelet aggregation (%) in platelet-rich plasma is indicated in the legend.

References

    1. Barde YA, Edgar D, Thoenen H.. Purification of a new neurotrophic factor from mammalian brain. EMBO J. 1982;1(5):549-*553. - PMC - PubMed
    1. Lu B, Pang PT, Woo NH.. The yin and yang of neurotrophin action. Nat Rev Neurosci. 2005;6(8):603-614. - PubMed
    1. Huang EJ, Reichardt LF.. Neurotrophins: roles in neuronal development and function. Annu Rev Neurosci. 2001;24(1):677-736. - PMC - PubMed
    1. Kowiański P, Lietzau G, Czuba E, Waśkow M, Steliga A, Moryś J.. BDNF: a key factor with multipotent impact on brain signaling and synaptic plasticity. Cell Mol Neurobiol. 2018;38(3):579-593. - PMC - PubMed
    1. Klein R, Conway D, Parada LF, Barbacid M.. The trkB tyrosine protein kinase gene codes for a second neurogenic receptor that lacks the catalytic kinase domain. Cell. 1990;61(4):647-656. - PubMed

Publication types

Substances

Grants and funding