. 2021 Sep 21;14(701):eabf3535.
doi: 10.1126/scisignal.abf3535. Epub 2021 Sep 21.

IKKβ-NF-κB signaling in adult chondrocytes promotes the onset of age-related osteoarthritis in mice

Affiliations

IKKβ-NF-κB signaling in adult chondrocytes promotes the onset of age-related osteoarthritis in mice

Sarah E Catheline et al. Sci Signal. .

Erratum in

Abstract

Canonical nuclear factor κB (NF-κB) signaling mediated by homo- and heterodimers of the NF-κB subunits p65 (RELA) and p50 (NFKB1) is associated with age-related pathologies and with disease progression in posttraumatic models of osteoarthritis (OA). Here, we established that NF-κB signaling in articular chondrocytes increased with age, concomitant with the onset of spontaneous OA in wild-type mice. Chondrocyte-specific expression of a constitutively active form of inhibitor of κB kinase β (IKKβ) in young adult mice accelerated the onset of the OA-like phenotype observed in aging wild-type mice, including degenerative changes in the articular cartilage, synovium, and menisci. Both in vitro and in vivo, chondrocytes expressing activated IKKβ had a proinflammatory secretory phenotype characterized by markers typically associated with the senescence-associated secretory phenotype (SASP). Expression of these factors was differentially regulated by p65, which contains a transactivation domain, and p50, which does not. Whereas the loss of p65 blocked the induction of genes encoding SASP factors in chondrogenic cells treated with interleukin-1β (IL-1β) in vitro, the loss of p50 enhanced the IL-1β–induced expression of some SASP factors. The loss of p50 further exacerbated cartilage degeneration in mice with chondrocyte-specific IKKβ activation. Overall, our data reveal that IKKβ-mediated activation of p65 can promote OA onset and that p50 may limit cartilage degeneration in settings of joint inflammation including advanced age.


Conflict of interest statement

Competing interests: The authors declare that they have no competing interests.

Figures

Fig. 1.
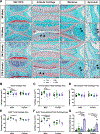
Fig. 1.. The knee joints of aged wild-type C57BL/6J mice have features of early-stage OA.
(A) Representative Safranin O (SAF O) and Fast Green (FG) staining of knee joint sections from male and female C57BL/6J mice at 3 and 27 months of age, as indicated. The images in the left column show low-magnification views of the entire joint; the higher magnification views show specific areas within the joint. Arrows point to loss of articular cartilage proteoglycan staining, meniscal chondrocytic metaplasia, and synovial hyperplasia. The images in the left column show low-magnification views of the entire joint; the higher magnification views show specific areas within the joint. Scale bars, 50μm. (B to D) Total (B), unmineralized (C), and mineralized (D) tibial articular cartilage areas of male and female C57BL/6J mice at 3 (N = 10 males; N = 9 females), 6 (N = 10 males; N = 9 females), 15 (N = 8 mice per group), and ≥24 (N = 11 males; N = 10 females) months of age, as indicated. (E and F) Safranin O–positive (SafO+) total (E) and unmineralized (F) tibial articular cartilage areas of male and female C57BL/6J mice at 3 (N = 5 mice per group), 6 (N = 5 mice per group), 15 (N = 3 mice per group), and ≥24 (N = 6 males; N = 5 females) months of age, as indicated. (G) Modified OARSI scores of male and female C57BL/6J mice 3 (N = 5 mice per group), 6 (N = 5 mice per group), 15 (N = 3 mice per group), and ≥24 (N = 6 males; N = 5 females) months of age, as indicated. All data are shown as mean ± SEM. *p < 0.05, **p < 0.01, ***p < 0.001, ****p < 0.0001 for comparisons within the same sex; two-way ANOVA followed by Tukey’s multiple comparisons test. #p < 0.05, ###p < 0.001 for comparisons between sexes of the same age; two-way ANOVA followed by Bonferroni’s multiple comparisons test.
Fig. 2.
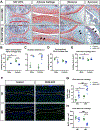
Fig. 2.. Articular chondrocyte death occurs throughout aging in the knee joints of wild-type C57BL/6J mice.
(A) Representative TUNEL staining of knee joint sections from male C57BL/6J mice at 3 and 27 months of age, as indicated. White dashed lines outline articular cartilage and meniscal surfaces. Scale bar, 50μm. (B) Quantification of TUNEL+ cells as a percentage of total cells and (C) the number of DAPI+ cells/mm2 in the tibial articular cartilage of male and female C57BL/6J mice at 3, 6, 15, and ≥24 months of age, as indicated (N = 6 mice per group). All data are shown as mean ± SEM. *p < 0.05, **p < 0.01, ***p < 0.001, ****p < 0.0001; two-way ANOVA followed by Tukey’s multiple comparisons test.
Fig. 3.
Fig. 3.. Knee joints from aged mice have enhanced cartilage catabolism and increased numbers of chondrocytes with active NF-κB signaling.
(A) Representative IHC for COL2A1, SOX9, COL10A1, and MMP13 in the articular cartilage of knee joint sections from 3-, 6-, 15-, and 27-month-old male C57BL/6J mice (N = 3–7 mice per group). Black arrows point to COL10A1 and MMP13 pericellular staining. Scale bars, 50μm. (B) Representative IHC for IκBα in the articular cartilage of knee joint sections from 3-, 6-, 15-, and 27-month-old male C57BL/6J mice (N = 4–5 mice per group). Scale bars, 50μm. (C) GFP fluorescence (shown with DAPI counterstain) on knee joint sections from 3- and 18-month-old NF-κB–GFP-luciferase (NGL) reporter mice, as indicated. White dashed lines outline the articular cartilage and meniscal surfaces; white arrows point to GFP+ cells. Scale bars, 50μm. (D and E) Quantification of GFP+ cells in the articular cartilage (D) and meniscus (E) of knee joints from NGL mice (N = 6 joints, 1 male and 5 female for 3-month-old group; N = 12 joints; 2 male and 10 female for 18-month-old group). Data are shown as mean ± SEM. ***p < 0.001, ****p < 0.0001; two-tailed unpaired Student’s t-test.
Fig. 4.
Fig. 4.. Chondrocyte-specific IKKβ activation accelerates the onset of age-related early-stage OA phenotypes.
(A) Representative Safranin O (SAF O) and Fast Green (FG) staining of knee joint sections from R26Ikk2ca/Ikk2ca (Control) and AcanCreERT2/+; R26Ikk2ca/Ikk2ca (IKKβ GOF) at 8 months of age (6 months following tamoxifen administration). The images in the left column show low-magnification views of the entire joint; the higher magnification views show specific areas within the joint. Arrows point to loss of articular cartilage proteoglycan staining, meniscal chondrocytic metaplasia, and synovial hyperplasia. Scale bars, 50μm. (B to E) Safranin O–positive (SafO+) unmineralized tibial articular cartilage area (B), modified OARSI scores (C), unmineralized tibial articular cartilage area (D), and total tibial articular cartilage area (E) of male and female control and IKKβ GOF mice, as indicated (N = 4 mice for male control group, N = 3 mice for male IKKβ GOF group, N = 5 mice for female control group, N = 6 mice for female IKKβ GOF group). (F) Representative TUNEL staining of knee joint sections from control and IKKβ GOF mice at 3 and 8 months of age, as indicated. White dashed lines outline articular cartilage and meniscal surfaces. Scale bars, 50μm. (G and H) Quantification of TUNEL+ cells as a percentage of total cells (G) and DAPI+ cell numbers/mm2 (H) in the tibial articular cartilage of control and IKKβ GOF mice at 3 months of age (N = 3 males and 3 females for control group; N = 3 males and 4 females for IKKβ GOF group) and 8 months of age (N = 3 males and 3 females for control group; N = 3 males and 3 females for IKKβ GOF group), as indicated. All data are shown as mean ± SEM. *p < 0.05, **p < 0.01, ***p < 0.001, ****p < 0.0001 for comparisons within the same sex (B, C, D) or age (G, H); #p < 0.05, ###p < 0.001, ####p < 0.0001 for comparisons between sexes (B, E) or ages (G, H) of the same genotype; two-way ANOVA followed by Tukey’s multiple comparisons test.
Fig. 5.
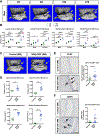
Fig. 5.. Aging or chondrocyte-specific IKKβ GOF promotes mineralization of the menisci and synovial hyperplasia.
(A) Representative micro-CT images from 3-, 6-, 15-, and 27-month-old male C57BL/6J mice. Yellow arrows point to mineralized meniscal compartments. Scale bars, 500μm. (B) Mineralized volumes of the lateral anterior, lateral posterior, medial anterior, and medial posterior meniscal compartments quantified from the micro-CT scans of 3-, 6-, 15-, and 27-month-old male and female C57BL/6J mice as indicated (N = 5 mice per group). Data are shown as mean ± SEM. *p < 0.05, **p < 0.01, ***p < 0.001, ****p < 0.0001 for comparisons within the same sex; two-way ANOVA followed by Tukey’s multiple comparisons test. #p < 0.05, ##p < 0.01 for comparisons between sexes at the same age; two-way ANOVA followed by Bonferroni’s multiple comparisons test. (C) Representative micro-CT images from control and IKKβ GOF mice at 8 months of age (6 months following tamoxifen administration). Yellow arrows point to mineralized meniscal compartments. Scale bars, 500μm. (D) Mineralized volumes of the lateral anterior, lateral posterior, medial anterior, and medial posterior meniscal compartments quantified from the micro-CT scans of 8-month-old control and IKKβ GOF mice, as indicated (N = 3 males and 3 females for control group; N = 2 males and 5 females for IKKβ GOF group). Data are shown as mean ± SEM. **p < 0.01, ***p < 0.001, ****p < 0.0001; two-tailed unpaired Student’s t-test. (E) Representative IHC and quantification of Ki-67+ cells in the entire synovium of representative tissue sections from 8-month-old (6 months following tamoxifen administration) control and IKKβ GOF mice (N = 3 males and 5 females for control group; N = 3 males and 7 females for IKKβ GOF group). Arrows point to Ki-67+ cells. Scale bar, 50μm. (F) Representative IHC and quantification of CD45+ area as a percentage of total area in the synovium of 8-month-old control and IKKβ GOF mice (N = 3 males and 5 females for control group; N = 2 males and 7 females for IKKβ GOF group). Scale bar, 50μm Data are shown as mean ± SEM. *p < 0.05; two-tailed unpaired Student’s t-test. p = 0.0532 for CD45+ area (G).
Fig. 6.
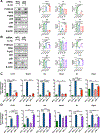
Fig. 6.. IKKβ GOF in chondrocytes results in increased expression and secretion of proinflammatory cytokines, chemokines, and MMPs.
(A) Representative Western blotting for the indicated proteins in lysates from sternal chondrocytes isolated from R26Ikk2ca/Ikk2ca mice, infected with adenovirus encoding GFP or Cre (MOI 100), and harvested two days later. β-actin is a loading control. (B) Imaging and quantification of staining intensity in spots for the indicated proteins from an array of antibodies to mouse cytokines and chemokines. The antibodies were spotted in duplicate and incubated with conditioned media from R26Ikk2ca/Ikk2ca sternal chondrocytes infected with adenovirus encoding GFP or Cre (MOI 100) two days before harvesting. Quantification data represent relative pixel intensities and are presented as mean ± SD. (C) Relative expression of the indicated genes as determined by RT-qPCR with mRNA isolated from R26Ikk2ca/Ikk2ca sternal chondrocytes infected with adenovirus encoding GFP or Cre (MOI 100) and harvested three days later (N = 3 biological replicates per group). Data are shown as mean ± SEM. *p < 0.05, **p < 0.01, ****p < 0.0001; two-tailed unpaired Student’s t-test. (D) Representative IHC for CCL20 and MMP13 and quantification of CCL20+ and MMP13+ area as a percentage of total area within the tibial articular cartilage of 3-month-old (1 month following tamoxifen administration) control and IKKβ GOF mice (N = 1 male and 2 females for control group; N = 1 male and 2 females for IKKβ GOF group). Yellow and red boxes are high magnification images of the indicated regions within the adjacent images taken at lower magnification. Scale bars, 50μm. Quantification Data are shown as mean ± SEM. *p < 0.05; two-tailed unpaired Student’s t-test.
Fig. 7.
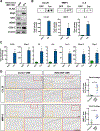
Fig. 7.. Loss of Rela or Nfkb1 differentially affects proinflammatory cytokine, chemokine, and MMP gene expression in response to IL-1β.
(A and B) Representative Western blot images and quantification of the indicated proteins from ATDC5 cells transfected with non-targeting control (NTC) siRNA or siRNA targeting Rela (p65) (A) or Nfkb1 (p50) (B) before treatment with vehicle or IL-1β. Quantification is represented as a ratio of the indicated protein relative to β-actin (N = 3 independent samples). (C and D) Relative expression of the indicated genes as determined by RT-qPCR with mRNA isolated from ATDC5 cells transfected with non-targeting control (NTC) siRNA or siRNA targeting Rela (p65) (C) or Nfkb1 (p50) (D) then treated with vehicle or IL-1β (n = 3 independent samples). Data are shown as mean ± SEM. *p < 0.05, **p < 0.01, ***p < 0.001, ****p < 0.0001; one-way ANOVA followed by Tukey’s multiple comparisons test.
Fig. 8.
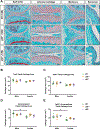
Fig. 8.. Nfkb1 deletion alone does not affect the knee joint phenotypes of middle-aged mice.
(A) Representative Safranin O (SAF O) and Fast Green (FG) staining of knee joint sections from wild-type (WT), Nfkb+/− (p50+/−), and Nfkb−/− (p50−/−) mice at 12 months of age. The images in the left column show low-magnification views of the entire joint; the higher magnification views show specific areas within the joint. Scale bars, 50μm. (B to E) Total (B), Safranin O–positive (SafO+) total (C), unmineralized (D), and SafO+ unmineralized (E) tibial articular cartilage areas in knee joints from male and female WT (N = 4 males; N = 4 females), p50+/− (N = 5 males; N = 5 females), and p50−/− (N = 3 males; N = 4 females) mice at 12 months of age, as indicated. All data are shown as mean ± SEM. #p < 0.05 for comparisons between sexes of the same genotype; two-way ANOVA followed by Bonferroni’s multiple comparisons test. Two-way ANOVA followed by Tukey’s multiple comparisons test was performed for comparisons within the same sex.
Fig. 9.
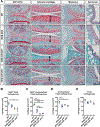
Fig. 9.. Nfkb1 deletion exacerbates the age-related OA knee joint phenotype in chondrocyte-specific IKKβ GOF mice.
(A) Representative Safranin O (SAF O) and Fast Green (FG) staining of knee joint sections from control (Cre-negative; Nfkb1+/+, WT), AcanCreERT2/+; R26Ikk2ca/Ikk2ca (IKKβ GOF), AcanCreERT2/+; R26Ikk2ca/Ikk2ca; Nfkb1+/− (IKKβ GOF/p50+/−) and AcanCreERT2/+; R26Ikk2ca/Ikk2ca; Nfkb1−/− (IKKβ GOF/p50−/−) mice at 8 months of age (6 months following tamoxifen administration). The images in the left column show low-magnification views of the entire joint; the higher magnification views show specific areas within the joint. Arrows span from the articular cartilage surface to the chondro-osseous junction of the subchondral bone. Scale bars, 50μm. (B to E), Safranin O–positive (SafO+) total (B), SafO+ unmineralized (C), unmineralized (D), and total (E) tibial articular cartilage areas in WT, IKKβ GOF, IKKβ GOF/p50+/−, and IKKβ GOF/p50−/− mice, as indicated (N = 1 male and 2 females for WT group; N = 4 females for IKKβ GOF group; N = 2 males and 1 female for IKKβ GOF/p50+/− group; N = 1 male and 2 females for IKKβ GOF/p50−/− group). Data are shown as mean ± SEM. *p < 0.05, **p < 0.01, ***p < 0.001, ****p < 0.0001; one-way ANOVA followed by Tukey’s multiple comparisons test.

References

    1. Cross M, Smith E, Hoy D, Nolte S, Ackerman I, Fransen M, Bridgett L, Williams S, Guillemin F, Hill CL, Laslett LL, Jones G, Cicuttini F, Osborne R, Vos T, Buchbinder R, Woolf A, March L, The global burden of hip and knee osteoarthritis: estimates from the global burden of disease 2010 study. Ann Rheum Dis 73, 1323–1330 (2014); published online EpubJul (10.1136/annrheumdis-2013-204763). - DOI - PubMed
    1. Loeser RF, Goldring SR, Scanzello CR, Goldring MB, Osteoarthritis: a disease of the joint as an organ. Arthritis Rheum 64, 1697–1707 (2012); published online EpubJun (10.1002/art.34453). - DOI - PMC - PubMed
    1. Loeser RF, Collins JA, Diekman BO, Ageing and the pathogenesis of osteoarthritis. Nature reviews. Rheumatology 12, 412–420 (2016); published online EpubJul (10.1038/nrrheum.2016.65). - DOI - PMC - PubMed
    1. Adler AS, Sinha S, Kawahara TL, Zhang JY, Segal E, Chang HY, Motif module map reveals enforcement of aging by continual NF-kappaB activity. Genes Dev 21, 3244–3257 (2007); published online EpubDec 15 (10.1101/gad.1588507). - DOI - PMC - PubMed
    1. Tilstra JS, Clauson CL, Niedernhofer LJ, Robbins PD, NF-kappaB in Aging and Disease. Aging and disease 2, 449–465 (2011). - PMC - PubMed

Publication types