

The maternal blood lipidome is indicative of the pathogenesis of severe preeclampsia
- PMID: 34547287
- PMCID: PMC8503628
- DOI: 10.1016/j.jlr.2021.100118
The maternal blood lipidome is indicative of the pathogenesis of severe preeclampsia
Abstract
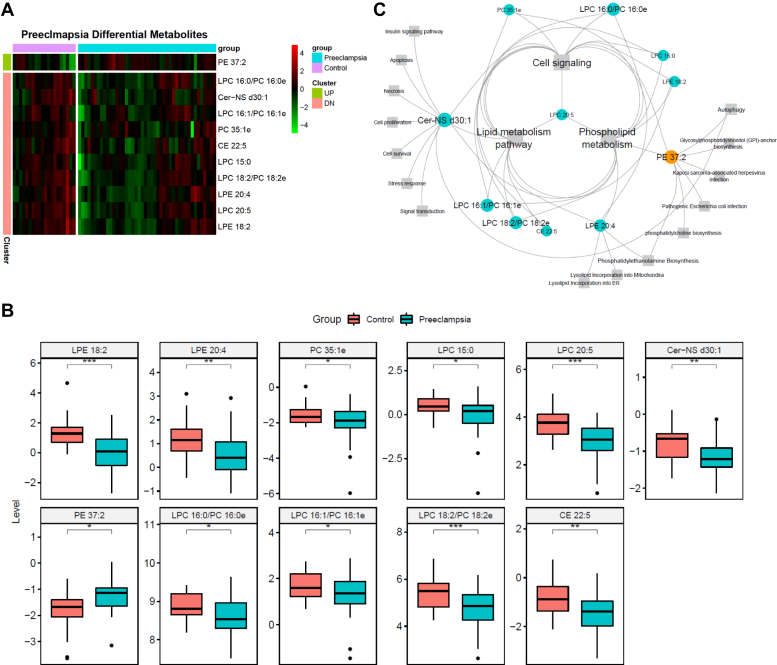
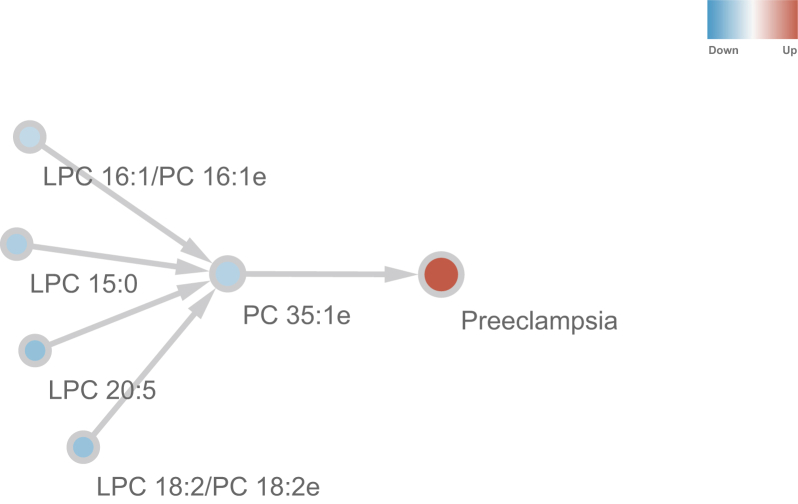
Preeclampsia is a pregnancy-specific syndrome characterized by hypertension and proteinuria after 20 weeks of gestation. However, it is not well understood what lipids are involved in the development of this condition, and even less is known how these lipids mediate its formation. To reveal the relationship between lipids and preeclampsia, we conducted lipidomic profiling of maternal sera of 44 severe preeclamptic and 20 healthy pregnant women from a multiethnic cohort in Hawaii. Correlation network analysis showed that oxidized phospholipids have increased intercorrelations and connections in preeclampsia, whereas other lipids, including triacylglycerols, have reduced network correlations and connections. A total of 10 lipid species demonstrate significant changes uniquely associated with preeclampsia but not any other clinical confounders. These species are from the lipid classes of lysophosphatidylcholines, phosphatidylcholines (PCs), cholesteryl esters, phosphatidylethanolamines, lysophosphatidylethanolamines, and ceramides. A random forest classifier built on these lipids shows highly accurate and specific prediction (F1 statistic = 0.94; balanced accuracy = 0.88) of severe preeclampsia, demonstrating their potential as biomarkers for this condition. These lipid species are enriched in dysregulated biological pathways, including insulin signaling, immune response, and phospholipid metabolism. Moreover, causality inference shows that various PCs and lysophosphatidylcholines mediate severe preeclampsia through PC 35:1e. Our results suggest that the lipidome may play a role in the pathogenesis and serve as biomarkers of severe preeclampsia.
Keywords: biomarker; classification; hypertension; lipidomics; machine learning; maternal blood; metabolomics; pathway; preeclampsia; pregnancy.
Copyright © 2021 The Authors. Published by Elsevier Inc. All rights reserved.
Conflict of interest statement
Conflict of interest The authors declare that they have no conflicts of interest with the contents of this article.
Figures


References
-
- Saleem S., McClure E.M., Goudar S.S., Patel A., Esamai F., Garces A., Chomba E., Althabe F., Moore J., Kodkany B., Pasha O., Belizan J., Mayansyan A., Derman R.J., Hibberd P.L., Global Network Maternal Newborn Health Registry Study, Investigators A prospective study of maternal, fetal and neonatal deaths in low- and middle-income countries. Bull. World Health Organ. 2014;92:605–612. - PMC - PubMed
-
- Raymond D., Peterson E. A critical review of early-onset and late-onset preeclampsia. Obstet. Gynecol. Surv. 2011;66:497–506. - PubMed
-
- Souza J.P., Gulmezoglu A.M., Vogel J., Carroli G., Lumbiganon P., Qureshi Z., Costa M.J., Fawole B., Mugerwa Y., Nafiou I., Neves I., Wolomby-Molondo J.J., Bang H.T., Cheang K., Chuyun K. Moving beyond essential interventions for reduction of maternal mortality (the WHO Multicountry Survey on Maternal and Newborn Health): a cross-sectional study. Lancet. 2013;381:1747–1755. - PubMed
-
- Leon L.J., McCarthy F.P., Direk K., Gonzalez-Izquierdo A., Prieto-Merino D., Casas J.P., Chappell L. Preeclampsia and cardiovascular disease in a large UK Pregnancy Cohort of linked electronic health records: A CALIBER Study. Circulation. 2019;140:1050–1060. - PubMed
Publication types
MeSH terms
Substances
Grants and funding
- U01 DK097430/DK/NIDDK NIH HHS/United States
- R01 LM012907/LM/NLM NIH HHS/United States
- R01 LM012595/LM/NLM NIH HHS/United States
- R01 DK109365/DK/NIDDK NIH HHS/United States
- R01 HD084633/HD/NICHD NIH HHS/United States
- Wellcome Trust/United Kingdom
- K01 ES025434/ES/NIEHS NIH HHS/United States
- U01 CA200147/CA/NCI NIH HHS/United States
- U01 CA198941/CA/NCI NIH HHS/United States
- U19 AI090023/AI/NIAID NIH HHS/United States
- R01 HL108735/HL/NHLBI NIH HHS/United States
- R01 HL106579/HL/NHLBI NIH HHS/United States
- R01 LM012373/LM/NLM NIH HHS/United States
LinkOut - more resources
Full Text Sources
