

doi: 10.1249/JES.0000000000000267.
Bioenergetic Mechanisms Linking V˙O2 Kinetics and Exercise Tolerance
Affiliations
- PMID: 34547760
- PMCID: PMC8528340
- DOI: 10.1249/JES.0000000000000267
Item in Clipboard
Bioenergetic Mechanisms Linking V˙O2 Kinetics and Exercise Tolerance
Exerc Sport Sci Rev.
.
Abstract
We hypothesize that the V˙O2 time constant (τV˙O2) determines exercise tolerance by defining the power output associated with a "critical threshold" of intramuscular metabolite accumulation (e.g., inorganic phosphate), above which muscle fatigue and work inefficiency are apparent. Thereafter, the V˙O2 "slow component" and its consequences (increased pulmonary, circulatory, and neuromuscular demands) determine performance limits.
Copyright © 2021 by the American College of Sports Medicine.
Figures
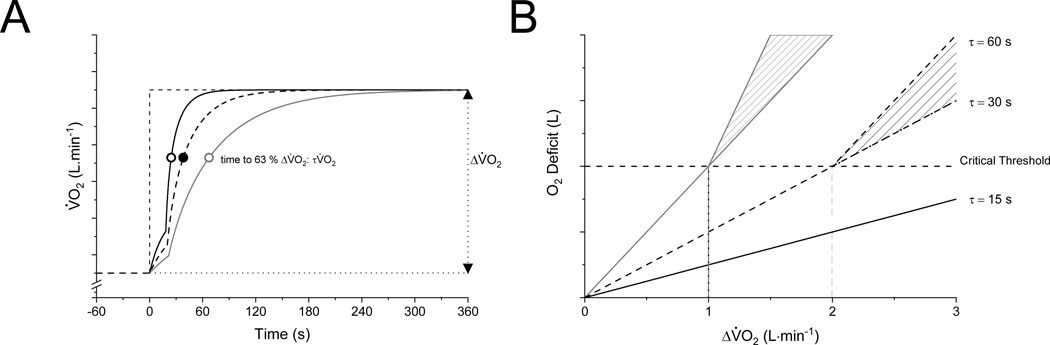
Schematic representation of: (A) the kinetic V̇O2 response to a moderate-intensity constant-power output test with different values of τV̇O2; and (B) the corresponding interdependent relationship between ΔV̇O2 (AṪP) and τV̇O2 in determining the size of the O2 deficit below (solid line) and above (hatched area) a critical threshold of intramuscular metabolite accumulation. The hatched areas above represent the duration and amplitude dependent changes in ATP demand and V̇O2 for a given constant power exercise. Fast V̇O2 kinetics (τV̇O2 = 15 s) allow high ΔV̇O2 to be achieved in a steady state (below the O2 deficit associated with the critical threshold). Slower V̇O2 kinetics (τV̇O2 = 30 s or 60 s) will result in attaining the O2 deficit associated with the critical threshold at a lower ΔV̇O2 (or power output) (see text for additional details).
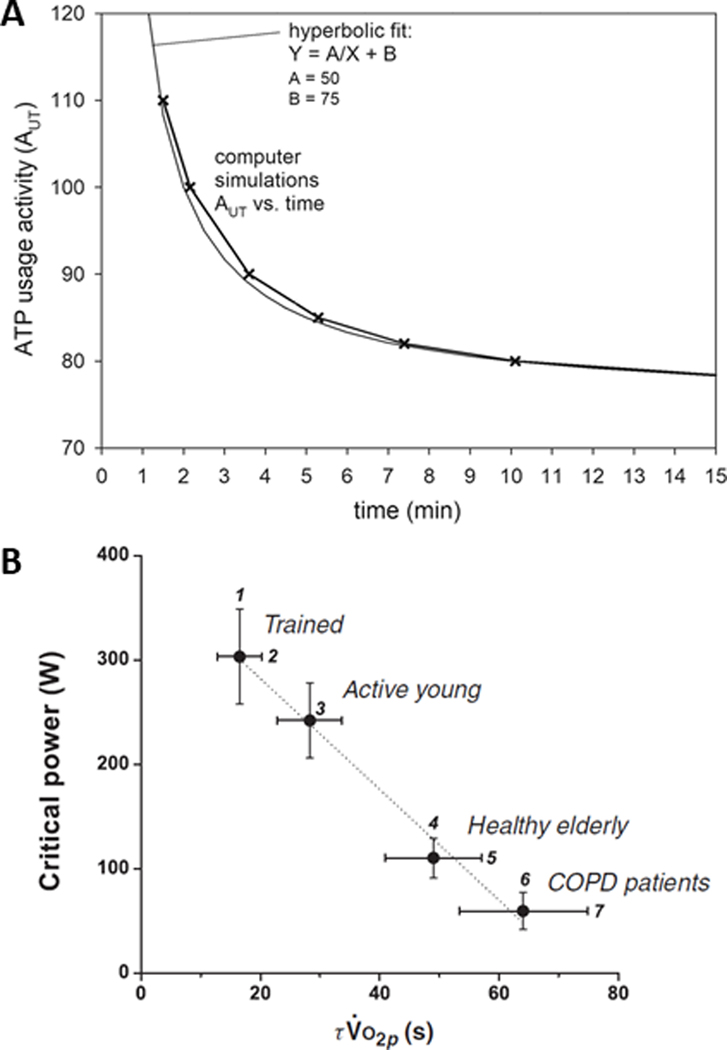
A: Simulated relationship between ATP usage activity (AUT) (herein termed AṪP) and the tolerable duration of exercise. One AUT unit corresponds roughly to 3 watts of power output. A hyperbolic fit of the simulated AUT–duration relationship is also shown. The asymptote of this hyperbola is (Parameter B = 75; the critical ATP usage activity) corresponds approximately to critical power (CP) of 222 W of total mechanical power or 210 W of external power. The curvature constant (Parameter A = 50) corresponds to the total work available above CP before intolerance, i.e. W’. Reproduced with permission from (6). B: Critical power (CP) as a function of the fundamental phase pulmonary oxygen uptake kinetics time constant (τV̇O2p) during cycle ergometry across populations differing in aerobic function. The figure is derived from 35 reports published between 1982 and 2008. Reproduced with permission from (3).
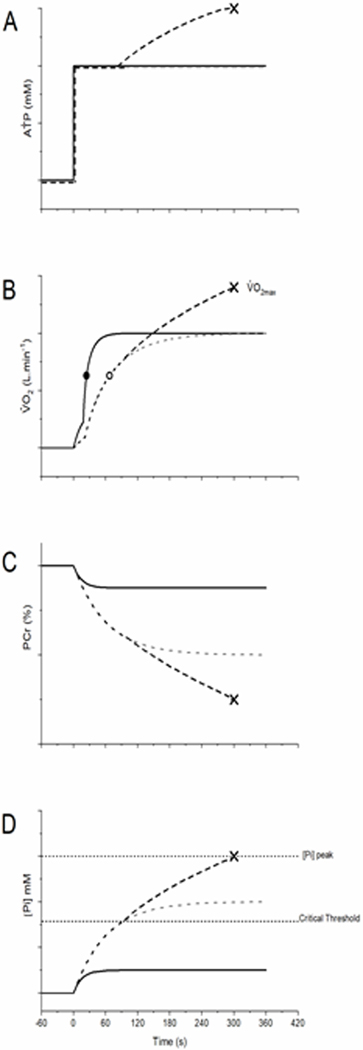
A schematic of the AṪP (A), V̇O2 (B), PCr (C) and [Pi] responses for participants with fast (τV̇O2 = 15 s; solid line) and slow V̇O2 kinetics (τV̇O2 = 60 s; dashed line). For a given AṪP, a steady-state is achieved rapidly in all variables with a small τV̇O2. The greater rate of O2 deficit accumulation associated with a large τV̇O2 leads to increased PCr depletion and Pi accumulation, to the extent that Pi accumulation (and other muscle metabolites, not shown) exceeds a critical threshold. Exceeding the critical threshold induces fatigue, which generates inefficiency and increases AṪP for a given power output. This initiates a positive feedback loop where increased AṪP, causes increased metabolite accumulation, which causes increased fatigue, which causes further increased AṪP, and so on until peak limits are reached (indicated by X). Stimulation of oxidative phosphorylation by metabolite accumulation above the critical threshold results in an increase in the O2 cost of the exercise, development of the V̇O2SC, and eventual attainment of V̇O2max.
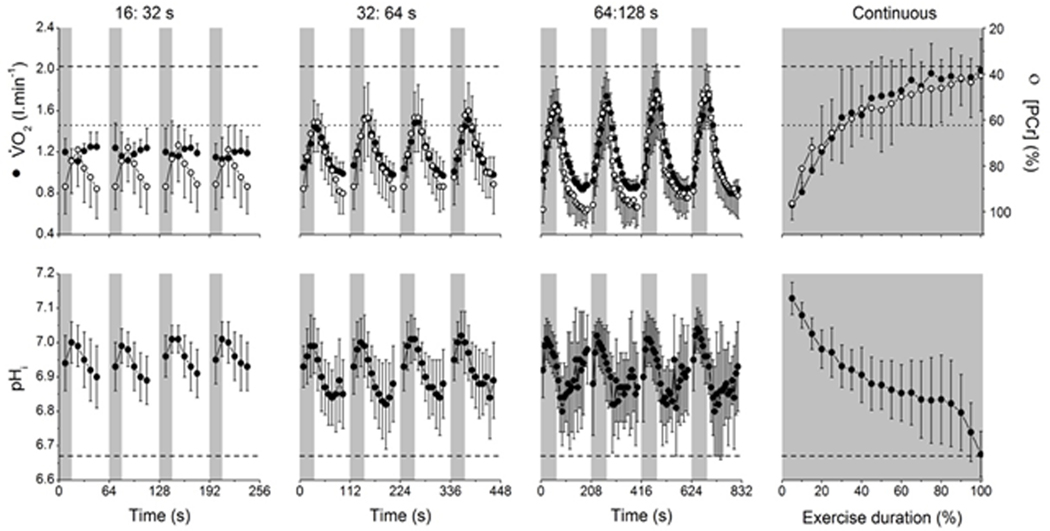
V̇O2 (filled circles, top row), PCr (clear circles, top row) and intramuscular pH (pHi; bottom row) responses to work:recovery durations of 16:32 s (first column), 32:64 s (second column), 64:128 s (third column) or continuous exercise (fourth column) at an external work rate corresponding to 110% peak incremental test power. Lactate threshold (LT) from the ramp incremental test is shown by the dotted line (top row), as is V̇O2 max (top row, dashed line) and pHi at task failure from the continuous exercise protocol (bottom row, dashed line). Note that during the 16:32 s protocol, V̇O2 never exceeds the LT and the fluctuations in pHi and PCr are small, i.e. consistent with moderate intensity exercise. The peak V̇O2 amplitude exceeds the LT in the 32:64 and 64:128 s intermittent protocols and during continuous exercise, and this is accompanied by a metabolic acidosis (decline in pHi), consistent with a greater metabolic strain in these protocols. Reproduced with permission from (66).
Comment in
-
V˙O2 On-Kinetics-Critical Power Relationship: Correlation But Not Direct Causal Link.Exerc Sport Sci Rev. 2022 Apr 1;50(2):104. doi: 10.1249/JES.0000000000000286. Exerc Sport Sci Rev. 2022. PMID: 35275896 No abstract available.
-
Response.Exerc Sport Sci Rev. 2022 Apr 1;50(2):105-106. doi: 10.1249/JES.0000000000000285. Exerc Sport Sci Rev. 2022. PMID: 35275897 Free PMC article. No abstract available.
References
-
- Grassi B, Porcelli S, Salvadego D, Zoladz JA. Slow VO₂ kinetics during moderate-intensity exercise as markers of lower metabolic stability and lower exercise tolerance. Eur J Appl Physiol. 2011. March;111(3):345–55. - PubMed
-
- Rossiter HB. Exercise: Kinetic Considerations for Gas Exchange. In: Comprehensive Physiology [Internet]. John Wiley & Sons, Inc.; 2010. Available from: http://onlinelibrary.wiley.com/doi/10.1002/cphy.c090010/abstract - DOI - PubMed
-
- Murgatroyd SR, Ferguson C, Ward SA, Whipp BJ, Rossiter HB. Pulmonary O2 uptake kinetics as a determinant of high-intensity exercise tolerance in humans. Journal of Applied Physiology. 2011. June 1;110(6):1598–606. - PubMed
