. 2022 Mar 8;6(5):1381-1393.
doi: 10.1182/bloodadvances.2021004615.

Sickle cell disease promotes sex-dependent pathological bone loss through enhanced cathepsin proteolytic activity in mice

Affiliations

Sickle cell disease promotes sex-dependent pathological bone loss through enhanced cathepsin proteolytic activity in mice

Jada Selma et al. Blood Adv. .

Abstract

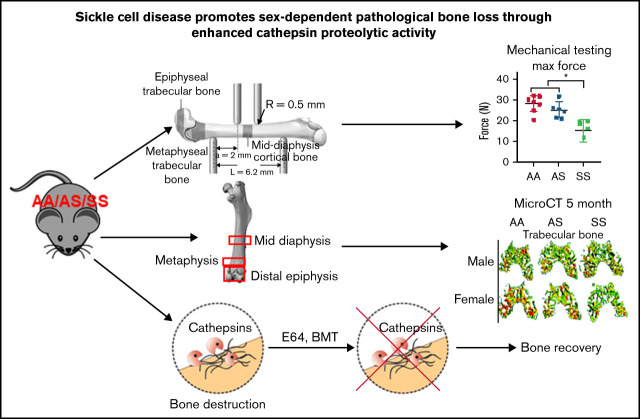
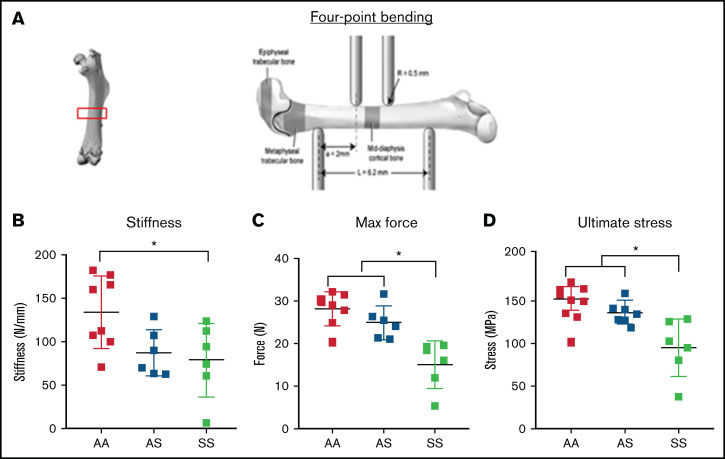
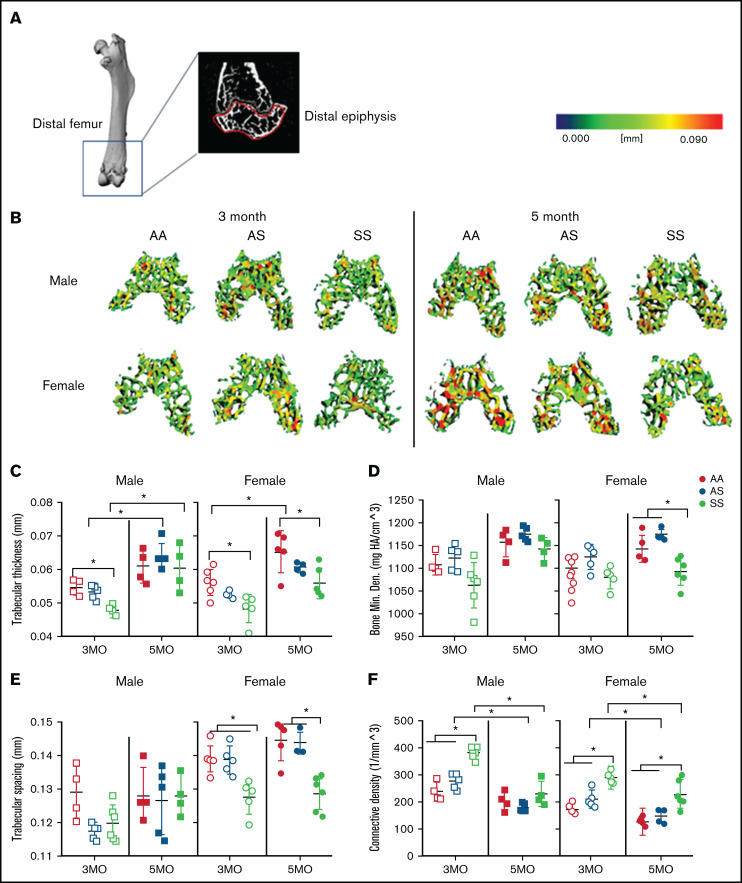
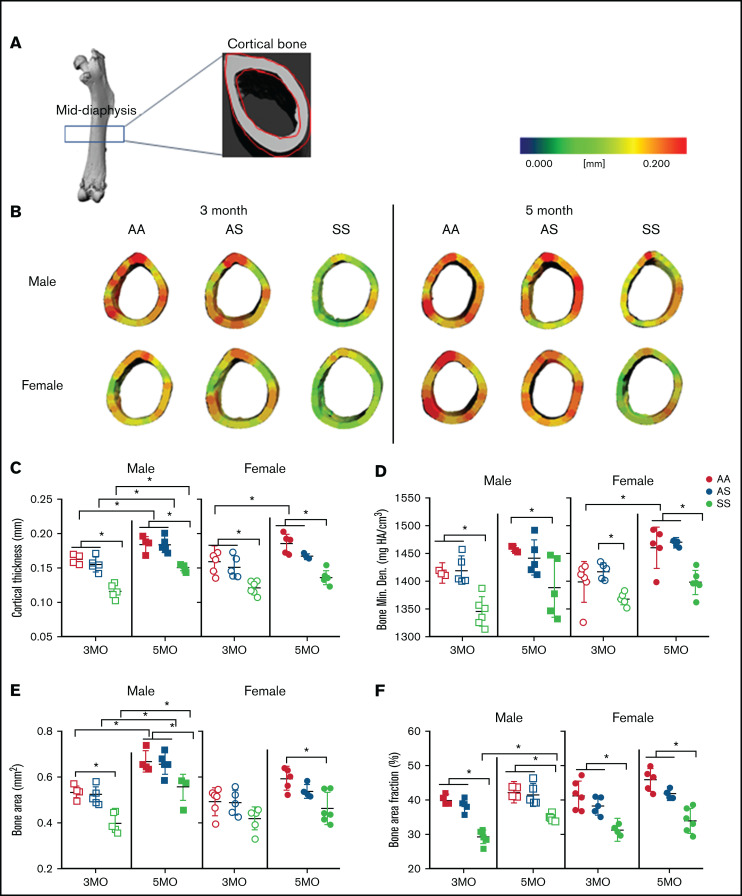
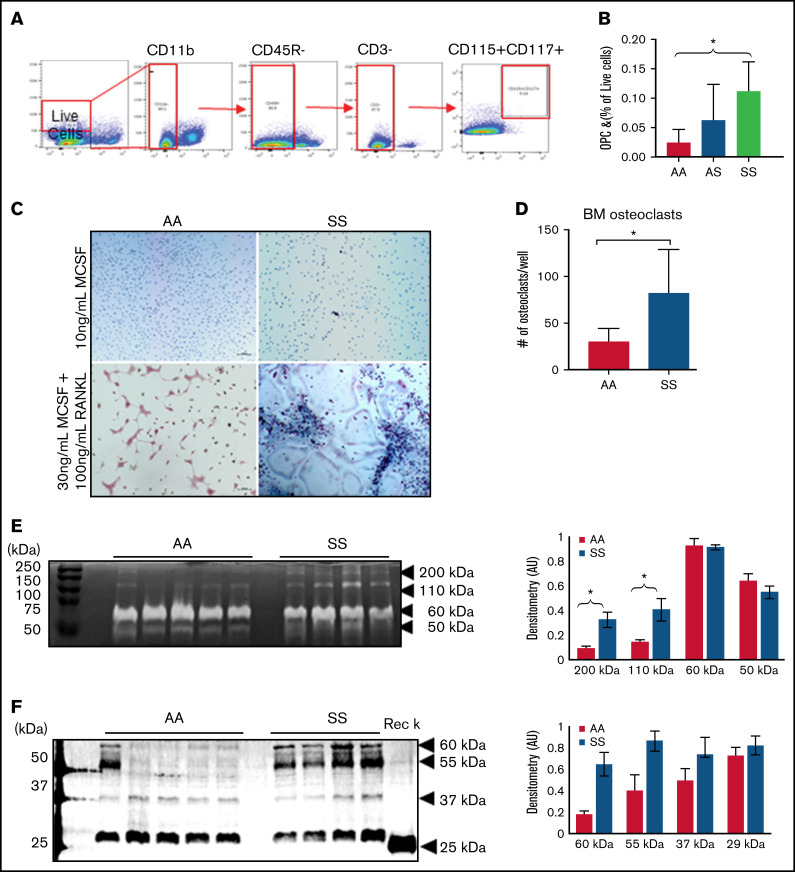
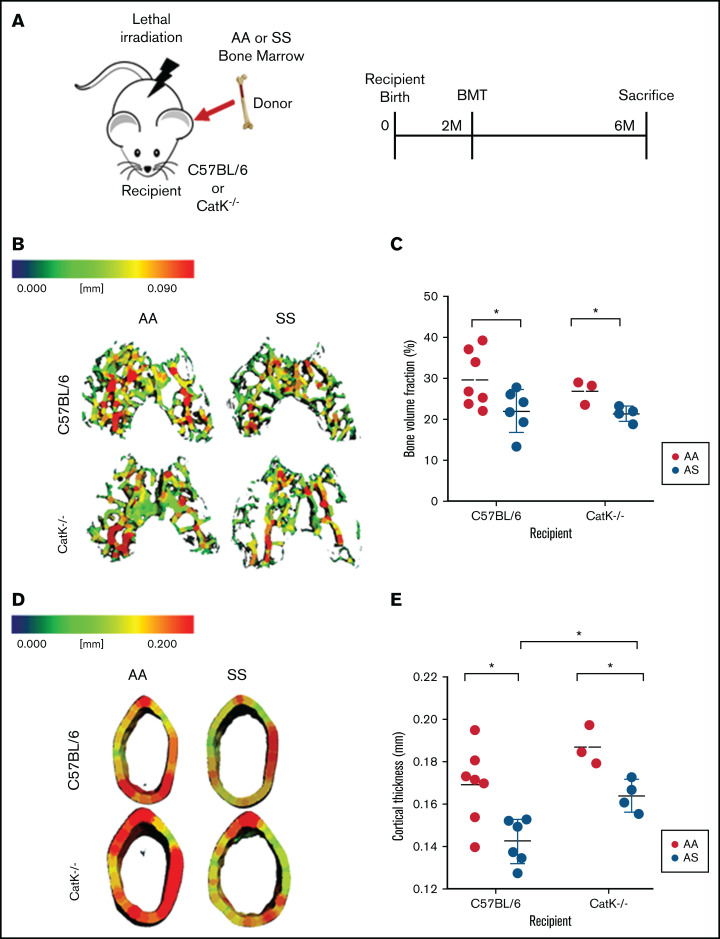
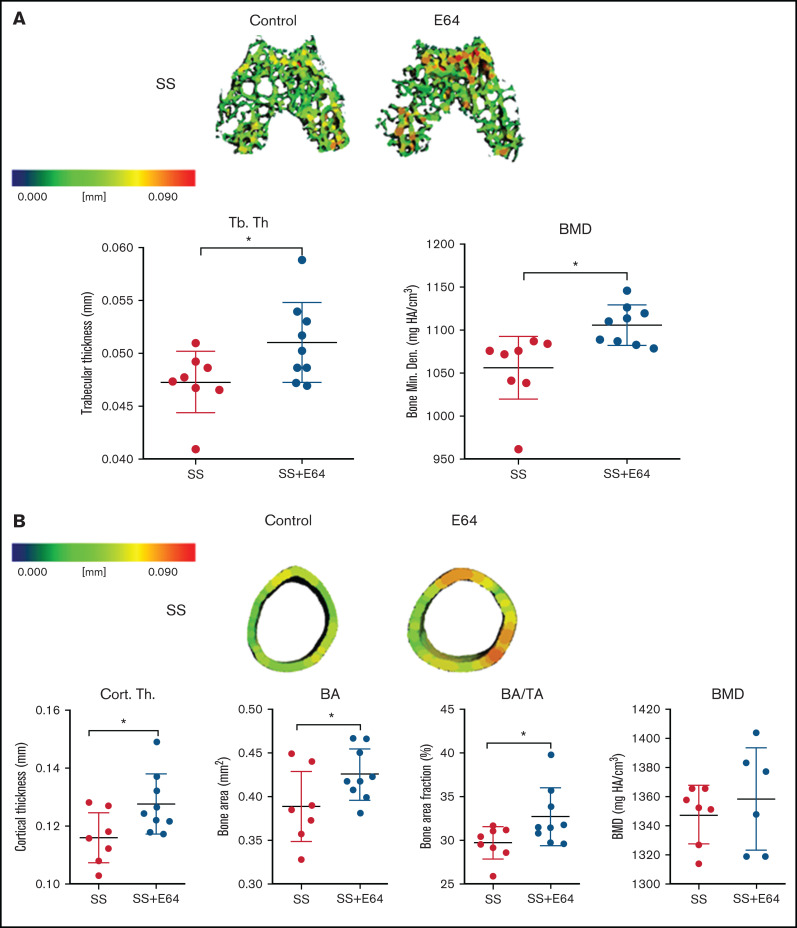
Sickle cell disease (SCD) is the most common hereditary blood disorder in the United States. SCD is frequently associated with osteonecrosis, osteoporosis, osteopenia, and other bone-related complications such as vaso-occlusive pain, ischemic damage, osteomyelitis, and bone marrow hyperplasia known as sickle bone disease (SBD). Previous SBD models have failed to distinguish the age- and sex-specific characteristics of bone morphometry. In this study, we use the Townes mouse model of SCD to assess the pathophysiological complications of SBD in both SCD and sickle cell trait. Changes in bone microarchitecture and bone development were assessed by using high-resolution quantitative micro-computed tomography and the three-dimensional reconstruction of femurs from male and female mice. Our results indicate that SCD causes bone loss and sex-dependent anatomical changes in bone. SCD female mice in particular are prone to trabecular bone loss, whereas cortical bone degradation occurs in both sexes. We also describe the impact of genetic knockdown of cathepsin K- and E-64-mediated cathepsin inhibition on SBD.


Figures

None
Graphical abstract
Figure 1.
Figure 1.
Bone mechanical testing parameters generated by 4-point bending technique in 3-month-old AA, AS, and SS mice. *P < .05, determined by two-way ANOVA with Tukey’s post hoc test, n = 4-6 mice per group, scale bar 100 μm. (A) Schematic diagram of 4-point bending mechanical testing on femoral cortical bone. Based on displacement and force measurement graph and geometry obtained from microCT imaging, stiffness (B) and ultimate stress (D) were calculated, and maximum force (C) were compared (n = 6-8 mice per group).
Figure 2.
Figure 2.
Sex-specific differences in SCD-mediated reduction of trabecular bone in distal epiphysis of mice at 3 and 5 months. (A) Representative microCT image of an entire femoral bone, including a microCT scan of the distal femur with the distal epiphysis outlined in red. (B) Representative three-dimensional heat maps of trabecular morphology in the epiphyseal region of the distal femur in AA, AS, and SS in 3-month-old (left) and 5-month-old (right) male and female mice. A pseudocolor scale of blue (0 mm) to red (0.09 mm) depicts trabecular thickness. Trabecular bone parameters generated by microCT scans include: trabecular thickness (C); BMD (D); trabecular spacing (E); and connective density (F). AA = black, AS = gray, SS = red. Data are expressed as mean ± standard deviation. Statistical significance, *P < .05, determined by two-way analysis of variance with Tukey’s post hoc test; n = 4 to 6 mice per group; scale bar, 100 μm. Bone Min. Den., BMD; HA, hydroxyapatite.
Figure 3.
Figure 3.
SCD mediates reduced cortical bone thickness in male and female mice. (A) Representative microCT image of an entire femoral bone, including a microCT scan of the mid-diaphysis outlined in red. (B) Representative three-dimensional heat maps of cortical thickness in the mid-diaphyseal region in AA, AS, and SS of 3-month-old (left) and 5-month-old (right) male and female mice. A pseudocolor scale of blue (0 mm) to red (0.2 mm) depicts cortical thickness. Cortical bone parameters generated by microCT scans for male and female mice include: cortical thickness (C); BMD (D); BA (E); and BA/TA (F). AA = black, AS = gray, SS = red. Data are expressed as mean ± standard deviation. Statistical significance, *P < .05, determined by two-way analysis of variance with Tukey’s post hoc test; n = 4 to 6 mice per group; scale bar, 100 μm. Bone Min. Den., BMD; HA, hydroxyapatite.
Figure 4.
Figure 4.
BM osteoclast progenitors are increased in SCD and produce increased amounts of active catK. (A) Flow cytometry identification of OPCs in the BM by gating for cells, live cells, CD11b, CD45R/B220, CD3, and finally CD117+/CD115+ cells. (B) Quantification of OPC percentage of live cells in the BM of AA, AS, and SS mice (n = 5-8 mice per group). Data are expressed as mean ± standard deviation. Statistical significance, *P < .05, determined by one-way analysis of variance with Tukey’s post hoc test. (C) Representative images of BM cells from AA and SS mice treated with either 10 ng/mL M-CSF or 30 ng/mL M-CSF + 100 ng/mL RANKL for 21 days. Osteoclasts were determined as tartrate-resistant acid phosphatase–positive (pink) with at least 3 nuclei (blue). (D) Quantified number of osteoclasts per well (n = 4 mice and 8 wells per group). (E) Representative cathepsin zymograms of AA and SS osteoclasts. Active protein appears as white bands. Densitometry quantification of 200 kDa, 110 kDa, 60 kDa, and 50 kDa bands of active cathepsins in AA and SS osteoclasts (n = 4 mice per group). (F) Representative western blots of catK protein in AA and SS osteoclasts. Recombinant catK was used as a positive control. Densitometry quantification of 60 kDa, 55 kDa, 37 kDa, and 25 kDa bands of catK protein in AA and SS osteoclasts (n = 4-5 mice per group). AA = black, SS = red. Data are expressed as mean ± standard deviation. Statistical significance, *P < .05, determined by Welch’s t test. AU, arbitrary unit.
Figure 5.
Figure 5.
Absence of catK partially mitigates bone loss in SS BM chimeras. (A) Schematic and timeline of BMT studies. (B) Representative three-dimensional heat maps of trabecular morphology in the epiphysis region of the distal femur in C57BL/6 (top) and catK−/− (bottom) that were reconstituted with AA or SS BM. A pseudocolor scale of blue (0 mm) to red (0.09 mm) depicts trabecular thickness. (C) Trabecular BV/TV in the epiphyseal region generated by microCT imaging. AA BM = black; SS BM = red. (D) Representative three-dimensional heat maps of cortical thickness in the mid-diaphyseal region in C57BL/6 (top) and catK−/−(bottom) that were reconstituted with AA or SS BM. A pseudocolor scale of blue (0 mm) to red (0.2 mm) depicts cortical thickness. (E) Cortical thickness in the mid-diaphyseal region generated by microCT analysis. Data are expressed as mean ± standard deviation. Statistical significance, *P < .05, determined by multiple Student t tests with Holm-Šidák’s post hoc test; n = 3 to 7 mice per group; scale bar, 100 μm.
Figure 6.
Figure 6.
Two months of E-64 treatment of SS mice from 1 to 3 months of age shows increased trabecular and cortical bone thickness when analyzed at 3 months of age. (A) Representative three-dimensional heat maps of the epiphyseal region in SS 3-month-old mice administered saline or E-64 for 2 months, beginning at 1 month of age. A pseudocolor scale of blue (0 mm) to red (0.2 mm) depicts trabecular thickness. Trabecular bone parameters of trabecular thickness and BMD generated by microCT scans. (B) Representative three-dimensional heat maps of the mid-diaphyseal region in SS 3-month-old mice administered saline or E-64 for 2 months. A pseudocolor scale of blue (0 mm) to red (0.2 mm) depicts cortical thickness. Cortical bone parameters of cortical thickness, BA, BA/TA, and BMD generated by microCT scans. Data are expressed as mean ± standard deviation. Statistical significance, * P < .05, scale bar, E-64 or saline treated mice compared via t test. SS = black, SS with E-64 = red (n = 6-9 mice per group). Bone Min. Den., BMD; HA, hydroxyapatite.

References

    1. Hassell KL. Population estimates of sickle cell disease in the U.S. Am J Prev Med. 2010;38(4 Suppl):S512-S521. - PubMed
    1. Piel FB, Hay SI, Gupta S, Weatherall DJ, Williams TN. Global burden of sickle cell anaemia in children under five, 2010-2050: modelling based on demographics, excess mortality, and interventions. PLoS Med. 2013;10(7):e1001484. - PMC - PubMed
    1. Chiang EY, Frenette PS. Sickle cell vaso-occlusion. Hematol Oncol Clin North Am. 2005;19(5):771-784. - PubMed
    1. Aguilar C, Vichinsky E, Neumayr L. Bone and joint disease in sickle cell disease. Hematol Oncol Clin North Am. 2005;19(5):929-941. - PubMed
    1. Kosaraju V, Harwani A, Partovi S, et al. . Imaging of musculoskeletal manifestations in sickle cell disease patients. Br J Radiol. 2017;90(1073):20160130. - PMC - PubMed

Publication types