

Transcriptome profiling of Malus sieversii under freezing stress after being cold-acclimated
- PMID: 34548013
- PMCID: PMC8456659
- DOI: 10.1186/s12864-021-07998-0
Transcriptome profiling of Malus sieversii under freezing stress after being cold-acclimated
Abstract
Background: Freezing temperatures are an abiotic stress that has a serious impact on plant growth and development in temperate regions and even threatens plant survival. The wild apple tree (Malus sieversii) needs to undergo a cold acclimation process to enhance its freezing tolerance in winter. Changes that occur at the molecular level in response to low temperatures are poorly understood in wild apple trees.
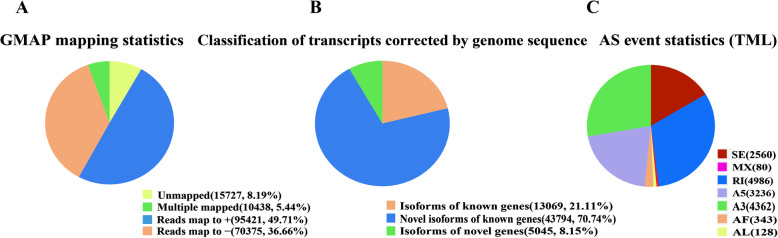
Results: Phytohormone and physiology profiles and transcriptome analysis were used to elaborate on the dynamic response mechanism. We determined that JA, IAA, and ABA accumulated in the cold acclimation stage and decreased during freezing stress in response to freezing stress. To elucidate the molecular mechanisms of freezing stress after cold acclimation, we employed single molecular real-time (SMRT) and RNA-seq technologies to study genome-wide expression profiles in wild apple. Using the PacBio and Illumina platform, we obtained 20.79G subreads. These reads were assembled into 61,908 transcripts, and 24,716 differentially expressed transcripts were obtained. Among them, 4410 transcripts were differentially expressed during the whole process of freezing stress, and these were examined for enrichment via GO and KEGG analyses. Pathway analysis indicated that "plant hormone signal transduction", "starch and sucrose metabolism", "peroxisome" and "photosynthesis" might play a vital role in wild apple responses to freezing stress. Furthermore, the transcription factors DREB1/CBF, MYC2, WRKY70, WRKY71, MYB4 and MYB88 were strongly induced during the whole stress period.
Conclusions: Our study presents a global survey of the transcriptome profiles of wild apple trees in dynamic response to freezing stress after two days cold acclimation and provides insights into the molecular mechanisms of freezing adaptation of wild apple plants for the first time. The study also provides valuable information for further research on the antifreezing reaction mechanism and genetic improvement of M. sieversii after cold acclimation.
Keywords: Freezing stress; Malus sieversii; Photosynthesis; Plant hormone signal transduction; Sugar and starch metabolism; Transcription factor.
© 2021. The Author(s).
Conflict of interest statement
The authors declare that they have no competing interests.
Figures


Similar articles
-
PacBio full-length transcriptome of wild apple (Malus sieversii) provides insights into canker disease dynamic response.BMC Genomics. 2021 Jan 14;22(1):52. doi: 10.1186/s12864-021-07366-y. BMC Genomics. 2021. PMID: 33446096 Free PMC article.
-
Global transcriptome profiles of Camellia sinensis during cold acclimation.BMC Genomics. 2013 Jun 22;14:415. doi: 10.1186/1471-2164-14-415. BMC Genomics. 2013. PMID: 23799877 Free PMC article.
-
Full-length transcriptome profiling reveals insight into the cold response of two kiwifruit genotypes (A. arguta) with contrasting freezing tolerances.BMC Plant Biol. 2021 Aug 11;21(1):365. doi: 10.1186/s12870-021-03152-w. BMC Plant Biol. 2021. PMID: 34380415 Free PMC article.
-
Gene Regulatory Networks Mediating Cold Acclimation: The CBF Pathway.Adv Exp Med Biol. 2018;1081:3-22. doi: 10.1007/978-981-13-1244-1_1. Adv Exp Med Biol. 2018. PMID: 30288701 Review.
-
Cold acclimation by the CBF-COR pathway in a changing climate: Lessons from Arabidopsis thaliana.Plant Cell Rep. 2019 May;38(5):511-519. doi: 10.1007/s00299-019-02376-3. Epub 2019 Jan 16. Plant Cell Rep. 2019. PMID: 30652229 Free PMC article. Review.
Cited by
-
Bolstered plant tolerance to low temperatures by overexpressing NAC transcription factors: identification of critical variables by meta-analysis.Planta. 2022 Oct 1;256(5):92. doi: 10.1007/s00425-022-04007-w. Planta. 2022. PMID: 36181642
-
Long-term cold, freezing and drought: overlapping and specific regulatory mechanisms and signal transduction in tea plant (Camellia sinensis (L.) Kuntze).Front Plant Sci. 2023 May 10;14:1145793. doi: 10.3389/fpls.2023.1145793. eCollection 2023. Front Plant Sci. 2023. PMID: 37235017 Free PMC article.
-
A phylotranscriptomic dataset of angiosperm species under cold stress.Sci Data. 2023 Jun 22;10(1):399. doi: 10.1038/s41597-023-02307-8. Sci Data. 2023. PMID: 37349352 Free PMC article.
-
Transcriptome profiling of Bergenia purpurascens under cold stress.BMC Genomics. 2023 Dec 7;24(1):754. doi: 10.1186/s12864-023-09850-z. BMC Genomics. 2023. PMID: 38062379 Free PMC article.
-
DIA-Based Quantitative Proteomics in the Flower Buds of Two Malus sieversii (Ledeb.) M. Roem Subtypes at Different Overwintering Stages.Int J Mol Sci. 2024 Mar 4;25(5):2964. doi: 10.3390/ijms25052964. Int J Mol Sci. 2024. PMID: 38474210 Free PMC article.
References
-
- Yan G, Long H, Song W, Chen R. Genetic polymorphism of Malus sieversii populations in Xinjiang. China Genetic Res Crop Evol. 2008;55(1):171–181. doi: 10.1007/s10722-007-9226-5. - DOI
-
- Wang Z-H, et al. Characterization of CBF1, CBF2, CBF3, and CBF4 genes of Malus sieversii and analysis of their expression in different habitats. Eur J Hortic Sci. 2017;82(2):81–89. doi: 10.17660/eJHS.2017/82.2.3. - DOI
-
- Levitt J. 1980. Responses of plants to environmental stresses. New York: academic. 2nd ed.
MeSH terms
LinkOut - more resources
Full Text Sources
