. 2021 Sep 21;19(1):208.
doi: 10.1186/s12915-021-01126-w.

Thermal modulation of Zebrafish exploratory statistics reveals constraints on individual behavioral variability

Affiliations

Thermal modulation of Zebrafish exploratory statistics reveals constraints on individual behavioral variability

Guillaume Le Goc et al. BMC Biol. .

Abstract

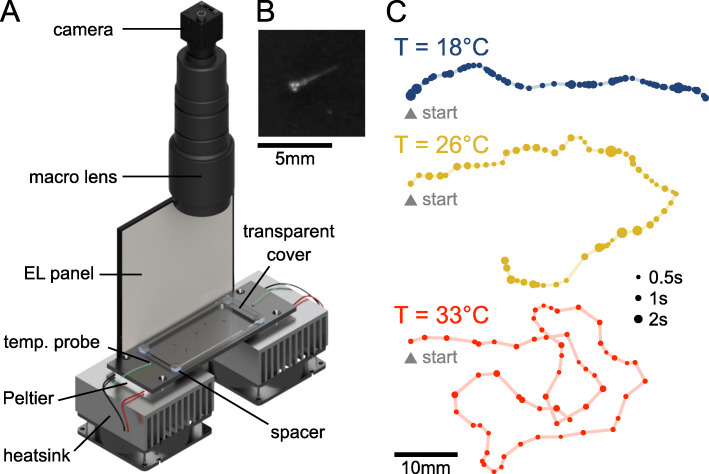
Background: Variability is a hallmark of animal behavior. It contributes to survival by endowing individuals and populations with the capacity to adapt to ever-changing environmental conditions. Intra-individual variability is thought to reflect both endogenous and exogenous modulations of the neural dynamics of the central nervous system. However, how variability is internally regulated and modulated by external cues remains elusive. Here, we address this question by analyzing the statistics of spontaneous exploration of freely swimming zebrafish larvae and by probing how these locomotor patterns are impacted when changing the water temperatures within an ethologically relevant range.

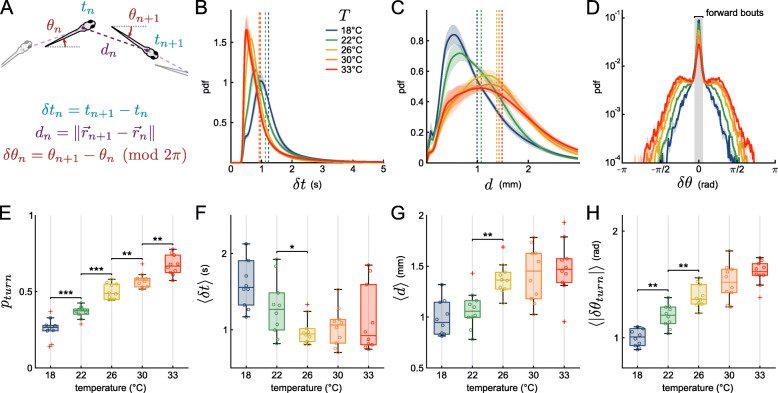
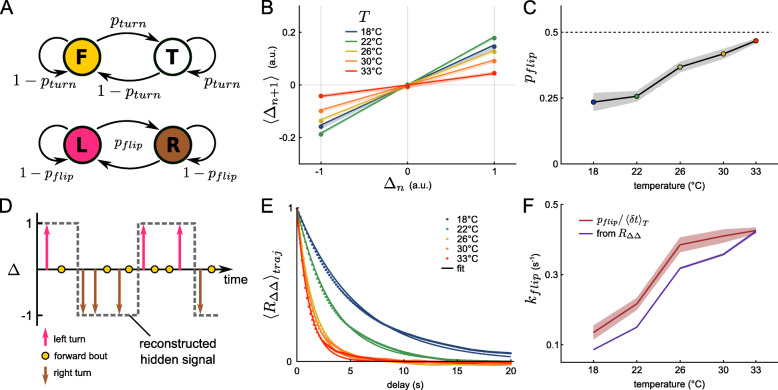
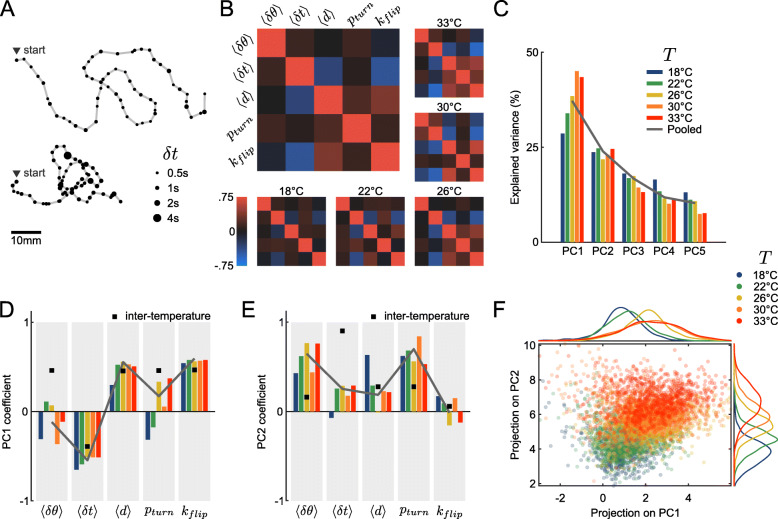
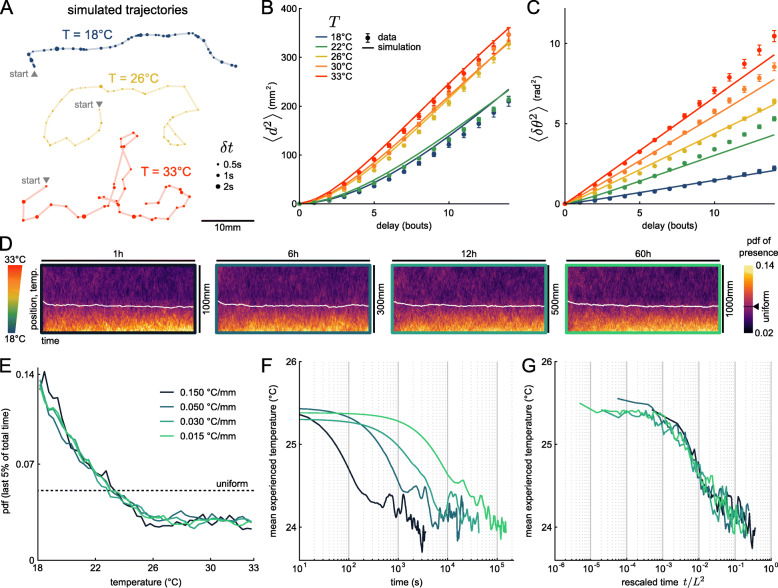
Results: We show that, for this simple animal model, five short-term kinematic parameters - interbout interval, turn amplitude, travelled distance, turn probability, and orientational flipping rate - together control the long-term exploratory dynamics. We establish that the bath temperature consistently impacts the means of these parameters, but leave their pairwise covariance unchanged. These results indicate that the temperature merely controls the sampling statistics within a well-defined kinematic space delineated by this robust statistical structure. At a given temperature, individual animals explore the behavioral space over a timescale of tens of minutes, suggestive of a slow internal state modulation that could be externally biased through the bath temperature. By combining these various observations into a minimal stochastic model of navigation, we show that this thermal modulation of locomotor kinematics results in a thermophobic behavior, complementing direct gradient-sensing mechanisms.

Conclusions: This study establishes the existence of a well-defined locomotor space accessible to zebrafish larvae during spontaneous exploration, and quantifies self-generated modulation of locomotor patterns. Intra-individual variability reflects a slow diffusive-like probing of this space by the animal. The bath temperature in turn restricts the sampling statistics to sub-regions, endowing the animal with basic thermophobicity. This study suggests that in zebrafish, as well as in other ectothermic animals, ambient temperature could be used to efficiently manipulate internal states in a simple and ethological way.

Keywords: Behavior; Locomotion; Navigation; Thermokinesis; Variability; Zebrafish.


Conflict of interest statement

The authors declare that they have no competing interests.

Figures

Fig. 1.
Fig. 1.
Behavioral assay for the video-monitoring of spontaneous navigation of zebrafish larvae at different temperatures. A Sketch view of the setup: Larval zebrafish are freely swimming in a rectangular pool connected to a pair of Peltier modules in a light-tight box. The setup is illuminated with a white electroluminescent (EL) panel and a symmetrically positioned a mirror (not shown). The tank is covered with a transparent slide to limit evaporation. A CMOS camera records images at 25 frames/second. B Blow-up of a raw image around a larva. C Example trajectories extracted offline from movies recorded at different temperatures. Each dot represents a bout event, with size encoding the time spent at this location
Fig. 2.
Fig. 2.
Effects of bath temperature on spontaneous navigation. A Sketch defining three kinematic parameters. δtn is the time elapsed between bout n and bout n+1, known as the interbout interval. The displacement dn is the distance traveled during bout n (in mm), while δθn represents the reorientation angle. A small value around 0 corresponds essentially to a forward swim, while a large positive value (resp. negative) corresponds to a left (resp. right) turn. Per-batch averaged distributions of interbout intervals (B), displacements (C) and turn angles (D) for each tested temperatures. Vertical dotted lines are the means of the distributions, shaded areas are standard errors of the mean (s.e.m.). The gray area in D marks the forward events versus the turn events. EH Boxplots of selected parameters. Each dot corresponds to a batch of 10 fish, the box spans the 25th to the 75th percentiles, the horizontal line is the median, red crosses are outliers. Significance given only for neighboring boxes (Kruskal-Wallis test, no star indicates p>0.05,p<0.05,⋆⋆p<0.01,⋆⋆⋆p<0.001). E Fraction of turns, referred to as the turning probability, defined as the ratio of turn bouts over the total number of bouts. F Means of the interbout intervals. G Means of the displacements. H Means of the absolute reorientation amplitude of turning bouts
Fig. 3.
Fig. 3.
The orientational dynamics is temperature-dependent. A Two discrete and independent Markov chains describe the reorientation dynamics. The first one (top) selects the bout type, either turn (T) or forward (F), given the transition rate pturn, while the second one (bottom) determines if the fish is in the left (L) or right (R) state with a transition rate denoted pflip. B Mean ternarized reorientation Δ of the next bout, given the current bout reorientation. Shaded area is the sem, solid line is the fit (Eq. 1). C Temperature dependence of pflip. The dashed line at 0.5 indicates a memoryless process. D Schematic representing a motion sequence generated by the two discrete Markov chains. The hidden underlying orientational signal that sets the left/right state of the fish is exposed only when the fish performs a turning bout and can be estimated (dashed line) for each trajectory. E Trajectory-averaged autocorrelation function of Δ (RΔΔ) and associated fit (Eq. 2). F Temperature dependence of kflip, extracted from two methods: pflip divided by the mean interbout interval associated with each temperature (red, shaded area is the s.e.m.) and from the fit of the autocorrelation function (purple, error bar 95% confidence interval)
Fig. 4.
Fig. 4.
Correlations between parameters are conserved across temperatures. A Two qualitatively different trajectories recorded at the same temperature (30 C). B Pearson’s correlation matrices of the average reorientation angle δθ, interbout interval δt and displacement d, along with the turning probability pturn and flipping rate kflip defined for each trajectory, at different temperatures. Large panel: average over all temperatures. C Variance explained by each principal component of a PCA performed on each intra-temperature feature matrix. D, E Coefficients of the principal components for intra-temperature matrices (colors), for the inter-temperature averaged matrix (black square) and for the pooled per-temperature array (solid line). D First principal component (PC1), E second principal component (PC2). F All per-trajectory values projected into the principal component space (first two PCs), and their associated marginal distributions for each principal vector
Fig. 5.
Fig. 5.
Diffusive-like exploration of the behavioral manifold for individual fish. A Two qualitatively different trajectories from the same fish at the same temperature (26 C), recorded at 1h interval. B, C Coefficients of the two first principal components for 18 different fish (one color corresponds to one fish). The solid line is the PC coefficients computed from the multi-fish experiments as shown in Fig. 4E and F. D Time-evolution of the projections in the 2D PCA space from an example fish. One dot corresponds to one trajectory whose parameters are projected on the multi-fish PC space. Color encodes the time at which the trajectory starts. Arrows show trajectories represented in A with the same color. Autocorrelation function of the projections on E PC1 and F PC2, averaged across fish. Gray area is the standard error of the mean. Red line is the autocorrelation function of a simulated Ornstein–Uhlenbeck process whose bias parameter (1/τ) is fitted to the data
Fig. 6.
Fig. 6.
Simulations indicate that zebrafish does not need gradient information to perform negative thermotaxis. A Example trajectories generated with a simulation based on rescaled multivariate distributions (see “Methods” section). B Mean square displacement, from data (dots) and simulation (line). C Mean square reorientation, from data (dots) and simulation (line). D Distributions of presence of simulated fish through time, for four strengths of temperature gradient. The white curve is the average position over time. The expected value for a uniform distribution is highlighted on the colormap. E Steady-state distribution of presence as a function of temperature. The dashed line is the expected value for an uniform distribution. F Temporal evolution of the average position over time (only the first 75 bins are shown for readability). G Distribution mean as a function of the time rescaled by the squared pool length

References

    1. Shaw AK. Causes and consequences of individual variation in animal movement. Mov Ecol. 2020;8(1):12. doi: 10.1186/s40462-020-0197-x. - DOI - PMC - PubMed
    1. Marques JC, Li M, Schaak D, Robson DN, Li JM. Internal state dynamics shape brainwide activity and foraging behaviour. Nature. 2020;577(7789):239–43. doi: 10.1038/s41586-019-1858-z. - DOI - PubMed
    1. Gillespie JH. Natural selection for whithin-generation variance in offspring number. Genetics. 1974;76(3):601–6. doi: 10.1093/genetics/76.3.601. - DOI - PMC - PubMed
    1. Philippi T, Seger J. Hedging one’s evolutionary bets, revisited. Trends Ecol Evol. 1989;4(2):41–44. doi: 10.1016/0169-5347(89)90138-9. - DOI - PubMed
    1. Lovett-Barron M, Andalman AS, Allen WE, Vesuna S, Kauvar I, Burns VM, Deisseroth K. Ancestral circuits for the coordinated modulation of brain state. Cell. 2017;171(6):1411–142317. doi: 10.1016/j.cell.2017.10.021. - DOI - PMC - PubMed

Publication types

LinkOut - more resources