. 2021 Oct;31(10):1913-1926.
doi: 10.1101/gr.273300.120. Epub 2021 Sep 21.

A single-cell tumor immune atlas for precision oncology

Affiliations

A single-cell tumor immune atlas for precision oncology

Paula Nieto et al. Genome Res. 2021 Oct.

Abstract

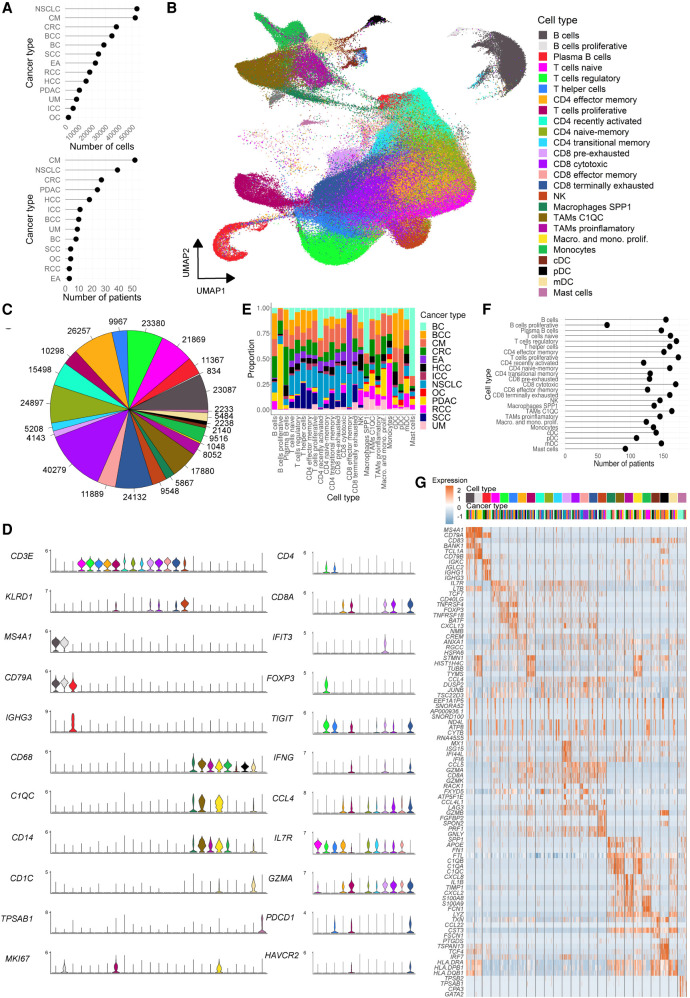
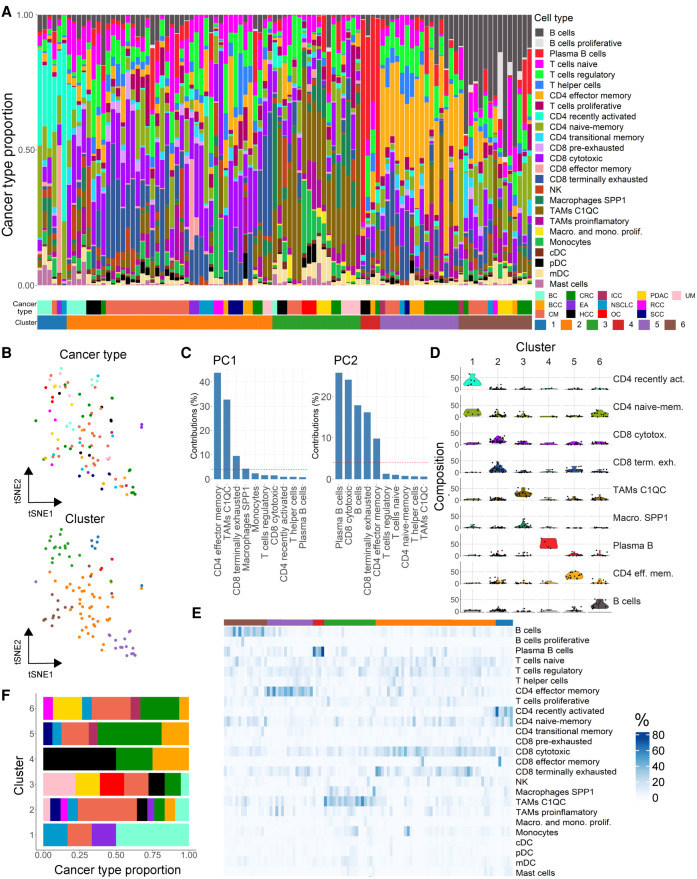
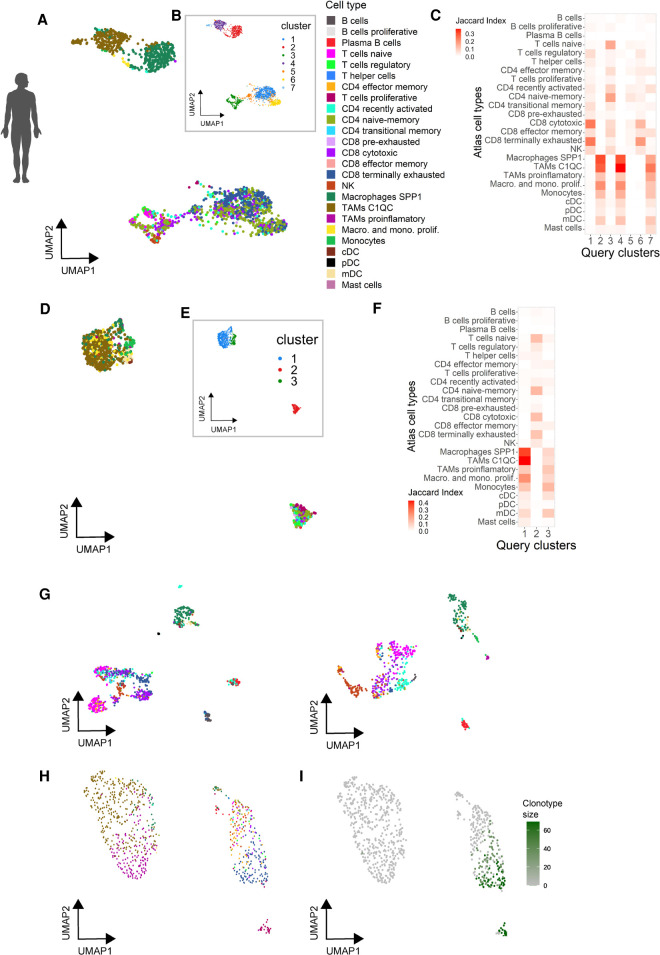
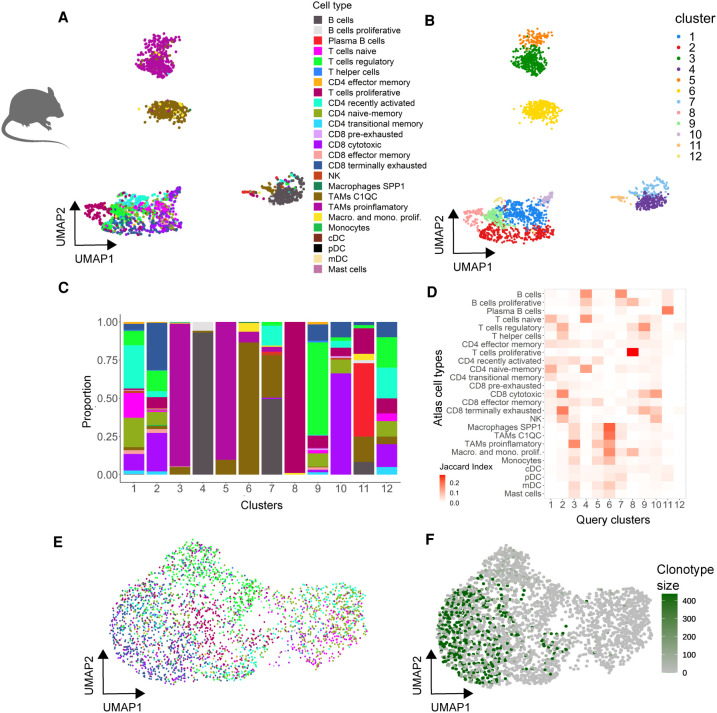
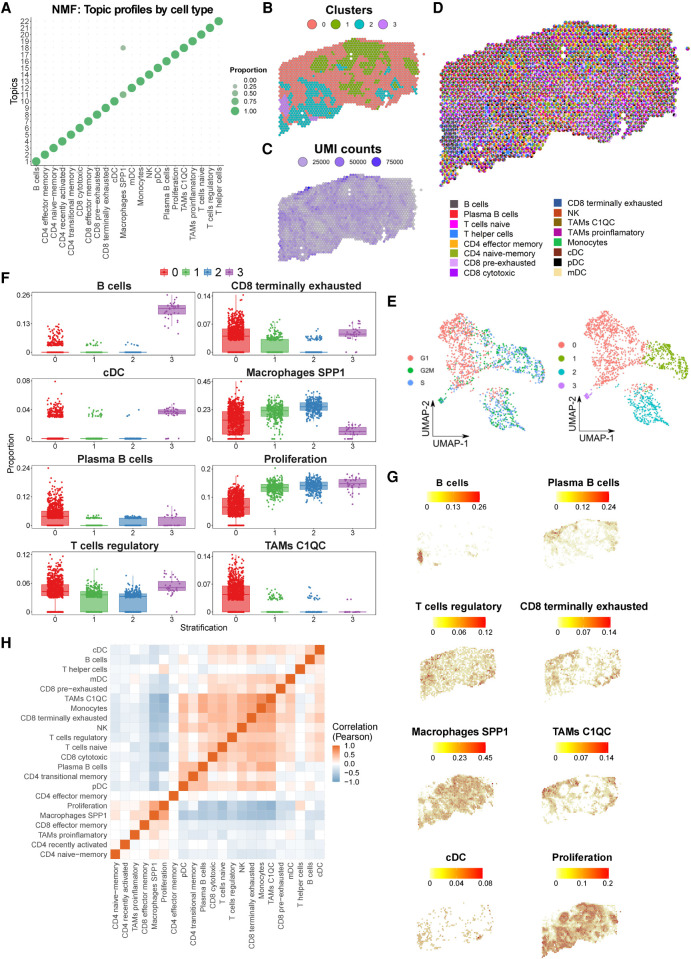
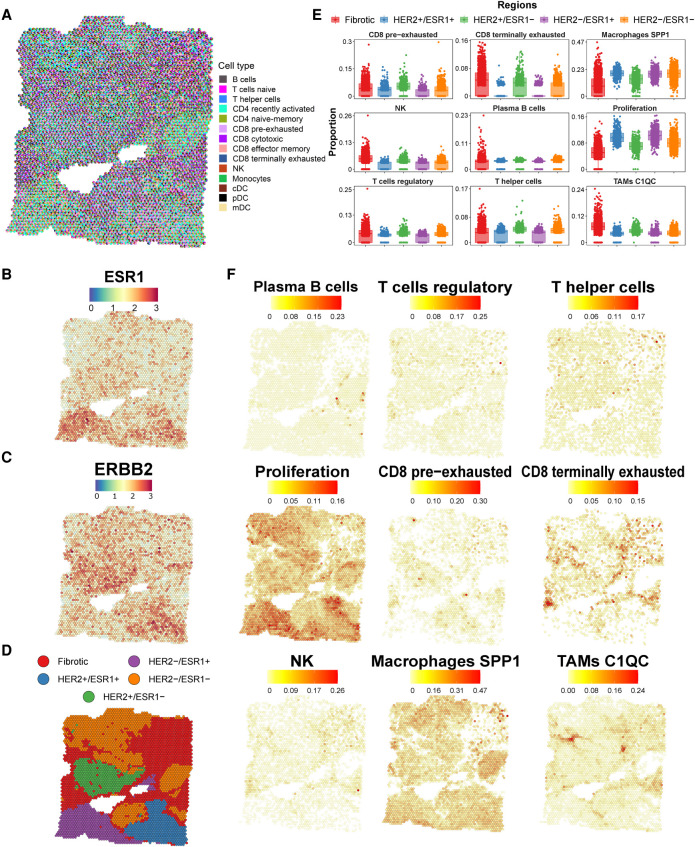
The tumor immune microenvironment is a main contributor to cancer progression and a promising therapeutic target for oncology. However, immune microenvironments vary profoundly between patients, and biomarkers for prognosis and treatment response lack precision. A comprehensive compendium of tumor immune cells is required to pinpoint predictive cellular states and their spatial localization. We generated a single-cell tumor immune atlas, jointly analyzing published data sets of >500,000 cells from 217 patients and 13 cancer types, providing the basis for a patient stratification based on immune cell compositions. Projecting immune cells from external tumors onto the atlas facilitated an automated cell annotation system. To enable in situ mapping of immune populations for digital pathology, we applied SPOTlight, combining single-cell and spatial transcriptomics data and identifying colocalization patterns of immune, stromal, and cancer cells in tumor sections. We expect the tumor immune cell atlas, together with our versatile toolbox for precision oncology, to advance currently applied stratification approaches for prognosis and immunotherapy.


Figures

Figure 1.
Figure 1.
Characterization of the tumor immune cell atlas. (A) Number of cells (top) and patients (bottom) per cancer type included in the atlas. (B) UMAP of 317,111 immune cells from 13 cancer types colored by annotated cell type. (C) Total number of cells of each immune cell type/state; color code as in A. (D) Marker gene expression levels for broader cell types (left) and only T cells states (right); color code as in A. (E) Cancer type proportions for each annotated cell type/state. (F) Number of unique patients representing each cell type/state in the atlas. (G) Expression of the top four differentially expressed genes per cell type/state; colored by cell type (as in A) and cancer type (as in E).
Figure 2.
Figure 2.
Patient stratification based on the tumor immune cell composition. (A) Cell type composition of patients colored by cell type/state frequencies. Patients are clustered (C1–6) into groups of similar cell type composition. Cancer and cluster identities are indicated below. (B) Dimensionality reduction representation (t-SNE distribution) of cell type frequencies in cancer patients colored by cancer type (top) and cluster identity (bottom). (C) Variance contribution to the two first principal components (PCs) of the top variable cell types. (D) Frequencies (% total cells) of cell types representative for cluster 1–6. (E) Heat map representation of cell type frequencies within each cluster. (F) Cancer type contribution to the six immune clusters; color code as cancer types in A.
Figure 3.
Figure 3.
Automated annotation of external human tumor-derived immune cells using the tumor immune atlas as reference. (A,B) UMAP representation of immune cell transcriptomes from a primary uveal melanoma colored by their predicted cell type/state based on the tumor immune reference (A) or using unsupervised clustering (B). (C) Marker correspondence (Jaccard index) between uveal melanoma clusters (B) and the cell type clusters of the reference atlas. (D,E) UMAP representation of immune cell transcriptomes from a primary ovarian carcinoma colored by predicted cell type/state (D, color code as in A) and after clustering (E). (F) Marker correspondence (Jaccard index) between the ovarian cancer clusters and the cell type clusters of the reference atlas. (G) UMAP representation of immune cells from two uveal melanoma liver metastasis colored by their predicted cell type (color code as in A). (H,I) UMAP representation of T cells isolated from a brain metastasis colored by their predicted cell type (H, color code as in A) and clonal expansion profiled through TCR genotyping (I).
Figure 4.
Figure 4.
Projecting mouse tumor immune cells onto the human reference atlas. (A,B) UMAP single-cell transcriptome representations of mouse T cells isolated from tumor organoids. Cells are color-coded by their predicted cell type based on the human reference atlas (A) or by cluster identity (B). (C) Cell type composition of each cluster (color code as in A). (D) Marker gene correspondence (Jaccard index) between the mouse immune clusters and the cell type clusters of the reference atlas. (E,F) UMAP representation of mouse T cells isolated from tumor organoids colored by predicted cell type (E, color code as in A) and clonality based on expanded TCR clonotypes (F).
Figure 5.
Figure 5.
Spatial mapping of the reference immune cell types using ST oropharyngeal squamous cell carcinoma (SCC) sections. (A) Cell type–specific topic profiles presenting a high topic/cell type specificity. (B) ST profiled section of a SCC primary tumor. Tissue stratification according to unsupervised clustering. (C) The number of unique molecular identifiers (UMI) recovered from each spot indicate the areas transcriptionally most active. (D) Pie chart representation showing proportions (per ST spot) of SPOTlight-predicted immune cells based on the single-cell immune reference atlas. To visualize spatially variable cell types, only immune cell types present in <75% of the spots are displayed. (E) UMAP embedding of ST spots presenting the cell cycle phase (left) and cluster identity (right) for each spot. (F) Box plots displaying significant differences in cell type proportion of clusters (ANOVA test). (G) Location and proportion of significantly differentially located cell types in the SCC section. (H) Clustered correlation matrix between the predicted cell type proportions identifying colocalization (red) and exclusive (blue) immune distribution patterns.
Figure 6.
Figure 6.
Tumor immune reference mapping ST section from a ductal breast carcinoma. (A) Pie chart representation showing proportions (per ST spot) of SPOTlight-predicted immune cells based on the single-cell immune reference atlas. To visualize spatially variable cell types, only immune cell types present in <75% of the spots are displayed. (B,C) Estrogen receptor 1 (ESR1, B) and erb-b2 receptor tyrosine kinase 2 (ERBB2, also known as HER2, C) gene expression levels on the ST section, indicating profound regionality of the expression. (D) Tissue stratification and labeling according to unsupervised clustering. (E) Box plots of significantly differentially localized cell type proportions between the clusters (ANOVA test). Differences between tumor areas (i.e., HER2+ and ESR1+) are observed, suggesting differential tumor microenvironments of the tumor subclones. (F) Location and proportion of immune cell types with local enrichment.

References

    1. Alashwal H, El Halaby M, Crouse JJ, Abdalla A, Moustafa AA. 2019. The application of unsupervised clustering methods to Alzheimer's disease. Front Comput Neurosci 13: 31. 10.3389/fncom.2019.00031 - DOI - PMC - PubMed
    1. Allard D, Allard B, Stagg J. 2020. On the mechanism of anti-CD39 immune checkpoint therapy. J Immunother Cancer 8: e000186. 10.1136/jitc-2019-000186 - DOI - PMC - PubMed
    1. Asp M, Giacomello S, Larsson L, Wu C, Fürth D, Qian X, Wärdell E, Custodio J, Reimegård J, Salmén F, et al. 2019. A spatiotemporal organ-wide gene expression and cell atlas of the developing human heart. Cell 179: 1647–1660.e19. 10.1016/j.cell.2019.11.025 - DOI - PubMed
    1. Azizi E, Carr AJ, Plitas G, Cornish AE, Konopacki C, Prabhakaran S, Nainys J, Wu K, Kiseliovas V, Setty M, et al. 2018. Single-cell map of diverse immune phenotypes in the breast tumor microenvironment. Cell 174: 1293–1308.e36. 10.1016/j.cell.2018.05.060 - DOI - PMC - PubMed
    1. Butler A, Hoffman P, Smibert P, Papalexi E, Satija R. 2018. Integrating single-cell transcriptomic data across different conditions, technologies, and species. Nat Biotechnol 36: 411–420. 10.1038/nbt.4096 - DOI - PMC - PubMed

Publication types

Substances