. 2021 Sep 21;12(1):5552.
doi: 10.1038/s41467-021-25847-2.

Synthetic hydrogel nanoparticles for sepsis therapy

Affiliations

Synthetic hydrogel nanoparticles for sepsis therapy

Hiroyuki Koide et al. Nat Commun. .

Abstract

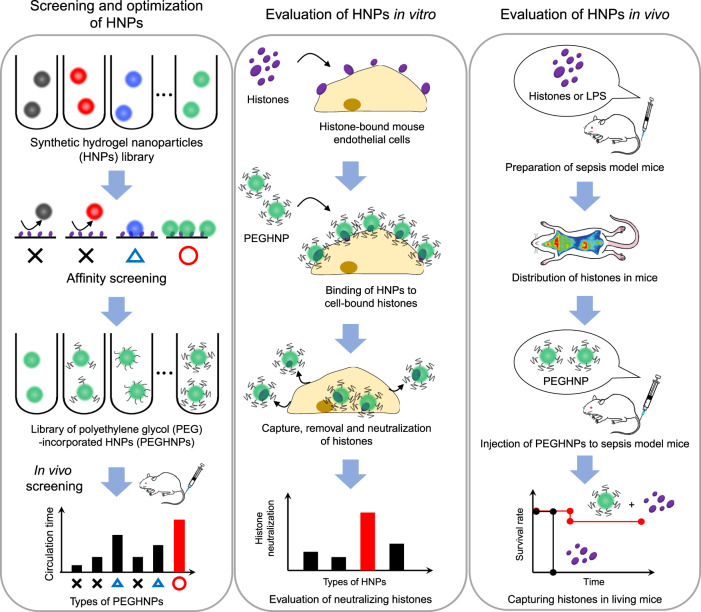
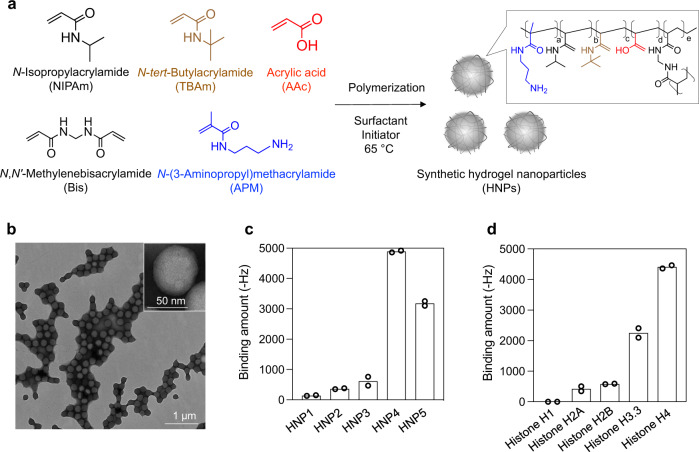
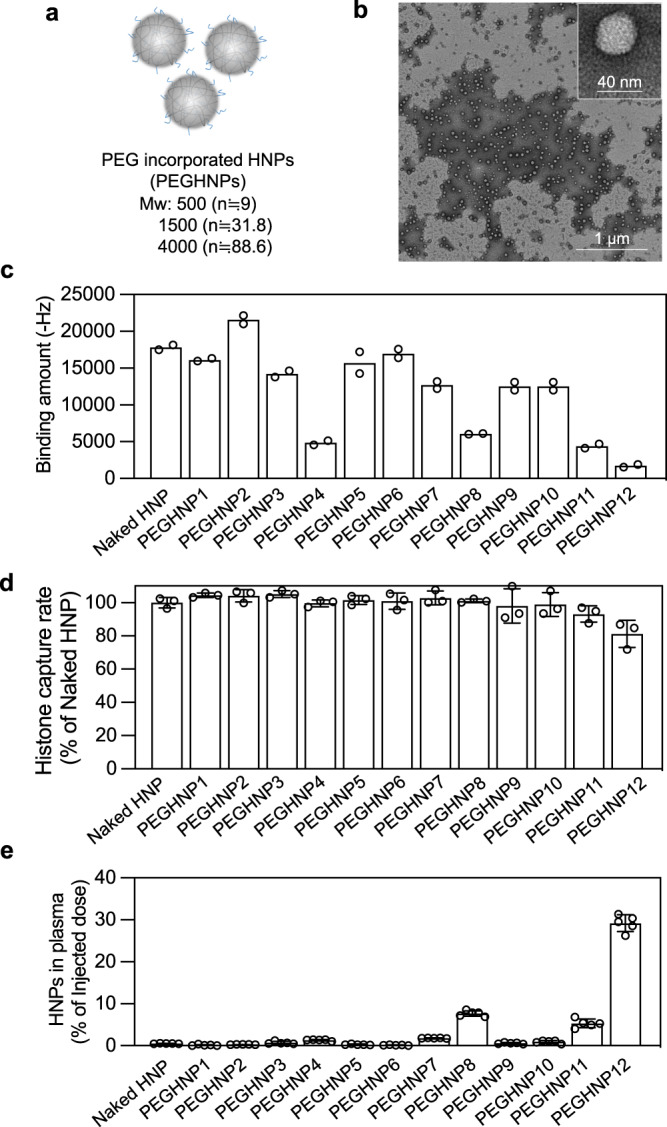
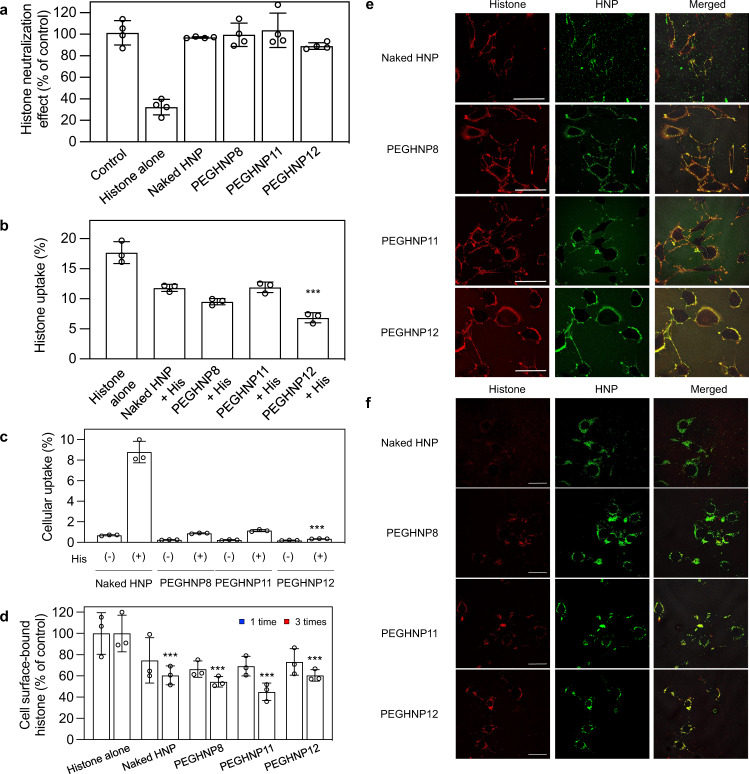
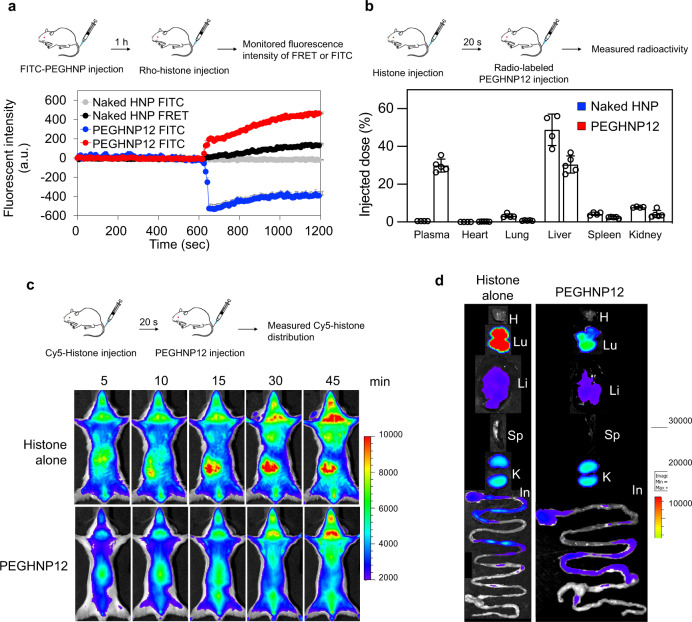
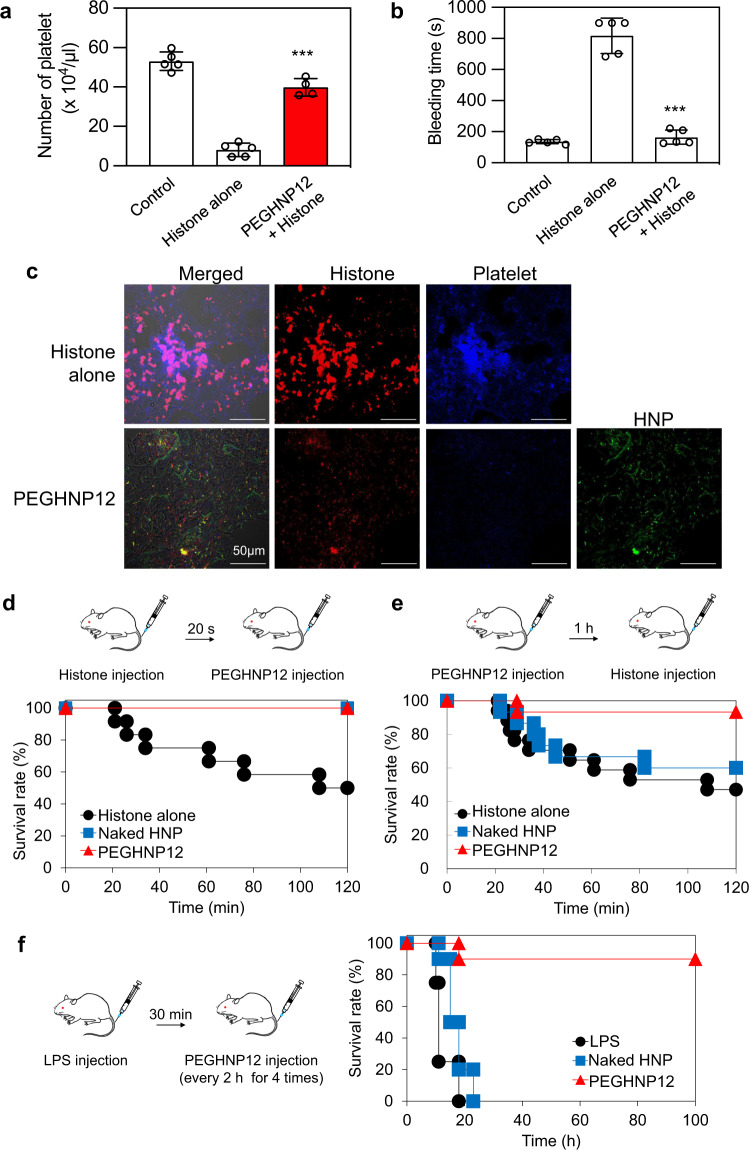
Sepsis is a life-threatening condition caused by the extreme release of inflammatory mediators into the blood in response to infection (e.g., bacterial infection, COVID-19), resulting in the dysfunction of multiple organs. Currently, there is no direct treatment for sepsis. Here we report an abiotic hydrogel nanoparticle (HNP) as a potential therapeutic agent for late-stage sepsis. The HNP captures and neutralizes all variants of histones, a major inflammatory mediator released during sepsis. The highly optimized HNP has high capacity and long-term circulation capability for the selective sequestration and neutralization of histones. Intravenous injection of the HNP protects mice against a lethal dose of histones through the inhibition of platelet aggregation and migration into the lungs. In vivo administration in murine sepsis model mice results in near complete survival. These results establish the potential for synthetic, nonbiological polymer hydrogel sequestrants as a new intervention strategy for sepsis therapy and adds to our understanding of the importance of histones to this condition.


Conflict of interest statement

The authors declare no competing interests.

Figures

Fig. 1
Fig. 1. Workflow of this study.
First, we develop HNPs with PEG modification to optimize their histone affinity, capacity, low-aggregation, and blood circulation time altogether to achieve highly effective sepsis therapy. Next, we evaluate PEGHNPs in vitro. Finally, we evaluate the efficacy of PEGHNPs using living mice in vivo.
Fig. 2
Fig. 2. Screening of HNPs for histone affinity.
a Schematic of synthetic HNPs synthesized by free-radical copolymerization of functional monomers. b TEM image of HNPs. The experiment was repeated three times. c Affinity of HNPs for histones. QCM sensor cells were functionalized with histones. After blocking with BSA, each type of HNPs was added and their binding amount was measured. d Affinity of HNP4 for the purified histone subtypes. QCM sensor cells were functionalized with the purified histone subtypes. After blocking with BSA, HNP4 was added and its binding amount was measured. Data represent the means of independent duplicate measurements.
Fig. 3
Fig. 3. Incorporation of the optimum amount of PEG into HNPs for increasing the circulation time of HNPs without histone affinity reduction.
a Schematic of PEGHNPs synthesized by free-radical copolymerization of functional monomers. b TEM image of PEGHNPs. The experiment was repeated two times, five pictures were taken in each experiment. c QCM analysis of the histone–PEGHNP interaction. The surface of the QCM cell was functionalized with histones and solutions of PEGHNPs were added to the QCM cells. Data represent the means of independent duplicate measurements. d Histone capture rate of PEGHNPs. Histone (600 µg/ml) and PEGHNPs (3000 µg/ml) were ultracentrifuged after the incubation for 30 min. Then, free histones were measured. Data represent the means ± s.d. n = 3. e Distribution of PEGHNPs in the plasma 3 h after the intravenous injection of [14C]-labeled PEGHNPs. Data represent the means ± s.d. n = 5. Blue bars; M.W of PEG: 500, yellow bar; M.W of PEG; 1500, and red bar; M.W of PEG; 4000.
Fig. 4
Fig. 4. Neutralization of histones by HNPs after their binding to the cell surface.
a Neutralization of the cell surface-bound histones by PEGHNPs. 2H-11 cells were treated with histones for 60 s. Then, PEGHNPs were added after the PBS washing to remove free histones in the medium. At 24 h after HNP addition, viable cells were determined by a WST-8 assay. Data represent the means ± s.d. n = 4. b Cellular uptake of histones. 2H-11 cells were incubated with Cy5-histones and PEGHNPs for 24 h. Then, the cells were lysed and the amount of Cy5-histones was measured. Significant difference; ***p < 0.0001 vs. Histones alone, p = 0.0012 vs. Naked HNP + His, p = 0.062 vs. PEGHNP8 + His, and p = 0.0001 vs. and PEGHNP11 + His. Data represent the means ± s.d. n = 3. Differences within a group were evaluated by one-way analysis of variance (ANOVA) with the Tukey post hoc test using Kaleidagraph (Version 4.5.3). c Cellular uptake of HNPs. 2H-11 cells were incubated with FITC-HNPs and/or histones for 24 h. Then, the cells were lysed and the amount of FITC-HNPs was measured. Significant difference; ***p < 0.0001 vs. Naked HNP(+), p = 0.0001 vs. PEGHNP8 (+), and p < 0.00012 vs. PEGHNP11 (+). Data represent the means ± s.d. n = 4. The data were analyzed by two-tailed Student’s t tests. d Removal of the cell surface-bound histones by PEGHNP washing. 2H-11 cells were treated with Cy5-labeled histones for 10 s. The cells were washed with PEGHNPs 1 or 3 times. Then, the cells were lysed and the fluorescent intensity of Cy5-histones was measured. Significant difference; p = 0.046 Histone alone vs. Naked HNP, p = 0.046 Histone alone vs. PEGHNP8, p = 0.046 Histone alone vs. PEGHNP11, and p = 0.026 Histone alone vs. PEGHNP12. Data represent the means ± s.d. n = 3. The data were analyzed by two-tailed Student’s t tests. e, f Localization of Cy5-histones and FITC-PEGHNPs. 2H-11 cells were treated with Cy5-histones for 10 s. Then, the cells were washed with FITC-PEGHNPs. At 30 min (e) and 24 h (f) after the washing, the localization of Cy5-histones and FITC-HNPs was observed laser scanning confocal microscopy. Red: histones; Green: HNPs; Bar: 50 µm. The experiment was repeated two times and three pictures were taken in each experiment.
Fig. 5
Fig. 5. Capturing histones by HNPs in the bloodstream.
a Behavior of Rho–histones and FITC–PEGHNPs in the murine bloodstream was observed by laser-scanning confocal microscopy. The FITC (Ex = 488 nm, Em = 520 nm) and FRET (Ex = 488 nm, Em = 570 nm) channels were recorded for 10 min before and after the histone injection. The fluorescence intensity of FRET or FITC in the bloodstream. The zero-time point corresponds to the time of the histone injection. Data represent the means ± s.d. n = 4 Rho; rhodamine, FITC fluorescein isothiocyanate. b Biodistribution of naked HNPs and PEGHNP12 in histone pre-treated mice. Mice were intravenously injected with radio-labeled naked HNPs or PEGHNP12 at 20 s after the histone treatment (IV). Twenty-four-hour after the injection, the distribution of HNPs in the plasma and each organ was measured. Data represent the means ± s.d. n = 5. c, d Biodistribution of Cy5-histones. Mice were intravenously injected with Cy5-histone after PEGHNP12 injection. Then, the biodistribution of cy5-histones were monitored by in vivo imaging system. d Ex vivo image at 1 h after the histone injection. H heart, Lu lungs, Li liver, Sp spleen, K kidneys, In intestine.
Fig. 6
Fig. 6. Protection of mice from septic lethality by HNPs in vivo.
a Number of platelets after injecting histones and/or HNPs. Histones (40 mg/kg) were injected into mice 1 h after injecting HNPs (10 mg/kg). Twenty minutes after the injection, the number of platelets was measured. Significant difference; ***p < 0.0001 vs. Histones alone. Data represent the means ± s.d. n = 4–5. Data represent the means ± s.d. n = 4. Differences within a group were evaluated by one-way ANOVA with the Tukey post hoc test. b Tail bleeding time after injecting histones and/or PEGHNPs. Histones (40 mg/kg) were injected into mice 1 h after injecting HNPs (10 mg/kg). Twenty minutes after the injection, the time of bleeding from the tail was measured. Significant difference; ***p < 0.0001 vs. Histones alone. Data represent the means ± s.d. n = 4–5. Data represent the means ± s.d. n = 4. Differences within a group were evaluated by one-way ANOVA with the Tukey post hoc test. c Immunostaining of lungs after injecting histones and/or HNPs. Cy5-histones (40 mg/kg) were intravenously injected into mice 1 h after FITC-PEGHNP injection (10 mg/kg). Twenty minutes after the histone injection, the frozen section of the lungs was stained with CD41. Red: histones; blue: platelets; green: HNPs. Bar: 0.05 mm. d Survival rate of mice intravenously treated with PEGHNPs (10 mg/kg) at 20 s after the injection of histones (75 mg/kg). e Survival rate of mice intravenously treated with histones (75 mg/kg) at 1 h after the injection of PEGHNPs (10 mg/kg). f Survival rate of LPS-induced (15 mg/kg) sepsis model mice improved by the injection of PEGHNP12 (10 mg/kg). LPS lipopolysaccharide.

References

    1. Singer M, et al. The third international consensus definitions for sepsis and septic shock (sepsis-3) J. Am. Med. Assoc. 2016;315:801–810. doi: 10.1001/jama.2016.0287. - DOI - PMC - PubMed
    1. Bray M, Mahanty S. Ebola hemorrhagic fever and septic shock. J. Infect. Dis. 2003;188:1613–1617. doi: 10.1086/379727. - DOI - PubMed
    1. Fink MP, Warren HS. Strategies to improve drug development for sepsis. Nat. Rev. Drug Discov. 2014;13:741–758. doi: 10.1038/nrd4368. - DOI - PubMed
    1. Vincent JL, et al. Assessment of the worldwide burden of critical illness: the intensive care over nations (ICON) audit. Lancet Respir. Med. 2014;2:380–386. doi: 10.1016/S2213-2600(14)70061-X. - DOI - PubMed
    1. Huang L. et al. Sepsis-associated severe interleukin-6 storm in critical coronavirus disease 2019. Cell. Mol. Immunol. 1092–1094 (2020). - PMC - PubMed

MeSH terms