. 2021 Sep 21;12(1):5557.
doi: 10.1038/s41467-021-25810-1.

Spatial regulation by multiple Gremlin1 enhancers provides digit development with cis-regulatory robustness and evolutionary plasticity

Affiliations

Spatial regulation by multiple Gremlin1 enhancers provides digit development with cis-regulatory robustness and evolutionary plasticity

Jonas Malkmus et al. Nat Commun. .

Abstract

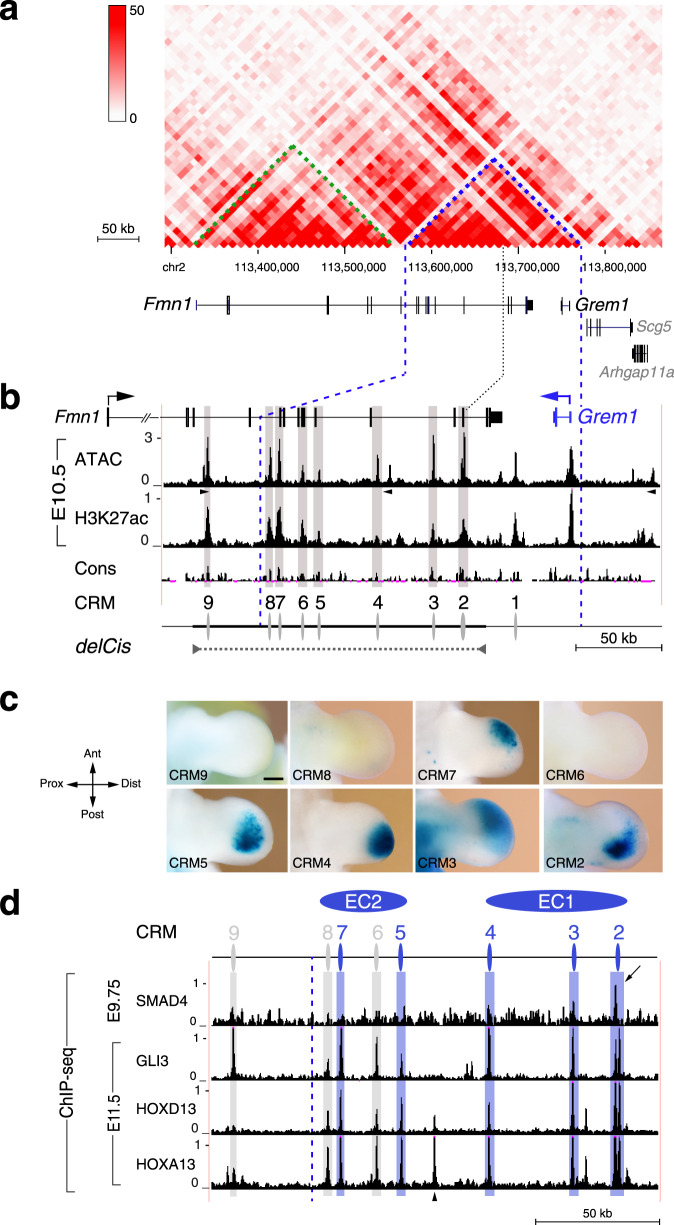
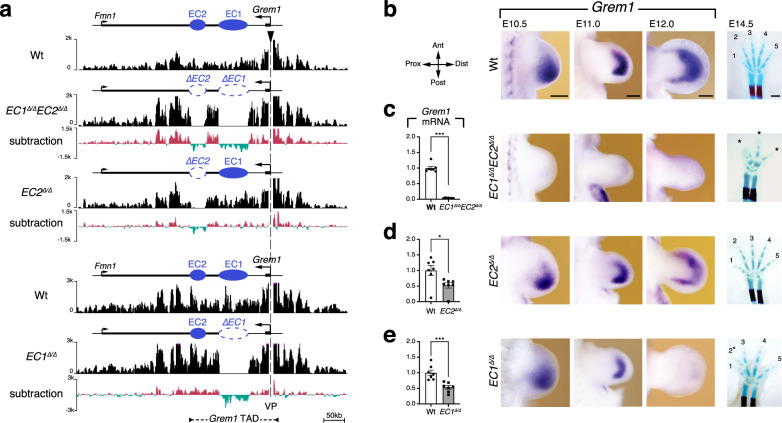
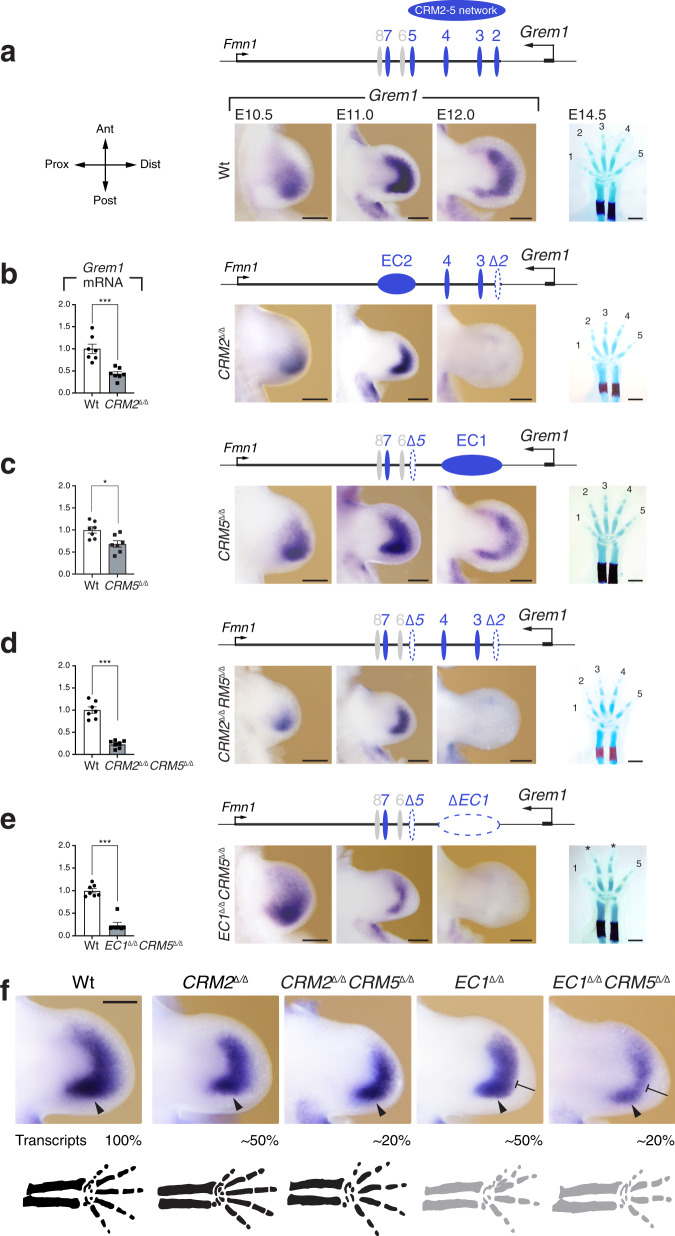
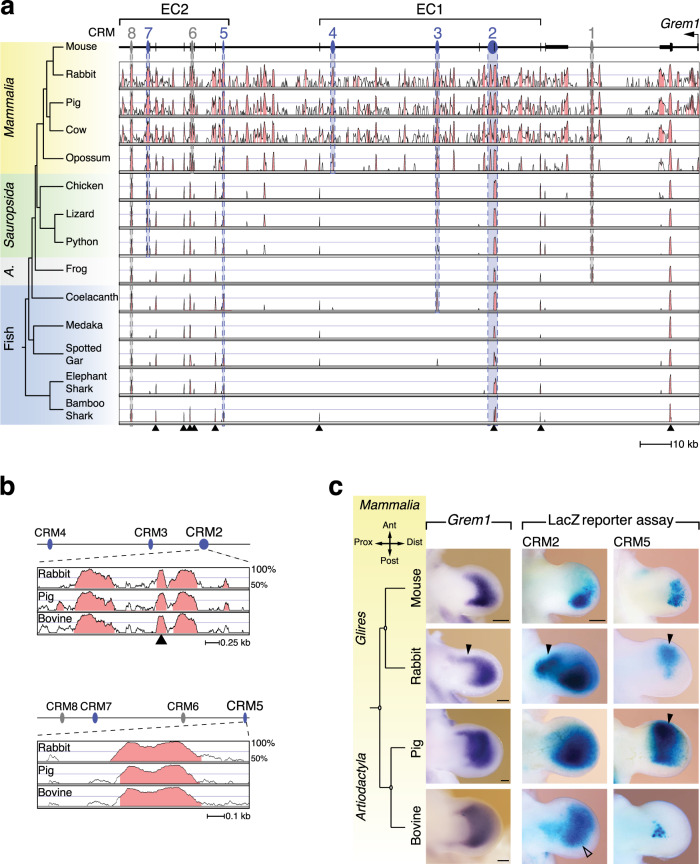
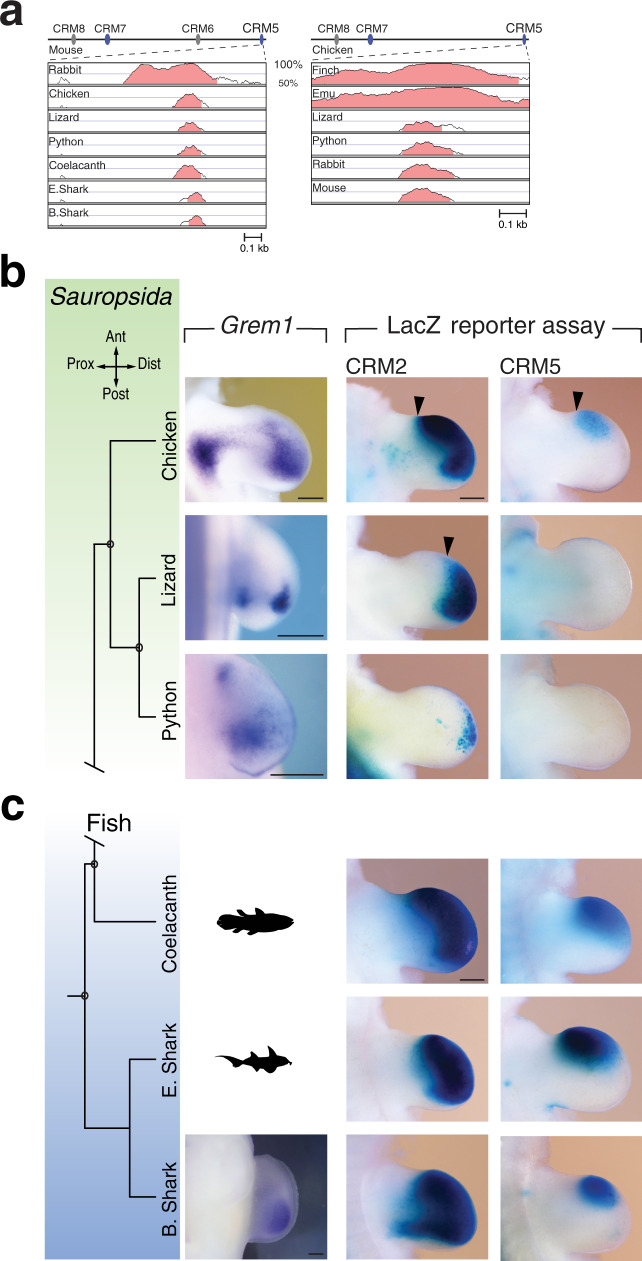
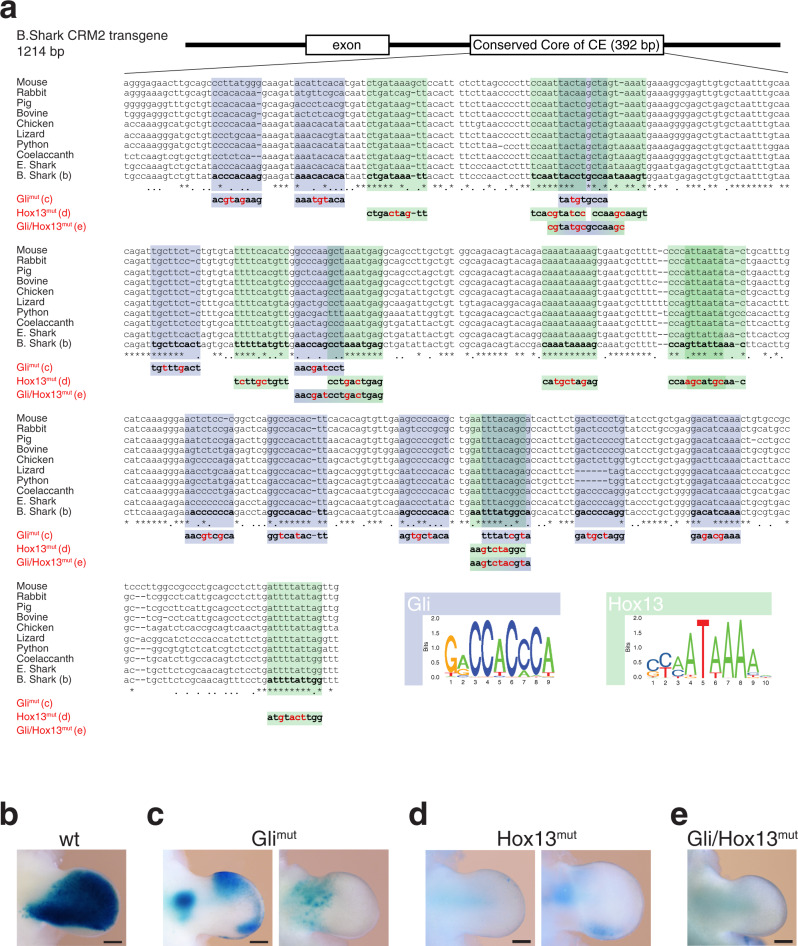
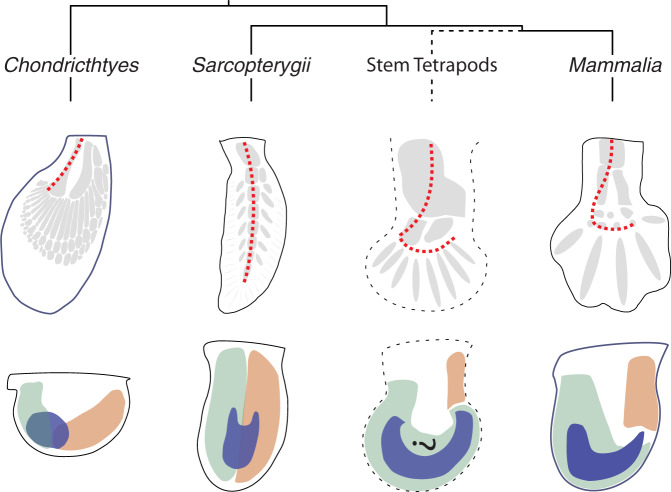
Precise cis-regulatory control of gene expression is essential for normal embryogenesis and tissue development. The BMP antagonist Gremlin1 (Grem1) is a key node in the signalling system that coordinately controls limb bud development. Here, we use mouse reverse genetics to identify the enhancers in the Grem1 genomic landscape and the underlying cis-regulatory logics that orchestrate the spatio-temporal Grem1 expression dynamics during limb bud development. We establish that transcript levels are controlled in an additive manner while spatial regulation requires synergistic interactions among multiple enhancers. Disrupting these interactions shows that altered spatial regulation rather than reduced Grem1 transcript levels prefigures digit fusions and loss. Two of the enhancers are evolutionary ancient and highly conserved from basal fishes to mammals. Analysing these enhancers from different species reveal the substantial spatial plasticity in Grem1 regulation in tetrapods and basal fishes, which provides insights into the fin-to-limb transition and evolutionary diversification of pentadactyl limbs.


Conflict of interest statement

The authors declare no competing interests.

Figures

Fig. 1
Fig. 1. Multiple CRMs in the Grem1 TAD are enhancers interacting with key transcription complexes.
a Hi-C metadata from mouse embryonic fibroblasts show the chromatin interactions in the Grem1-Fmn1 TAD on mouse chromosome 2. The colour intensity scale shows the contact frequencies. The Grem1 TAD: ~190 kb, indicated by blue dashed lines, Fmn1 TAD: ~240 kb, indicated by green dashed lines. Arhgap11a and Scg5 are part of the genomic region but not located within the Grem1 TAD. b Enlargement of the Grem1 TAD (vertical blue dashed lines) and the delCis region required for Grem1 expression in limb buds (indicated by a horizontal black dashed line). The directions of transcription are indicated by arrows. The ATAC-seq peaks (open chromatin) and histone H3K27 acetylation ChIP-seq peaks (H3K27ac; active enhancers) detected in forelimb buds at E10.5 identify all candidate CRMs located distal to the Grem1 coding region. n = 2 independent biological replicates were analysed for the ATAC-seq and the H3K27ac ChIP-seq. The peak calling function of MACS2 identified the significantly enriched peaks present in both replicates of the ATAC-seq and the H3K27ac ChIP-seq. The genomic regions enriched in both ATAC-seq and H3K27ac ChIP-seq peaks correspond to candidate CRMs that are numbered in 3′ direction starting with CRM1 (Table 1) and CTCF sites that are indicated by black arrowheads. c LacZ reporter assays in transgenic founder embryos, representing independent transgene insertion events, establish robust enhancer activities for CRM2 (n = 7/11 expressors), CRM3 (n = 5/8), CRM4 (n = 6/8) CRM5 (n = 7/13) and CRM7 (n = 3/6) in forelimb buds (E11.0–E11.5). CRM6 displays mostly no or rarely variable activity (n = 2/14 expressors), while CRM8 (n = 0/5) and CRM9 (n = 0/4) are not active in limb buds. The transgenic founder embryos that express LacZ in forelimb buds are indicated as the fraction of all embryos with LacZ expression in limb and non-limb tissues. Scale bar: 250 µm. Ant: anterior, Dist: distal, Post: posterior, Prox: proximal. d ChIP-seq analysis identifies the interaction of SMAD4 chromatin complexes with CRM2 in the Cis region during the onset of forelimb development (E9.5–9.75) and the GLI3, HOXD13 and HOXA13 chromatin complexes during outgrowth (E11.5). n = 2 independent biological replicates were analysed for all ChIP-seq experiments and the peak calling function of MACS2 identified the significantly enriched peaks in both replicates. These peaks overlap the CRMs identified with exception of one HOXA13 ChIP-seq peak that is located in a conserved region of non-accessible and non-H3K27ac marked chromatin (indicated by an arrowhead). The only called SMAD4 ChIP-seq peak within the Grem1 TAD is indicated by an arrow. CRM enhancers are indicated in blue, CRMs without LacZ activity in grey. EC1 and EC2: enhancer cluster 1/2. The inputs for the H3K27ac, SMAD4 and GLI3 ChIP-seq analyses (panels b, d) are shown in Supplementary Fig. 3.
Fig. 2
Fig. 2. Two enhancer clusters in the Grem1 TAD control the spatio-temporal dynamics of limb bud mesenchymal Grem1 expression.
a Chromatin conformation capture (4C) using the Grem1 promoter as viewpoint (VP, also indicated by a black arrowhead) to reveal its interactions with the Grem1-Fmn1 landscape. The 4C profiles of forelimb buds lacking both EC1 and EC2 or EC2 and EC1 alone were compared to their respective wild-type controls (upper Wt: control for EC1Δ/ΔEC2Δ/Δ and EC2Δ/Δ, lower Wt: control for EC1Δ/Δ forelimb buds). Subtraction after normalization reveals that the deletions do not affect the interactions of the Grem1 promoter with the remainder of the Grem1-Fmn1 TAD (subtraction, green: reduction or loss of interactions, red: gain of interactions). The position of Grem1 TAD is indicated at the bottom of the panel. be Left panels (except b): RT-qPCR was used to determine the relative Grem1 transcript levels in wild-type and homozygous mutant forelimb buds (n = 7 independent biological replicates at E11.0, 40–42 somites per genotype). Bars represent mean values +/− SEM. P-values were determined using the two-tailed Mann–Whitney test: ***p = 0.000583 (panels c, e), *p = 0.017483 (panel d). Middle panels: In situ hybridisation shows the spatio-temporal Grem1 distribution in wild-type (Wt) and mutant forelimb buds at three developmental stages (n = 4 embryos analysed per genotype and stage from different litters and in minimally two independent experiments). E10.5: 35–37 somites; E11.0: 40–42 somites, E12.0: staged by developmental time). Ant: anterior, Dist: distal, Post: posterior, Prox: proximal. Scale bars: 250 μm. Right panels: limb skeletons at ~E14.5 (blue: cartilage, red: ossification centres in radius and ulna). Digits are shown from anterior (digit 1) to posterior (digit 5). Only three rudimentary digits form in EC1Δ/ΔEC2Δ/Δ forelimb buds (indicated by asterisks, n = 5). In contrast, pentadactyly is perfectly maintained in EC2Δ/Δ forelimbs (n = 3), while 64% of all EC1Δ/Δ (n = 9/14) forelimb skeletons display variable fusions of digits 2 and 3 (asterisk). Scale bar: 1 mm. RT-qPCR source data are provided in a Source data file.
Fig. 3
Fig. 3. Interactions among CRMs provide the spatially dynamic Grem1 expression and pentadactyly with cis-regulatory robustness.
a Left panel: indication of the relevant limb bud axes. Ant: anterior, Dist: distal, Post: posterior, Prox: proximal. be Left panels: RT-qPCR was used to determine the relative Grem1 transcript levels by comparing wild-type and CRM2Δ/Δ (b), CRM5Δ/Δ (c), CRM2Δ/ΔCRM5Δ/Δ (d) and EC1Δ/ΔCRM5Δ/Δ forelimb buds (e; n = 7 independent biological replicates at E11.0, 40–42 somites for all genotype). Bars represent mean values +/− SEM. P-values were determined using the two-tailed Mann–Whitney test: ***p = 0.000583 (panels b, d, e) and *p = 0.011072 (panel c). Middle panels: spatial Grem1 expression in wild-type (a) and the different single and compound mutant forelimb buds (be) at the developmental stages indicated (n = 4 embryos analysed per genotype and stage from different litters and in minimally two independent experiments). Scale bars: 250 μm. Right panels: limb skeletons at ~E14.5 (blue: cartilage, red: ossification centre in radius and ulna). Digits are shown from anterior (digit 1) to posterior (digit 5). Pentadactyly is maintained in CRM2Δ/Δ (n = 4 embryos), CRM5Δ/Δ (n = 8) and CRM2Δ/ΔCRM5Δ/Δ (n = 3) forelimb skeletons. In contrast, all EC1Δ/ΔCRM5Δ/Δ (n = 8) forelimb skeletons are tetradactyl with symmetrical middle digits of equal length (indicated by asterisks). Scale bar: 1 mm. f Direct comparison of the Grem1 expression domain in forelimb buds of the most relevant CRM loss-of-function alleles (E11.0, 40–42 somites). These forelimb buds belong to the same group of biological replicates as the ones shown in Figs. 2 and 3. Arrowheads indicate the posterior domain. Bar-ended lines point to the stunted crescent domain. The forelimb buds are representative of the spatial distributions in the respective genotype. The relative Grem1 transcript levels in comparison to the wild-type (set at 100%, see before) and schematics of the distal limb skeletons are shown below. Skeletons in black: pentadactyly maintained, grey: pentadactyly altered/disrupted. RT-qPCR source data are provided in a Source data file.
Fig. 4
Fig. 4. Spatial plasticity of the ancient CRM2 and CRM5 enhancers during evolutionary diversification of mammalian limb development.
a Multiple sequence alignments using the mouse genome as reference reveals the deep evolutionary conservation of the Grem1 TAD in jawed vertebrates (Gnathostomata). The CRM enhancers active in the mouse are indicated in blue and all others CRMs in grey. Regions with ≥70% conservation are shaded in light red. Black arrowheads indicate the conserved Fmn1 exons. A: amphibians. Genomes from the following species are included. Mouse: Mus musculus (reference genome); rabbit: Oryctolagus cuniculus; pig: Sus scrofa; bovine: Bos taurus; opossum: Monodelphis domestica; chicken: Gallus gallus; lizard: Anolis carolinensis; python: Python bivittatus; frog: Nanorana parkeri; coelacanth: Latimeria chalumnae; medaka: Oryzias latipes; spotted gar: Lepisosteus oculatus; elephant shark: Callorhinchus milii, bamboo shark: Chiloscyllium punctatum. b Conservation plots reveal the evolutionary conservation of the relevant mammalian CRM2 and CRM5 regions in comparison to the mouse. All highly conserved regions (≥70%, shaded light red) were included in the LacZ reporter constructs. Black arrowhead indicates Fmn1 exon 22 that is an integral part of CRM2 in all species. c Evolutionary diversification of the Grem1 expression domains and spatial activities of CRM2 and CRM5 in pentadactyl (mouse, rabbit) and artiodactyl (pig, bovine) species. Left panels: Grem1 expression in mouse (E11.0), rabbit (gestational day D12), pig (D23) and bovine (D34) forelimb buds (n ≥ 3 independent embryos analysed). Middle and right panels: CRM2 and CRM5 enhancer activities from the different species as determined by LacZ reporter assays in transgenic mouse limb buds mouse CRM2: n = 7/11, CRM5 n = 7/13 (see Fig. 1c); rabbit CRM2 n = 10/11 and CRM5 n = 4/6 with highly variable activities; pig CRM2 n = 3/3 and CRM5 n = 5/5, bovine CRM2 n = 4/4 and CRM5 n = 5/5. Black arrowheads indicate the anterior expansion of Grem1 expression/enhancer activities compared to the mouse. Bovine CRM2: open arrowhead indicates the loss in posterior activity bias. The transgenic founder embryos that express LacZ in forelimb buds are indicated as the fraction of all embryos with LacZ expression in limb and non-limb tissues. Ant: anterior, Dist: distal, Post: posterior, Prox: proximal. Scale bars: 250 μm.
Fig. 5
Fig. 5. The deeply conserved CE region is essential for CRM2 activity but posterior activity depends on interaction with the ME region.
a Conservation plot analysis using the mouse (upper panel) and chicken (lower panel) CRM2 regions reveals the deep evolutionary conservation of CE region and Fmn1 exon 22 (black arrowhead). In contrast, the upstream ME region that is conserved among mammalian species, is not detected in Sauropsida and basal fishes. Note the extensive conservation of the CRM2 region among different bird species. Regions with ≥70% conservation are shaded in light red. b Deletion analysis of the mouse CRM2 enhancer activity. Upper panel: deletion of the deeply conserved CE region (ΔCE) abolishes LacZ reporter activity (n = 6/7, proximal activity n = 1/7). Note that a few posterior cells with enhancer activity have been observed (n = 2/7). Middle panel: deletion of the mammalian-specific ME region (ΔME) restricts LacZ reporter activity to the anterior-distal limb bud mesenchyme (n = 5/6) in comparison to the intact CRM2 enhancer (lower panel, n = 9/11). c On its own, the ME region has no activity (upper panel, n = 0/4), while the CE region is active in the anterior-distal mesenchyme (middle panel, n = 4/5, activity throughout the limb bud n = 1/5). A LacZ reporter construct encoding both the ME and CE regions restores posterior activity but also retains anterior expression (lower panel, n = 7/7). The dorso-ventral bias in CRM2 activity together with the restriction from the sub-ectodermal region as observed for Grem1 expression is also partially restored (n = 7/7). The transgenic founder embryos that express LacZ in forelimb buds are indicated as the fraction of all embryos with LacZ expression in limb and non-limb tissues. Scale bars: 250 μm.
Fig. 6
Fig. 6. Reporter assays in transgenic mouse embryos reveal the limb enhancer activities of CRM2 and CRM5 from Sauropsida and basal fishes.
a Conservation plot analysis using the mouse (left panel) and chicken genome (right panel) as reference genomes reveals the reduced conservation of CRM5 in non-mammalian species. For using bamboo shark as reference genome see Supplementary Fig. 9. The highest conserved CRM5 regions (≥70%) are shaded in light red. b Left panels: Grem1 expression in chicken wing buds (n = 4 embryos at two stages, shown is stage HH24-25) and Anolis lizard forelimb buds (n = 4 embryos at stage 6) at stages similar to mouse forelimb buds at E11.0. For python embryos, vestigial hindlimb buds prior to developmental arrest are shown (n = 4 embryos analysed at stage 2). Middle and right panels show representative CRM2 and CRM5 LacZ reporter patterns in independent transgenic mouse limb buds for the orthologues from chicken (CRM2 n = 4/4 and CRM5 n = 6/9 expressors), lizard (CRM2 n = 4/4 and CRM5 n = 1/7 expressors) and python (CRM2 n = 8/10 and CRM5 n = 0/5 expressors). Black arrowheads indicate the anterior expansion/shift of CRM2 and CRM5 enhancer activities (in comparison to their mouse counterparts, see e.g. Fig. 4c). Ant: anterior, Dist: distal, Post: posterior, Prox: proximal. c LacZ reporter assays in independent transgenic founder embryos reveal the strong expression of the conserved coelacanth, elephant- and bamboo shark CRM2 and CRM5 core enhancer regions in the distal autopod territory of transgenic mouse limb buds. Transgenic founder embryos with limb bud activities: coelacanth: CRM2 n = 9/10, CRM5 n = 7/8; elephant shark: CRM2 n = 6/6, CMR5 n = 4/4; bamboo shark: CRM2 n = 5/5, CRM5 n = 4/4 of all embryos with LacZ expression in limb and non-limb tissues. The Grem1 expression in the posterior mesenchyme of paired pectoral fin buds of bamboo shark embryos is shown in the lower left panel (n = 2 embryos at slightly different stages, see Supplementary Fig. 9e). Scale bars: 250 μm. The coelacanth and elephant shark schemes are from the open access PhyloPic website (http://phylopic.org); coelacanth: Public Domain Mark 1.0; elephant shark: the Creative Commons Attribution-ShareAlike 3.0 Unported license). The elephant shark scheme was created by Tony Ayling and vectorized by Milton Tan.
Fig. 7
Fig. 7. Mutagenesis of Gli and Hox13 binding sites in the CE region disrupts the bamboo shark CRM2 activity.
a The position of the CE region in the 1214 bp bamboo shark CRM2 transgene construct is shown schematically. The Gli and Hox13 consensus sequences used for binding site identification are shown below the alignment of the CE core region. Within this CE core region, an increased number of highly conserved Gli and Hox13 binding sites are identified by multiple sequence alignment (asterisks indicate the positions of 100% base pair conservation). Therefore, the binding sites for either all Gli (11 binding sites) or Hox13 (10 binding sites), or three regions with overlapping Hox13/Gli binding sites were mutated (all binding sites indicated in bold). The nucleotide changes are indicated in red. be The resulting bamboo shark CRM2 LacZ reporter constructs were analysed in forelimb buds of mouse transgenic founder embryos at ~E11.0. b Analysis of the wild-type bamboo shark CRM2 reveals its robust and strong activity throughout the limb bud mesenchyme (n = 7/7, see also lower panel in Fig. 6c). c Mutation of all Gli binding sites (Glimut) in the CE region disrupts the bamboo shark CRM2 activity in the developing autopod. Variable activities are still detected in the posterior- and anterior-distal limb bud mesenchyme (left panel, n = 5/8). In other forelimb buds, no activity is detected in the autopod primordia (right panel, n = 3/8). d Mutation of all Hox13 binding sites (Hoxmut) disrupts the bamboo shark CRM2 enhancer activity in the autopod (left panel, n = 10/10). However, half of the founder embryos display variable activity in the proximal forelimb bud mesenchyme (right panel, n = 5/10). e Mutation of the three overlapping Gli and Hox13 binding sites (panel a) completely disrupts the CRM2 enhancer activity in forelimb buds of transgenic founder embryos (Gli/Hoxmut, n = 13/15; two embryos retain activity in forelimb buds). The transgenic founder embryos that express LacZ in forelimb buds are indicated as the fraction of all embryos with LacZ expression in limb bud and non-limb bud tissues. Scale bar (panels be): 250 µm.
Fig. 8
Fig. 8. Fish and tetrapod Grem1 expression patterns recapitulate molecular and morphological hallmarks of the fin-to-limb transition.
Upper panels: schematics of the endochondral skeletons (shaded grey) with the appendage (metapterygial) axis indicated by a red dotted line. Lower panels: schematized spatial expression of Grem1 (blue), posterior genes (green: e.g. 5’Hoxd and Hand2 genes) and anterior genes (orange: e.g. Alx4 and Pax9 genes). The expression of posterior genes expands distal-anterior and anterior genes remain more proximally restricted during tetrapod limb bud development. In Chondrichthyes (bamboo shark) Grem1 is expressed in the posterior fin bud overlapping the boundary of posterior and anterior genes. In Sarcopterygii (lungfish) this boundary follows the main appendage axis and Grem1 expression is shifted to the central and distal mesenchyme. In extinct stem tetrapods (Acanthostega) with a polydactylous autopod and distal-anteriorly bent appendage axis, the hypothetical gene expression patterns were extrapolated from polydactylous mouse limbs such as Gli3-deficient mice. It is likely that Grem1 expression extended through the entire autopod as is observed for the activities of the CRM2 enhancer from different basal fishes in transgenic mouse limb buds. In pentadactyl mammals (Mus Musculus), Grem1 expression is activated in the posterior mesenchyme as in fishes but then expands distal-anterior during autopod development.

References

    1. Furlong EEM, Levine M. Developmental enhancers and chromosome topology. Science. 2018;361:1341–1345. doi: 10.1126/science.aau0320. - DOI - PMC - PubMed
    1. Long HannahK, Prescott, Sara L, Wysocka J. Ever-changing landscapes: transcriptional enhancers in development and evolution. Cell. 2016;167:1170–1187. doi: 10.1016/j.cell.2016.09.018. - DOI - PMC - PubMed
    1. Bolt CC, Duboule D. The regulatory landscapes of developmental genes. Development. 2020;147:dev171736. doi: 10.1242/dev.171736. - DOI - PMC - PubMed
    1. Petit F, Sears KE, Ahituv N. Limb development: a paradigm of gene regulation. Nat. Rev. Genet. 2017;18:245–258. doi: 10.1038/nrg.2016.167. - DOI - PubMed
    1. Hong JW, Hendrix DA, Levine MS. Shadow enhancers as a source of evolutionary novelty. Science. 2008;321:1314. doi: 10.1126/science.1160631. - DOI - PMC - PubMed

Publication types

MeSH terms