. 2022 Jan;15(1):96-108.
doi: 10.1038/s41385-021-00455-x. Epub 2021 Sep 21.

Cannabinoids induce functional Tregs by promoting tolerogenic DCs via autophagy and metabolic reprograming

Affiliations

Cannabinoids induce functional Tregs by promoting tolerogenic DCs via autophagy and metabolic reprograming

Alba Angelina et al. Mucosal Immunol. 2022 Jan.

Abstract

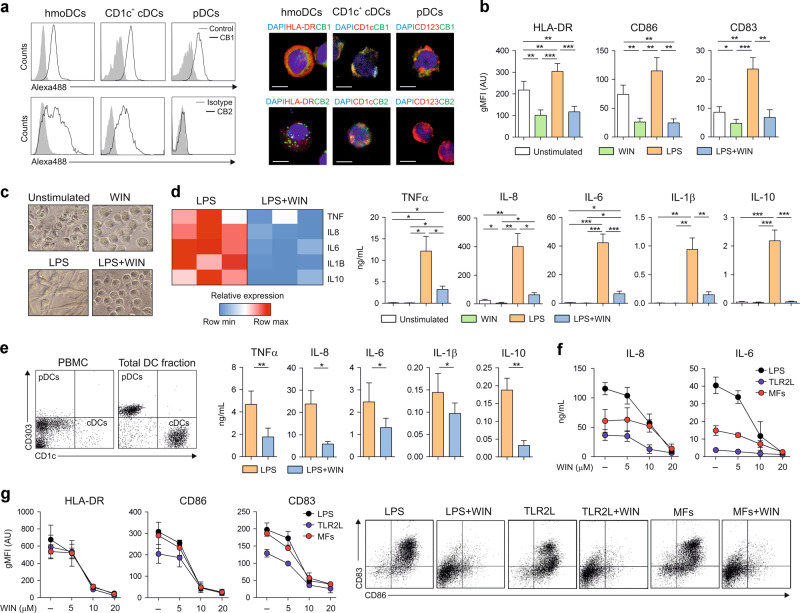
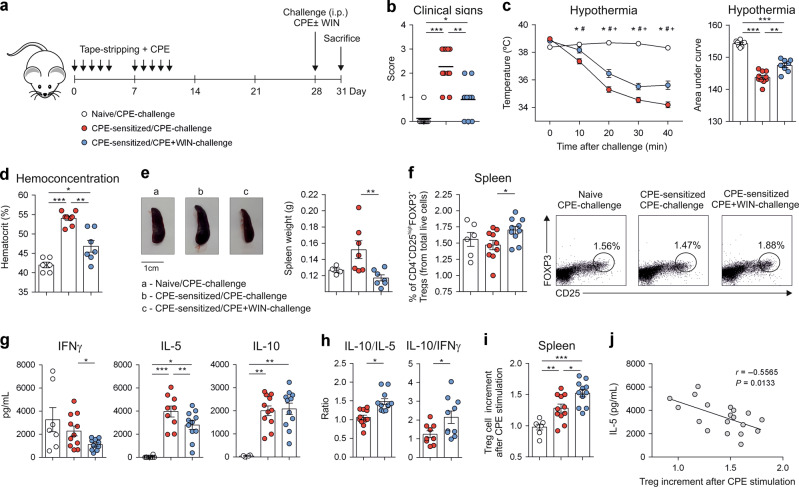
The generation of functional regulatory T cells (Tregs) is essential to keep tissue homeostasis and restore healthy immune responses in many biological and inflammatory contexts. Cannabinoids have been pointed out as potential therapeutic tools for several diseases. Dendritic cells (DCs) express the endocannabinoid system, including the cannabinoid receptors CB1 and CB2. However, how cannabinoids might regulate functional properties of DCs is not completely understood. We uncover that the triggering of cannabinoid receptors promote human tolerogenic DCs that are able to prime functional FOXP3+ Tregs in the context of different inflammatory diseases. Mechanistically, cannabinoids imprint tolerogenicity in human DCs by inhibiting NF-κB, MAPK and mTOR signalling pathways while inducing AMPK and functional autophagy flux via CB1- and PPARα-mediated activation, which drives metabolic rewiring towards increased mitochondrial activity and oxidative phosphorylation. Cannabinoids exhibit in vivo protective and anti-inflammatory effects in LPS-induced sepsis and also promote the generation of FOXP3+ Tregs. In addition, immediate anaphylactic reactions are decreased in peanut allergic mice and the generation of allergen-specific FOXP3+ Tregs are promoted, demonstrating that these immunomodulatory effects take place in both type 1- and type 2-mediated inflammatory diseases. Our findings might open new avenues for novel cannabinoid-based interventions in different inflammatory and immune-mediated diseases.


Conflict of interest statement

C.A. reports grants from Allergopharma, grants from Idorsia, Swiss National Science Foundation, Christine Kühne-Center for Allergy Research and Education, European Commission’s Horison’s 2020 Framework Programme, Cure, Novartis Research Institutes, Astra Zeneca, Scibase, advisory role in Sanofi/Regeneron, grants from Glakso Smith-Kline, advisory role in Scibase. O.P. received research grants from Inmunotek S.L., Novartis and MINECO and fees for giving scientific lectures or participation in Advisory Boards from: Allergy Therapeutics, Amgen, AstraZeneca, Diater, GlaxoSmithKline, S.A, Inmunotek S.L, Novartis, Sanofi-Genzyme and Stallergenes. The rest of authors declare no conflict of interests.

Figures

Fig. 1
Fig. 1. Cannabinoids promote immature and anti-inflammatory human DCs.
a CB1 and CB2 expression in hmoDCs and purified human blood CD1c+ cDCs and pDCs. Representative flow cytometry histograms (left) and confocal images (right). Grey shadowed lines represent the controls and black empty lines represent CB1 or CB2 staining. DAPI (blue), HLA-DR, CD123 or CD1c (red) and CB1 or CB2 (green). White bars, 5 µm. b Geometric mean fluorescence intensity (gMFI) of surface markers after stimulation of hmoDCs with medium (unstimulated), WIN55212-2 (WIN, 10 µM), LPS (0.1 µg/mL) or LPS plus WIN55212-2 for 18 h (n = 8). c Representative images of hmoDC morphology after stimulation with the indicated stimuli. d Left, heatmap of cytokine gene expression after stimulation of hmoDCs with LPS or LPS plus WIN55212-2 for 4 h. Right, cytokine production after stimulation of hmoDCs with the indicated stimuli for 18 h (n = 8). e Left, flow cytometry representative dot plots for pDCs and cDCs in PBMCs and in the total DC fraction. Right, cytokine production after stimulation of total DCs with LPS or LPS plus WIN55212-2 for 18 h (n = 6). f Suppression of cytokine production and (g) gMFI of surface markers after stimulation of hmoDCs with LPS (0.1 µg/mL), TLR2L (25 ng/mL), and maturing factors (MFs: 25 ng/mL IL-1β and 50 ng/mL TNFα) plus different doses of WIN55212-2 for 18 h (n = 3). Representative flow cytometry dot plots for CD86 and CD83 expression are shown. Values are mean ± SEM. Statistical significance was determined using One-way Anova (b, d) or paired t test (e). *P < 0.05, **P < 0.01, ***P < 0.001.
Fig. 2
Fig. 2. Tolerogenic DCs generated via CB1- and PPARα-mediated activation induce functional FOXP3+ Tregs.
a Scheme of coculture experiments. b Cytokines produced by allogeneic naïve CD4+ T cells primed by unstimulated, WIN55212-2 (WIN, 10 µM), LPS (0.1 µg/mL) or LPS plus WIN55212-2-treated hmoDCs after 5 days (n = 8). c Cytokine ratios by primed naïve CD4+ T cells in the indicated conditions (n = 8). d Percentage of induced FOXP3+ Tregs under the indicated conditions (n = 8). Flow cytometry representative dot plots are shown. e Suppression effects of purified induced FOXP3+ Tregs generated by LPS/WIN55212-2-stimulated hmoDCs. f Percentage of induced FOXP3+ Tregs by allogeneic LPS or LPS/WIN55212-2-stimulated total DCs (n = 6). Flow cytometry representative dot plots are shown. g Geometric mean fluorescence intensity (gMFI) of CD83 expression and TNFα and IL-6 production after stimulation of hmoDCs with LPS (0.1 µg/mL) plus WIN55212-2 (10 µM) in the presence of CB1 (Rimonabant (RIM), 20 µM), CB2 (AM630, 20 µM), PPARα (GW6471, 25 µM) and PPARγ (GW9662, 10 µM) antagonists for 18 h (n = 8). h Percentage of FOXP3+ Tregs generated after 5 days by hmoDCs stimulated with the indicated conditions. Values are mean ± SEM. Statistical significance was determined using One-way Anova (b, d, g, h) or Paired t test (c, f). *P < 0.05, **P < 0.01, ***P < 0.001.
Fig. 3
Fig. 3. Triggering of CBRs inhibits inflammatory signalling pathways and promotes autophagy and metabolic rewiring in human DCs.
a Left, western blot of protein extracts from hmoDCs stimulated for 15 min in the indicated conditions. Right, quantification of the reactive phosphorylated bands by scanning densitometry. b TLR2L-induced NFκB/AP-1 activation and IL-8 production by THP1-XBlueTM cells with different doses of WIN55212-2 (WIN) for 18 h (n = 5). c Left, western blot of hmoDCs stimulated for 30 min in the indicated conditions. Right, quantification of the reactive phosphorylated bands by scanning densitometry. d Left, western blot of hmoDCs stimulated for 18 h in the indicated conditions. Right, quantification of the reactive bands by scanning densitometry. e Representative confocal images of LC3 staining of hmoDCs stimulated for 18 h in the indicated conditions. LC3 (green), DAPI (blue). White bars, 5 µm. f Left, western blot of hmoDCs preincubated with chloroquine (CQ) or E64d plus pepstatin A (PA) and stimulated for 18 h with LPS plus WIN55212-2. Right, quantification of the reactive bands by scanning densitometry. g Heatmap of autophagy-related gene expression after stimulation of hmoDCs with LPS or LPS/WIN55212-2 for 4 h. h Quantification of the induced Warburg effect and lactate content in cell-free supernatants relative to unstimulated hmoDCs and glucose consumption determined as metabolic rate of the indicated conditions (n = 8). i Fluorescence intensity of stimulated hmoDCs stained with Mito Tracker Red (n = 8). j Intracellular ATP levels in hmoDCs after 18 h of stimulation with the indicated conditions (n = 6). k Kinetic study of mitochondrial OCR in LPS or LPS/WIN55212-2-stimulated hmoDCs by sequential addition of oligomycin (Olig), FCCP, and rotenone/antimycin A (Rot + AA). Quantification of basal respiration, ATP production coupled respiration and spare respiratory capacity of hmoDCs are included (n = 6 of two independent experiments). l Heatmap of metabolism-related gene expression after stimulation of hmoDCs with LPS or LPS/WIN55212-2 for 4 h. Values are mean ± SEM. Statistical significance was determined using One-way Anova. *P < 0.05, **P < 0.01. p-IKKα/β, phosphorylated-IκB kinase subunits alpha and beta; p-IκB, phosphorylated-inhibitor of NFκB; p-p38, phosphorylated-p38 kinase; p-JNK, phosphorylated-c-Jun N-terminal kinase; p-ERK, phosphorylated-extracellular signal regulated kinase; NFκB, nuclear factor κB; AP-1, activation protein 1; p-Akt, phosphorylated-protein kinase B; p-p70S6K, phosphorylated-p70S6 kinase; p-AMPK, phosphorylated-AMP-activated protein kinase; LC3-I or II, microtubule-associated protein 1 A/1B-light chain 3-I or II; 3-MA, 3-methyladenine; ULK1, Unc-51 like kinase; ATG5 12, 14 or 16 L, autophagy-related gene 5, 14 or 16 L; PIK3C3, phosphatidylinositol 3-kinase catalytic subunit type 3; BECN1, Beclin; RUBCN, Rubicon; GLUT1, glucose transporter 1; HK2, hexokinase 2; PFKFB3, phosphofructokinase 3; LDHA lactate dehydrogenase, HIF1A hypoxia-inducible factor 1 alpha, PDHA pyruvate dehydrogenase, IDH3A isocitrate dehydrogenase, SDHA succinate dehydrogenase, ATP5A1 ATP synthase subunit alpha, PINK1 PTEN-induced kinase 1, ACADM acyl-coenzyme A dehydrogenase, CPT1A carnitine O-palmitoyltransferase 1, GLS glutaminase, SLC1A3 amino acid transporter 1.
Fig. 4
Fig. 4. CBRs-induced autophagy drives metabolic reprogramming and human tolerogenic DCs generation.
a Gene expression levels of hmoDCs stimulated with LPS (0.1 µg/mL) plus WIN55212-2 (WIN, 10 µM) or in the presence of the autophagy inhibitor 3-methyladenine (3-MA, 25 µM) relative to LPS-stimulated condition (n = 5). b Cytokines produced by naïve CD4+ T cells primed by hmoDCs stimulated in the indicated conditions after 5 days (n = 6). c Increment in FOXP3+ Tregs generation relative to LPS-stimulation condition. d Flow cytometry representative dot plots. e Quantification of the induced Warburg effect and lactate content in cell-free supernatants relative to LPS stimulation (n = 6). f Glucose consumption determined as metabolic rate of the indicated conditions (n = 6). g Fluorescence intensity of hmoDCs stained with Mito Tracker Red relative to LPS-stimulated condition (n = 6). h Left, western blot of hmoDCs stimulated with LPS, LPS/WIN55212-2 or LPS/WIN55212-2 in the presence of CB1 (Rimonabant, (RIM), 10 µM) and PPARα (GW6471, 25 µM) antagonists for 18 h. Right, quantification of the reactive bands by scanning densitometry. i Quantification of the induced Warburg effect, metabolic rate and fluorescence intensity of Mito Tracker Red stained cells in hmoDCs relative to LPS stimulation (n = 6). Values are mean ± SEM. Statistical significance was determined using One-way Anova. *P < 0.05, **P < 0.01.
Fig. 5
Fig. 5. Cannabinoids protect against LPS-induced sepsis in BALB/c mice.
a Survival rate of mice treated with WIN55212-2 (WIN, 5 mg/kg), LPS (20 mg/kg), LPS/WIN55212-2 and LPS/WIN55212-2 in the presence of the autophagy inhibitor 3-MA (15 mg/kg) or CB1 (Rimonabant (RIM), 5 mg/kg) and PPARα (GW6471 (GW6), 5 mg/kg) antagonists monitored for 78 h (n = 10 of two independent experiments). b Body weight after 24 h of the indicated treatment (n = 4–9 of two independent experiments). c Serum and bronchoalveolar lavage fluid (BALF) IL-6 levels after 16 h of the indicated treatment (n = 6–11 of two independent experiments). d Left, flow cytometry representative dot plots of spleen DCs. Right, percentage of spleen CD11c+ MHCII+ DCs from mice treated with the indicated conditions for 16 h (n = 7–8 of two independent experiments). e Geometric mean fluorescence intensity (gMFI) of CD86 expression in spleen CD11c+ MHCII + DCs from mice treated with the indicated conditions for 16 h. f mRNA expression levels of the cytokines IL-6 and IL-10 and autophagy-related genes ATG5, ATG12, AG14 and LC3A in isolated spleen DCs from mice treated with the indicated conditions. Data were obtained from a pull of spleen DCs from four mice treated with the same stimuli. One representative example of two independent experiments is shown. g gMFI of CYTO-ID green dye in spleen DCs from mice treated with the indicated conditions (n = 4 of two independent experiments). h Assessment score of physical appearance 3 days after the treatment with WIN55212-2 (5 mg/kg), LPS (10 mg/kg), LPS/WIN55212-2 and LPS/WIN55212-2 in the presence of the autophagy inhibitor 3-MA (15 mg/kg) or CB1 (Rimonabant (RIM), 5 mg/kg) and PPARα (GW6471 (GW6) 5 mg/kg) antagonists (n = 7 of two independent experiments). i Left, spleen weight from mice treated with the indicated conditions after 3 days (n = 5–7 of two independent experiments). Right, representative examples of spleen sizes. j Percentage of FOXP3+ Tregs in spleen from mice treated with the indicated stimuli (n = 6–8 of two independent experiments). k Assessment score of physical appearance 3 days after the treatment with LPS (10 mg/kg) and LPS/WIN55212-2 (WIN, 5 mg/kg) in Treg depleted mice with anti-CD25 antibody (n = 4 of one independent experiment). l Spleen weight from Treg depleted mice treated with the indicated conditions after 3 days (n = 4 of one independent experiment). m Percentage of FOXP3+ Tregs in spleen from Treg depleted mice treated with the indicated stimuli (n = 4 of one independent experiment). Values are mean ± SEM. Statistical significance was determined using One-way Anova. *P < 0.05, **P < 0.01, ***P < 0.001.
Fig. 6
Fig. 6. Cannabinoids reduce anaphylaxis in peanut sensitised BALB/c mice.
a Scheme of the epicutaneous sensitisation protocol; i.p., intraperitoneally. b Clinical signs observed after challenge with crude peanut extract (CPE, 2.5 g/mouse) or CPE plus WIN55212-2 (WIN, 20 µg/mouse). c Left, changes in body temperature 40 min after challenge. *Naïve vs CPE-Sensitised/CPE Challenge, #CPE-Sensitised/CPE Challenge vs CPE-Sensitised/CPE + WIN55212-2 Challenge, + Naïve vs CPE-Sensitised/CPE + WIN55212-2 Challenge. Right, area under the curve (temperature vs time) of the indicated conditions. d Hemoconcentration 40 min after challenge. e Left, one representative example of spleen size and right, spleen weight 72 h after challenge. f Left, percentage of spleen FOXP3+ Tregs in the indicated conditions. Right, Flow cytometry representative dot plots of generated splenic FOXP3+ Tregs. g Cytokine production and (h) cytokine ratios by splenocytes from the indicated mice, stimulated in vitro with CPE (250 µg/mL) for 4 days. i Increment of FOXP3+ Tregs generation after in vitro CPE stimulation for 4 days relative to unstimulated condition. j Negative correlation of increased Tregs with IL-5 levels produced by CPE-stimulated splenocytes. Values are the mean ± SEM. n = 5–10 of two independent experiments. Statistical significance was determined using One-way Anova and Spearman test (j): *P < 0.05, **P < 0.01 and ***P < 0.001.

References

    1. Wculek SK, et al. Dendritic cells in cancer immunology and immunotherapy. Nat. Rev. Immunol. 2020;20:7–24. - PubMed
    1. Lucca, L. E. & Dominguez-Villar, M. Modulation of regulatory T cell function and stability by co-inhibitory receptors. Nat. Rev. Immunol.20, 680–693 (2020). - PubMed
    1. Wing JB, Tay C, Sakaguchi S. Control of regulatory T cells by co-signal molecules. Adv. Exp. Med. Biol. 2019;1189:179–210. - PubMed
    1. Palomares O, Akdis M, Martin-Fontecha M, Akdis CA. Mechanisms of immune regulation in allergic diseases: the role of regulatory T and B cells. Immunol. Rev. 2017;278:219–236. - PubMed
    1. Abbas AK, et al. Regulatory T cells: recommendations to simplify the nomenclature. Nat. Immunol. 2013;14:307–308. - PubMed

Publication types

MeSH terms