. 2021 Oct;6(10):1233-1244.
doi: 10.1038/s41564-021-00972-2. Epub 2021 Sep 21.

Genetic and structural basis for SARS-CoV-2 variant neutralization by a two-antibody cocktail

Affiliations

Genetic and structural basis for SARS-CoV-2 variant neutralization by a two-antibody cocktail

Jinhui Dong et al. Nat Microbiol. 2021 Oct.

Abstract

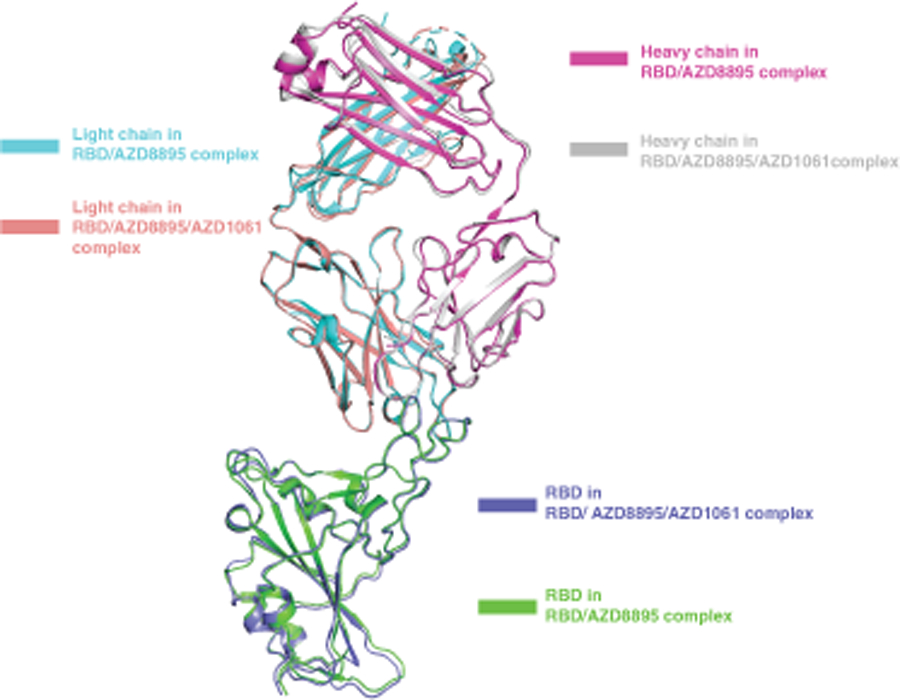
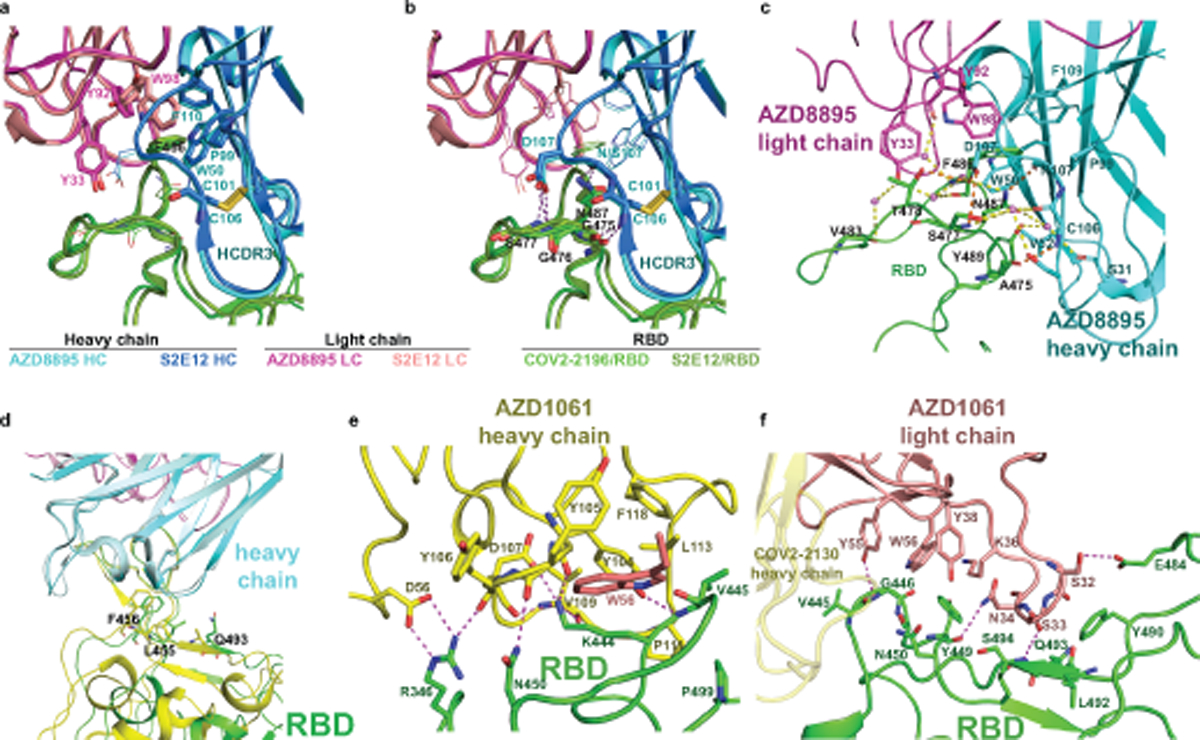
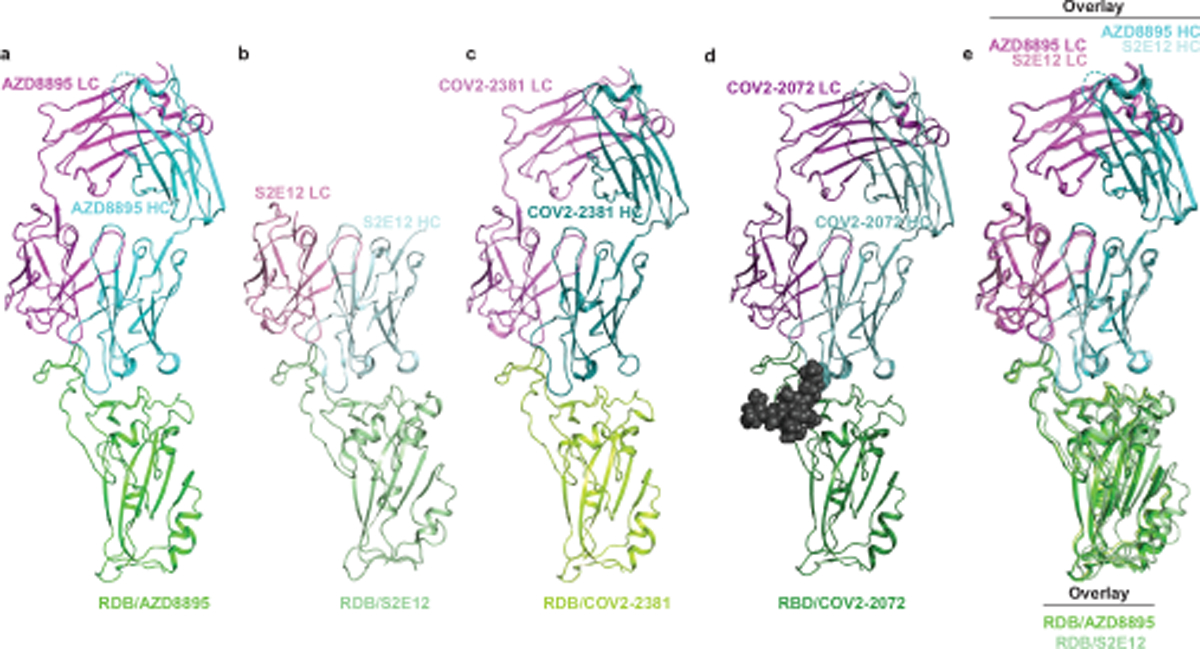
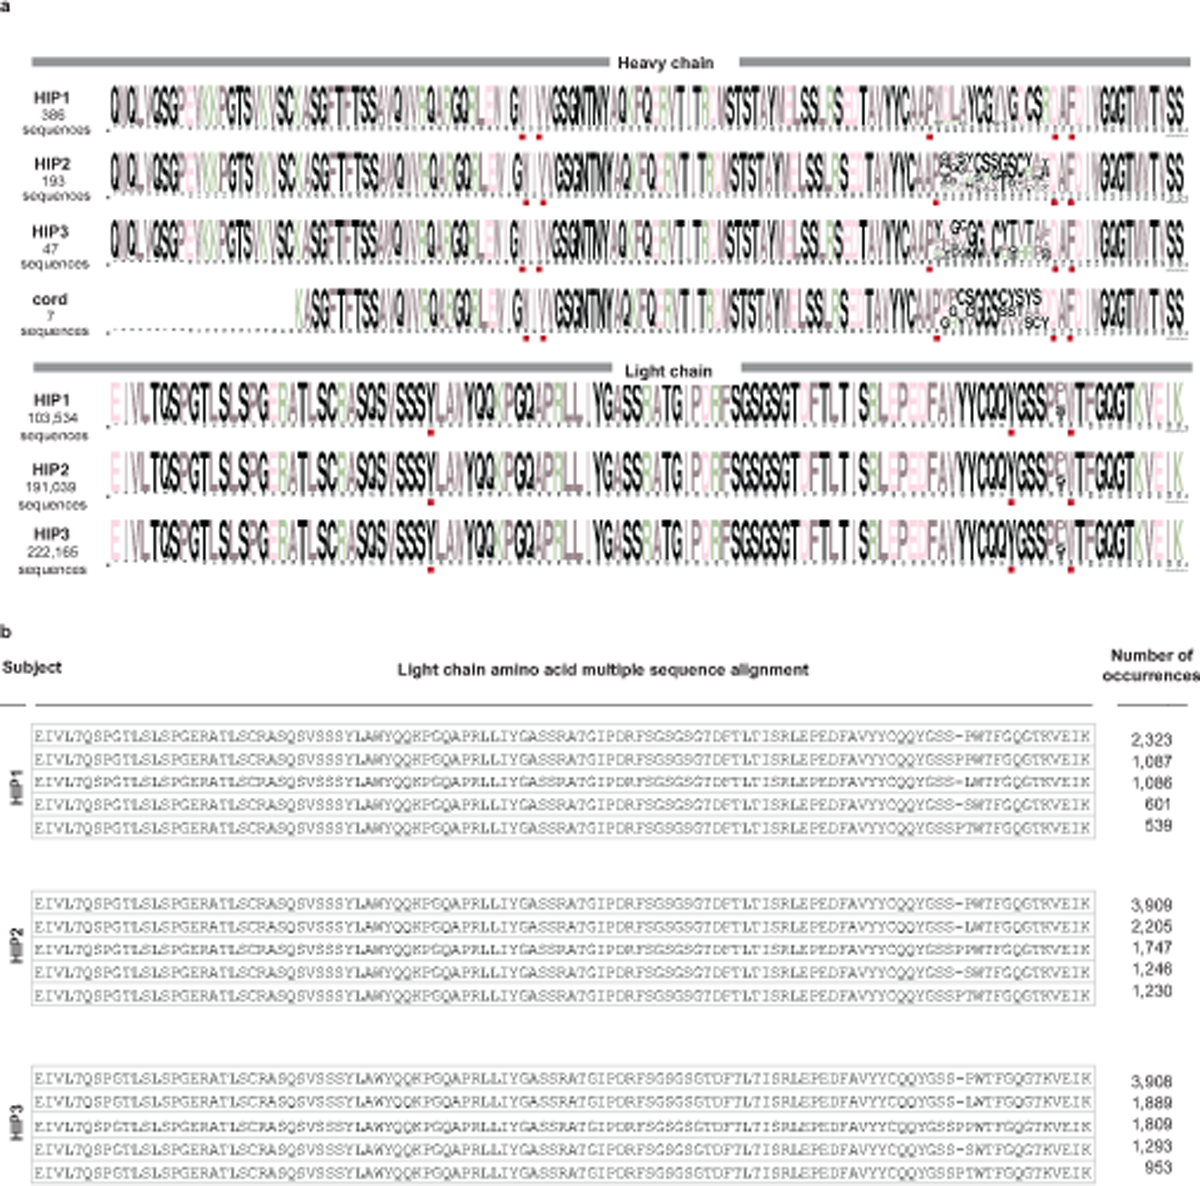
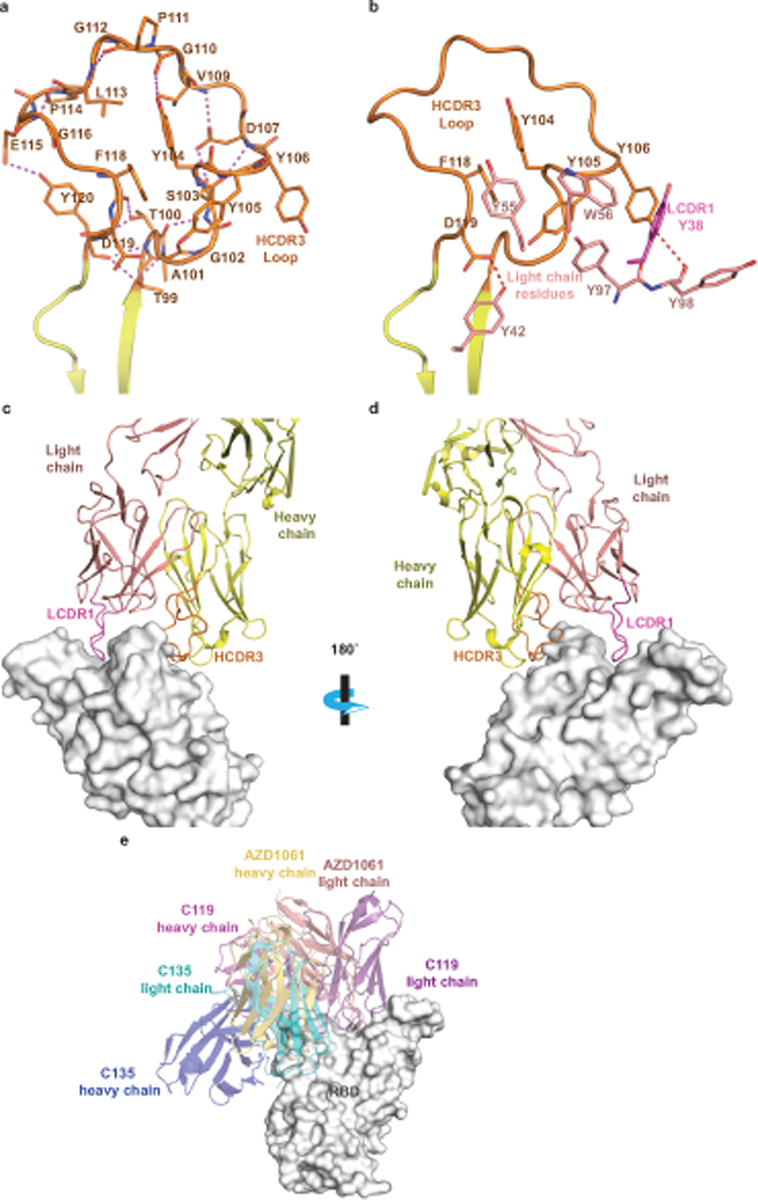
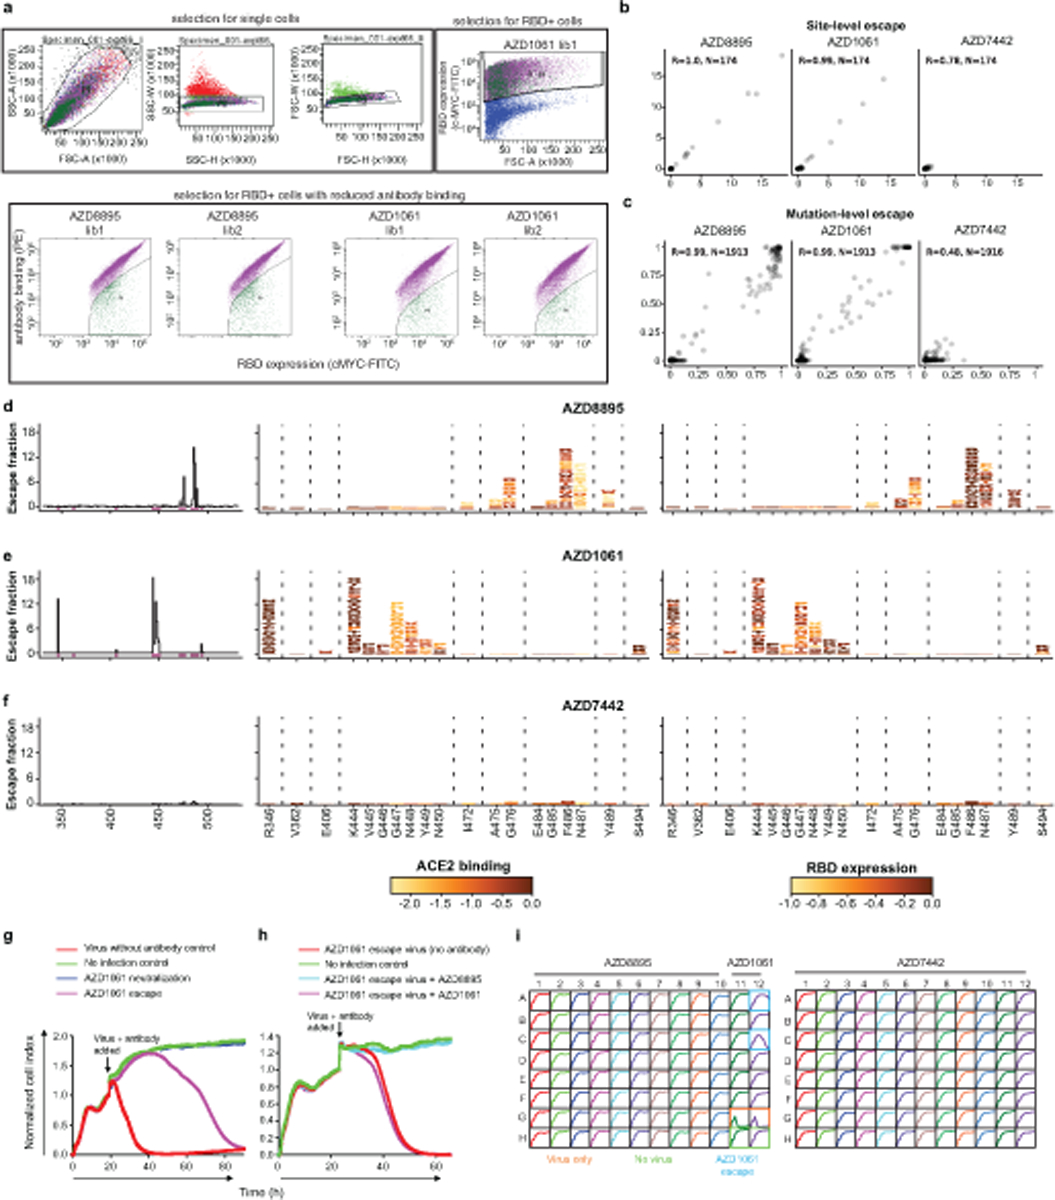
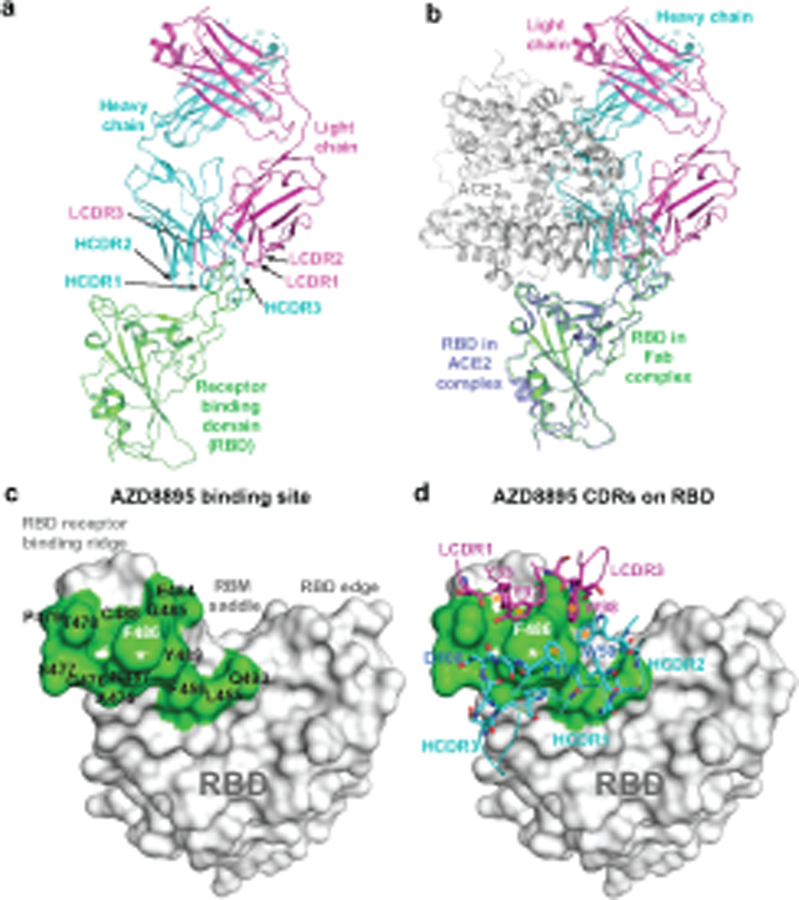
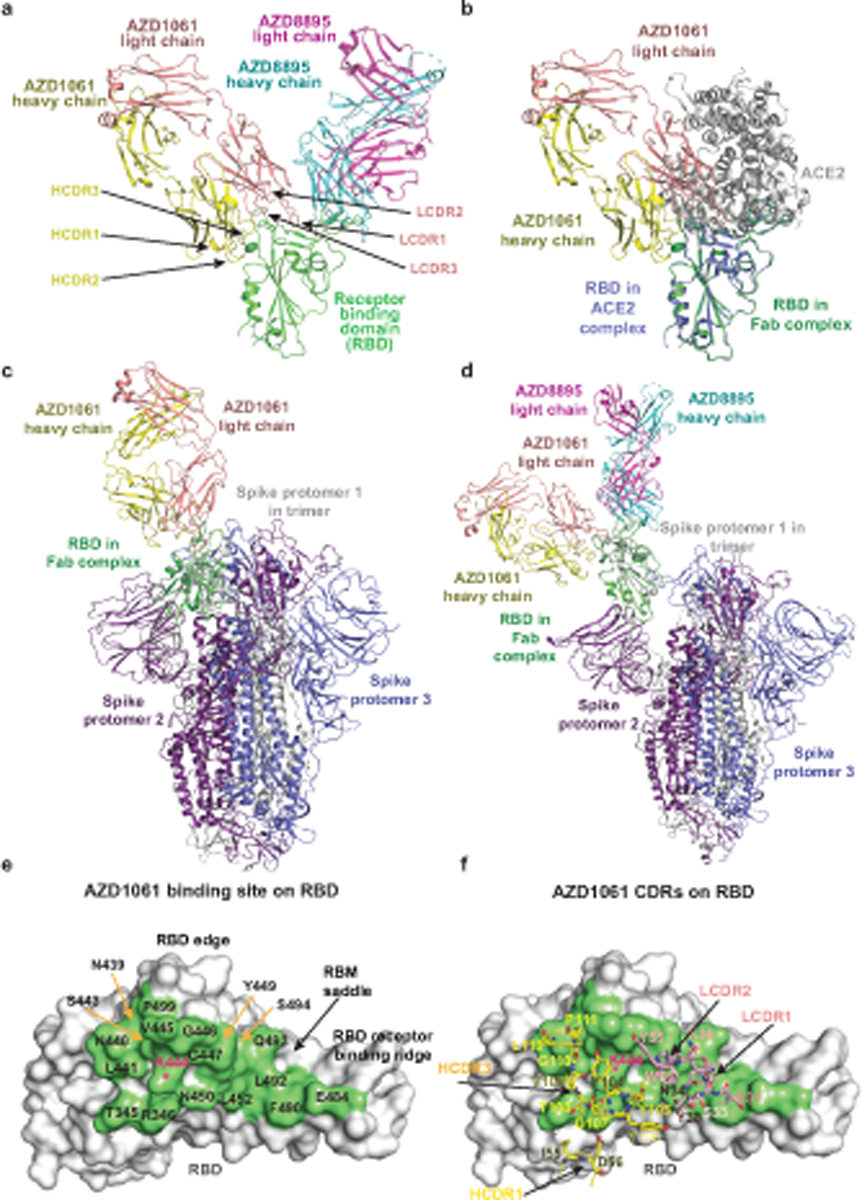
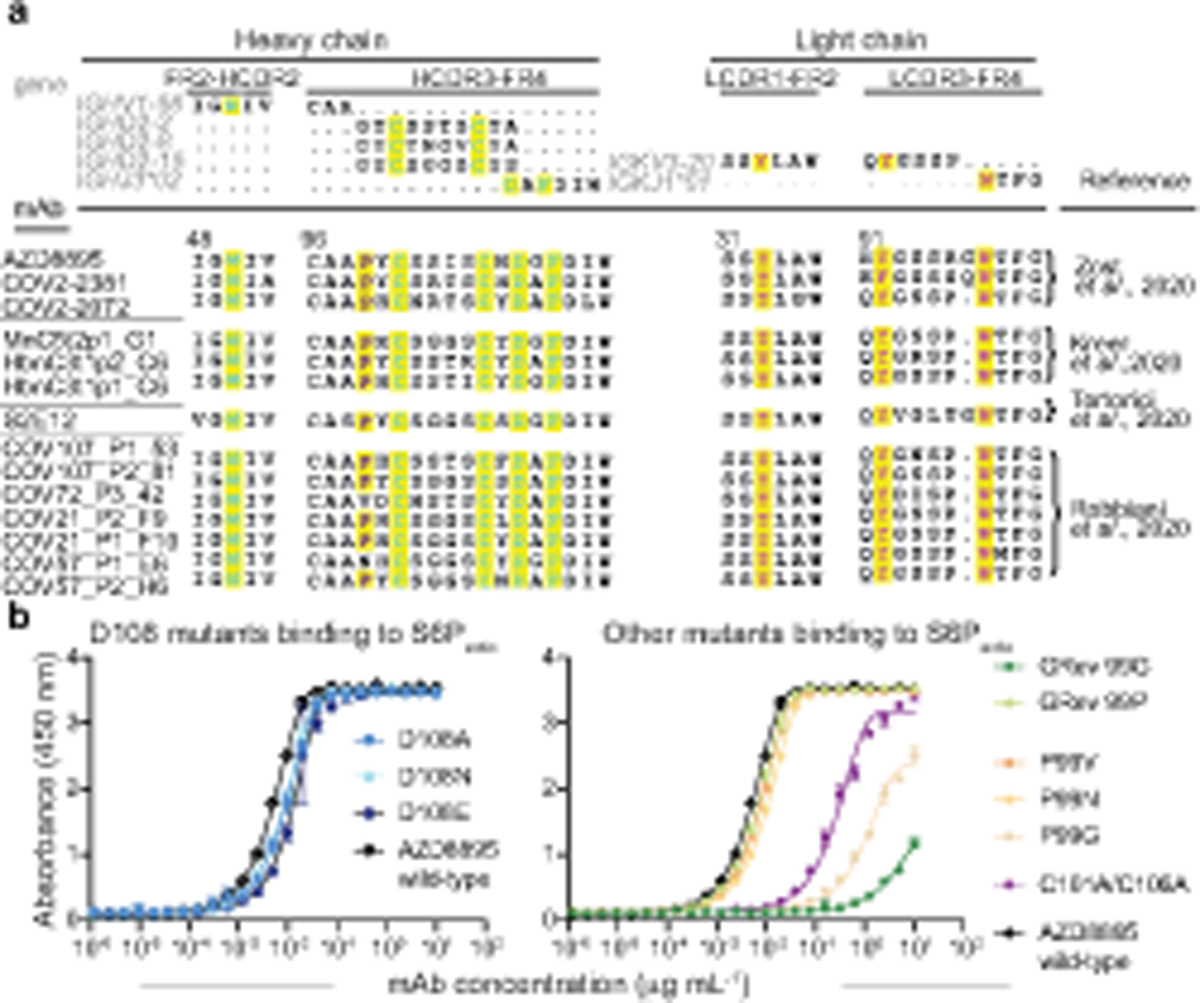
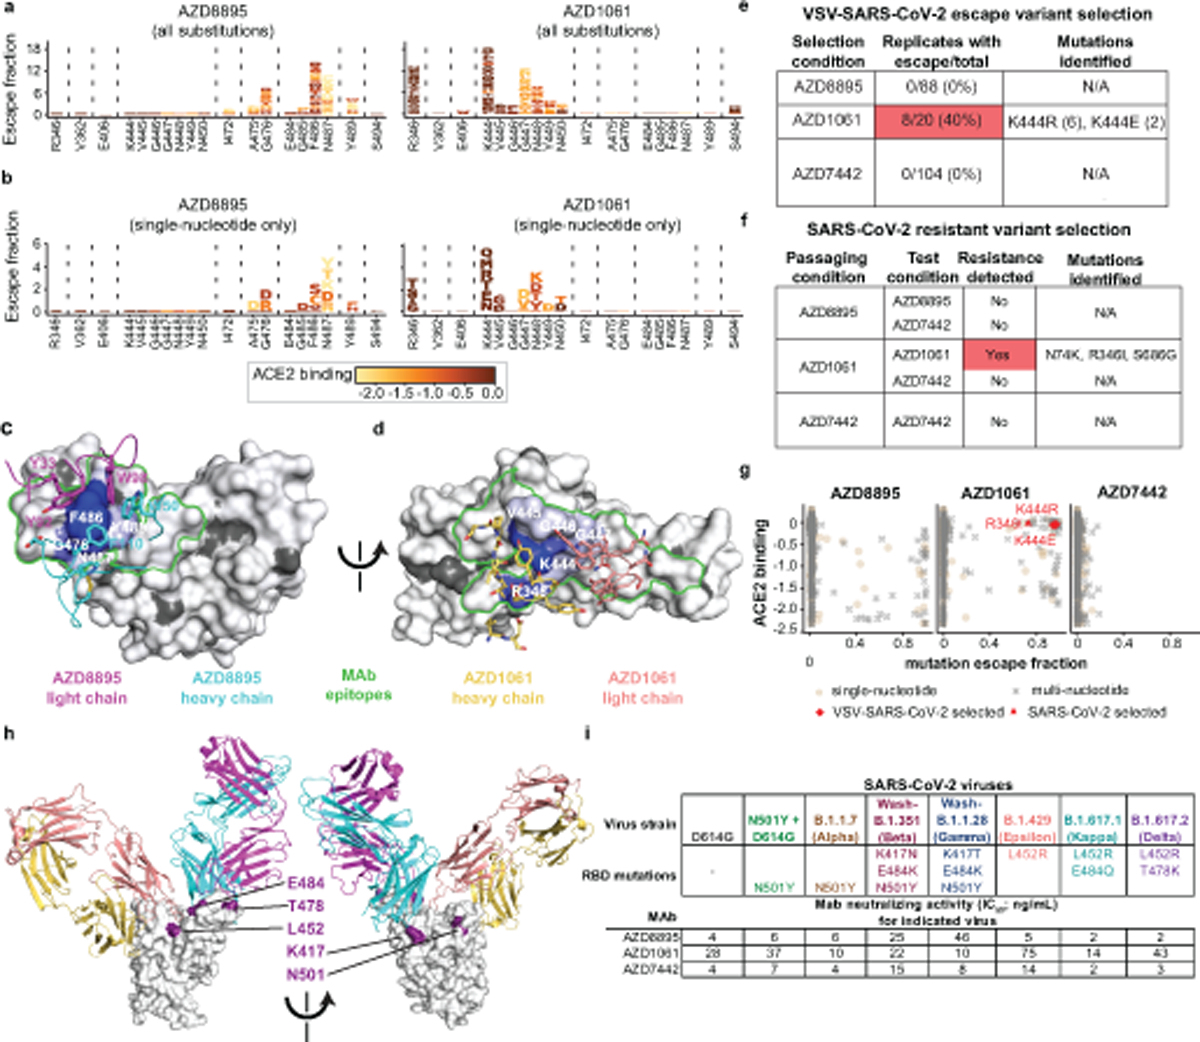
Understanding the molecular basis for immune recognition of SARS-CoV-2 spike glycoprotein antigenic sites will inform the development of improved therapeutics. We determined the structures of two human monoclonal antibodies-AZD8895 and AZD1061-which form the basis of the investigational antibody cocktail AZD7442, in complex with the receptor-binding domain (RBD) of SARS-CoV-2 to define the genetic and structural basis of neutralization. AZD8895 forms an 'aromatic cage' at the heavy/light chain interface using germ line-encoded residues in complementarity-determining regions (CDRs) 2 and 3 of the heavy chain and CDRs 1 and 3 of the light chain. These structural features explain why highly similar antibodies (public clonotypes) have been isolated from multiple individuals. AZD1061 has an unusually long LCDR1; the HCDR3 makes interactions with the opposite face of the RBD from that of AZD8895. Using deep mutational scanning and neutralization escape selection experiments, we comprehensively mapped the crucial binding residues of both antibodies and identified positions of concern with regards to virus escape from antibody-mediated neutralization. Both AZD8895 and AZD1061 have strong neutralizing activity against SARS-CoV-2 and variants of concern with antigenic substitutions in the RBD. We conclude that germ line-encoded antibody features enable recognition of the SARS-CoV-2 spike RBD and demonstrate the utility of the cocktail AZD7442 in neutralizing emerging variant viruses.


Conflict of interest statement

Competing interests: T.B., K.T., H.B., Y.M-L., P.M., and M.E. are employees of and may own stock in AstraZeneca. M.S.D. is a consultant for Inbios, Vir Biotechnology, Fortress Biotech, and Carnival Corporation and on the Scientific Advisory Boards of Moderna and Immunome. The Diamond laboratory has received funding support in sponsored research agreements from Moderna, Vir Biotechnology, and Emergent BioSolutions. J.E.C. has served as a consultant for Luna Biologics, is a member of the Scientific Advisory Boards of CompuVax and Meissa Vaccines and is Founder of IDBiologics. The Crowe laboratory at Vanderbilt University Medical Center has received sponsored research agreements from Takeda Vaccines, IDBiologics, and AstraZeneca. Vanderbilt University has applied for patents concerning antibodies that are related to this work; Vanderbilt University has licensed certain rights to antibodies described in this paper to Astra Zeneca. All other authors declare no competing interests.

Figures

Extended Data Fig. 1.
Overlay of substructure of RBD/AZD8895 in RBD/AZD8895/AZD1061 complex and RBD/AZD8895 crystal structure.
Extended Data Fig. 2.
Extended Data Fig. 2.. Similarities in structural details of interactions between RBD and AZD8895, AZD1061 and those seen in the spike/S2E12 complex.
a. Similar aromatic stacking and hydrophobic interaction patterns at the RBD site F486 shared between RBD/AZD8895 and spike/S2E12 complexes. b. Same hydrogen bonding pattern surrounding residue F486 in the structures of the RBD/AZD8895 and spike/S2E12 complexes . c. Detailed interactions between AZD8895 and RBD. AZD8895 heavy chain is colored in cyan, the light chain is colored in magenta, and RBD is colored in green. Important interacting residues are shown in stick representation. Water molecules involved in antibody-RBD interaction are represented as pink spheres. Direct hydrogen bonds are shown as orange dashed lines, and water-mediated hydrogen bonds as yellow dashed lines. d. Superimposition of RBD/S2E12 cryo-EM structure onto the RBD/AZD8895 crystal structure, with the variable domains of antibodies as references. AZD8895 heavy chain is in cyan, and its light chain in magenta; S2E12 heavy chain is in pale cyan, and its light chain in light pink. The two corresponding RBD structures are colored in green or yellow, respectively. e. Detailed interactions between AZD1061 heavy chain and RBD. Paratope residues are shown in stick representation and colored in yellow, epitope residues in green sticks. Hydrogen-bonds or strong polar interactions are represented as dashed magenta lines. f. Detailed interactions between AZD1061 light chain and RBD. Paratope residues are shown in stick representation and colored in orange, epitope residues in green sticks. Hydrogen-bonds are represented as dashed magenta lines.
Extended Data Fig. 3.
Extended Data Fig. 3.. A common clonotype of anti-RBD antibodies with the same binding mechanism.
a. RBD/AZD8895 crystal structure. b. RBD/S2E12 cryo-EM structure. c. RBD/COV2–2381 homology model generated with Structuropedia. COV2–2072 encodes an N-linked glycosylation sequon in the HCDR3, indicated by the gray spheres, which was modeled using the GlyProt webserver. d. RBD/COV2–2072 homology model generated with Structuropedia. e. Overlay of the RBD/AZD8895 crystal structure (a) and RBD/S2E12 cryo-EM structure (b).
Extended Data Fig. 4.
Extended Data Fig. 4.. Identification of putative public clonotype members genetically similar to AZD8895 in the antibody variable gene repertoires of virus-naïve individuals.
Antibody variable gene sequences collected from healthy individuals (HIP1, 2, or 3) prior to the pandemic with the same sequence features as AZD8895 heavy chain and light chain are aligned. a. WebLogo plots of heavy chain (top) and light chain (bottom) sequences from three different adult donors and cord blood samples with the features of the public clonotype. The sequence features and contact residues used in AZD8895 are highlighted in red boxes below each multiple sequence alignment. b. Since the light chain plots in (a) showed restricted diversity, here we show amino acid alignments for the top five representative light chains that occurred most frequently in the three adult donors studied (HIP1, 2, or 3).
Extended Data Fig. 5.
Extended Data Fig. 5.. Details of AZD1061 interaction with SARS-CoV-2 S protein RBD.
a. Detailed AZD1061 HCDR3 loop structure. Short-range hydrogen bonds, stabilizing the loop conformation, are shown as dashed magenta lines. b.Residues of AZD1061 light chain form aromatic stacking interactions and hydrogen bonds with HCDR3 to further stabilize the HCDR3 loop. LCDR1 residue Y38 is colored in magenta to match the LCDR1 coloring in panels (c) and (d). c. Long LCDR1, HCDR2, and HCDR3 form complementary binding surface to the RBD epitope. RBD is shown as surface representation in grey. AZD1061 heavy chain is colored in yellow with HCDR3 in orange, and the light chain in pink with LCDR1 in magenta. d. 180° rotation view of panel c. e. Comparison of AZD1061 binding with the previously published mAbs C119 and C135.
Extended Data Fig. 6.
Extended Data Fig. 6.. Interface between AZD8895 and AZD1061 in the RBD/AZD8895/AZD1061 crystal structure.
AZD8895 heavy or light chain are shown as cartoon representation in cyan or magenta, respectively, and AZD1061 heavy or light chains in yellow or pink, respectively. The RBD is colored in green. Interface residues are shown in stick representation.
Extended Data Fig. 7.
Extended Data Fig. 7.. Identification by deep mutational scanning of mutations affecting antibody binding and method of selection of antibody resistant mutants with VSV-SARS-CoV-2 virus.
a. Top: Plots showing gating strategy for selection of single yeast cells using forward- and side-scatter (first three panels) or RBD expression (right panel). Each plot is derived from the preceding gate. Bottom: Plots showing gating for RBD+, antibody yeast cells. Selection experiments are shown for AZD8895 or AZD1061 - two independent libraries each. b. Correlation of sites of escape between yeast library selection experiments. The x-axes show cumulative escape fraction for each site for library 1, and the y-axes show cumulative escape fraction for each site for library 2. Correlation coefficient and n are denoted for each graph. c. Correlation of observed mutations that escape antibody binding between yeast library selection experiments. The x-axes show each amino acid mutation’s escape fraction for library 1, and the y-axes show each amino acid mutation’s escape fraction for library 2. Correlation coefficient and n are denoted for each graph. d–f. DMS results for AZD8895 (d), AZD1061 (e), or AZD7442 (f). Left panels: sites of escape across the entire RBD indicated by peaks that correspond to the logo plots in the middle/right panels. Middle panel: logo plot of cumulative escape mutation fractions of all RBD sites with strong escape mutations. Mutations are colored based on degree to which they abrogate RBD binding to hACE2. Right: logo plots show cumulative escape fractions, but colored based on degree to which mutations affect RBD expression. g. RTCA sensograms showing neutralization escape. Cytopathic effect was monitored kinetically in cells inoculated with virus in the presence of 5 μg/mL AZD1061. Representative escape (magenta) or lack of escape (blue) are shown. Green - uninfected cells; red -cells inoculated with virus without antibody. Magenta/blue curves - a single representative well; red/green controls - mean of technical duplicates. h. Representative RTCA sensograms validating that a virus selected by AZD1061 in (g) escaped AZD1061 (magenta) but not AZD8895 (light blue). i. Example sensograms from wells of 96-well E-plate analysis for escape selection. Instances of escape from AZD1061 are noted, while escape was not detected in the presence of AZD8895 or AZD7442. Positive and negative controls are denoted on the first plate.
Extended Data Fig. 8.
Extended Data Fig. 8.. Antibody resistant mutants selected with VSV-SARS-CoV2 or authentic SARS-CoV-2 virus.
a. The method for assessing monoclonal antibody resistant spike protein variants is shown. SARS-CoV-2 was passaged serially in the presence of monoclonal antibodies at the increasing concentrations indicated in the figure or without antibody (no monoclonal antibody). Following passage at IC90 concentrations, samples were treated with 10× IC90 concentrations of monoclonal antibodies and any resultant resistant virus collected, and the genome was sequenced. Red viruses in the schematic represent selection of escape variants. b. The escape phenotype of 6 independent plaques selected with AZD1061 was validated by demonstration of escape by testing in a PRNT. Antibody neutralization as measured by PRNT against the 6 plaque-purified, AZD1061-resistant SARS-CoV-2 viruses (blue) was compared to the parent virus WA-1 (orange) during treatment with AZD1061 or AZD7442. All plaque-purified viruses resulted from the same monoclonal antibody passage as detailed in (a). Data shown are from a single technical replicate for each of the six selected escape mutants. c,d. The escape phenotype of independent plaques selected with AZD1061 also was validated by demonstration of loss of binding to proteins incorporating variant residues in the selected plaques using biolayer interferometry (BLI). Data shown are from a single experiment. c. Binding traces of AZD8895 and AZD1061 to various spike trimers with kinetics curve fits. An inability to fit AZD1061 binding to the K444E S variant is due to a lack of detectable binding even at 5 µM for AZD1061. d. Summary of AZD8895 and AZD1061 kinetic binding values to the S trimer variants from binding traces with R2 indicating goodness of the fit. Relative fold-change in KD is shown in comparison to wild-type. No detectable binding is indicated as NB.
Fig. 1.
Fig. 1.. Crystal structure of S protein RBD in complex with Fab AZD8895.
a. Cartoon representation of AZD8895 in complex with RBD. AZD8895 heavy chain is shown in cyan, light chain in magenta, and RBD in green. b. Structure of AZD8895-RBD complex is superimposed onto the structure of RBD/human ACE2 complex (PDB ID: 6M0J), using the RBD structure as the reference. The color scheme of RBD/AZD8895 complex is the same as that in Fig. 1a. The RBD in the RBD/ACE2 complex is colored in blue, the human ACE2 peptidase domain in grey. c. Structure of the RBD/AZD8895 complex is superimposed onto the structure of spike with single RBD in the “up” conformation (PDB ID: 6XM4), using the RBD in “up” conformation as the reference. The color scheme of the RBD/AZD8895 complex is the same as that in Fig. 1a. The three subunits of spike are colored in grey, yellow, or blue respectively (the subunit with its RBD in “up” conformation is yellow). d. Surface representation of RBD epitope recognized by AZD8895. The epitope residues are colored in different shades of green and labeled in black with the critical contact residue F486 labled in white. e. Antibody-antigen interactions between AZD8895 and RBD. RBD is shown in the same surface representation and orientation as that in Fig. 1d. AZD8895 paratope residues are shown in stick representation. The heavy chain is colored in cyan, and light chain is colored in magenta. Aromatic cage residues Y33, Y92, W98, F110, and W50 are all colored with darker shades of blue or purple, and labelled with an orange star.
Fig. 2.
Fig. 2.. Crystal structure of S protein RBD in complex with both Fabs AZD8895 and AZD1061.
a. Cartoon representation of crystal structure of S protein RBD in complex with AZD8895 and AZD1061 Fabs. RBD is shown in green, AZD8895 heavy chain in cyan, AZD8895 light chain in magenta, AZD1061 heavy chain in yellow, and AZD1061 light chain in pink. CDRs of AZD1061 are labeled. b. Structure of RBD/AZD1061 complex is superimposed onto the structure of the RBD/ACE2 complex (PDB ID: 6M0J), using the RBD structure as the reference. The color scheme of the RBD/AZD1061 complex is the same as that in Fig. 2a. The RBD in the RBD/ACE2 complex is colored in blue, the human ACE2 peptidase domain in grey. c. Structure of RBD/AZD1061 complex is superimposed onto the structure of spike with all RBD in “down” conformation (PDB ID: 6ZOY), using the RBD in one protomer as the reference. The color scheme of RBD/AZD1061 complex is the same as that in Fig. 2a. The three protomers of spike are colored in grey, blue, or purple respectively. d. Structure of the RBD/AZD8895/AZD1061 complex is superimposed onto the structure of spike with one RBD in “up” conformation (PDB ID: 7CAK), using the RBD in “up” conformation as the reference. The color scheme of RBD/AZD1061 complex is the same as that in Fig. 2a. The three protomers of spike are colored in grey, blue, or purple respectively. e. Surface representation of RBD epitope recognized by AZD1061. The epitope residues are indicated in different colors and labeled in black; the key residue K444 is labelled in red. f. Interactions of AZD1061 paratope residues with the epitope. RBD is shown in the same surface representation and orientation as those in Fig. 2e. The paratope residues are shown in stick representation. The heavy chain is colored in yellow, and the light chain in orange. The key residue K444 is labelled in red.
Fig. 3.
Fig. 3.. Characterization of important sequence features of the AZD8895 public clonotype
a. IMGT/DomainGapAlign results of AZD8895 heavy and light chains with germline V (IGHV1–58 and IGLV3–20), D (IGHD2–2, IGHD 2–8, or IGHD 2–15) or J (IGHJ3*02 and IGKJ1*01) gene segments and with representative variable gene sequences of mAbs in this public clonotype. Key interacting residues and their corresponding residues in germline genes are highlighted in yellow and colored in blue except for P99 in purple (heavy chain) or in red (light chain). b. Binding curves of point mutants of AZD8895. Mutants of D108 residue are in blue, revertant mutation of inferred somatic mutations to germline sequence (GRev) are in green, P99 mutants are in orange, and C101A/C106A mutations removing the disulfide bond in HCDR3 is in purple. Data points show the mean ± SD for each tested antibody dilution. Experiments were performed in technical triplicate, with data shown from a single experiment repeated twice. Data for the AZD8895 wild-type binding curve shown in both panels are from the same experiment.
Fig. 4.
Fig. 4.. Critical residues for AZD8895 and AZD1061 binding.
a. Logo plots of mutation escape fractions at RBD sites with strong escape for AZD8895 (left) or AZD1061 (right). Taller letters indicate greater escape. Mutations colored by degree to which they reduce RBD binding to hACE2. Data shown are the average of two independent escape experiments using two independent yeast libraries; correlations are shown in Extended Data Fig. 7b,c. Interactive plots - https://jbloomlab.github.io/SARS-CoV-2-RBD_MAP_AZ_Abs/. b. Logo plots of mutation escape fractions for that are accessible by single nucleotide substitutions from the Wuhan-Hu-1 reference strain (e,f). Effect represented as in Fig. 4a. c. Mapping DMS escape mutations for AZD8895 onto the RBD surface. Blue - RBD site with the greatest cumulative antibody escape; white - no escape detected. Grey - residues where deleterious effects on RBD expression prevented assessment. Heavy chain, cyan; light chain, magenta. Two replicates were performed with independent libraries, as described in (a). Green - structurally-defined AZD8895 footprint on RBD. d. Mapping DMS escape mutations for AZD1061 onto the RBD surface in the RBD/AZD1061 structure. Mutations that abrogate AZD1061 binding are displayed on the RBD structure using a heatmap as in Fig. 4c. Heavy chain, yellow; light chain pink. Green - structurally-defined AZD1061 footprint on RBD. e. Table showing the results of VSV-SARS-CoV-2 escape selection experiments. f. Table showing the results of passage of SARS-CoV-2 in the presence of sub-neutralizing concentrations of mAbs. g. Scatter plot showing DMS data from (a), with mutation escape fraction on the x-axis and effect on ACE2 binding on the y-axis. Crosses - mutations accessible only by multi-nucleotide substitutions; circles - mutations accessible by single-nucleotide substitution. Substitutions selected by AZD1061 in VSV-SARS-CoV-2 (K444R, K444E) or authentic SARS-CoV-2 (R346I) are denoted. h. Locations of mutations in VOCs/VOIs mapped onto the RBD/AZD8895/AZD1061 crystal structure. i. Neutralization (FRNT) against SARS-CoV-2 VOC/VOIs. Assays were performed in duplicate, repeated twice. Data are the mean of the two independent experiments. Wash-B.1.351 refers to a chimeric, recombinant virus with the WA1/2020 backbone expressing the B.1.351 (Beta) spike gene; Wash-B.1.1.28 refers to a similar virus expressing the B.1.1.28 [P1] (Gamma) spike gene.

Update of

Similar articles

Cited by

References

    1. Hoffmann M et al. SARS-CoV-2 cell entry depends on ACE2 and TMPRSS2 and is blocked by a clinically proven protease inhibitor. Cell 181, 271–280 e278, (2020). - PMC - PubMed
    1. Letko M, Marzi A & Munster V Functional assessment of cell entry and receptor usage for SARS-CoV-2 and other lineage B betacoronaviruses. Nat Microbiol 5, 562–569, (2020). - PMC - PubMed
    1. Wahba L et al. An extensive meta-metagenomic search identifies SARS-CoV-2-homologous sequences in pangolin lung viromes. mSphere 5, (2020). - PMC - PubMed
    1. Walls AC et al. Tectonic conformational changes of a coronavirus spike glycoprotein promote membrane fusion. Proc Natl Acad Sci U S A 114, 11157–11162, (2017). - PMC - PubMed
    1. Algaissi A et al. SARS-CoV-2 S1 and N-based serological assays reveal rapid seroconversion and induction of specific antibody response in COVID-19 patients. Sci Rep 10, 16561, (2020). - PMC - PubMed

Publication types

MeSH terms

Substances