

Fluorescent Carbon Dots as Biosensor, Green Reductant, and Biomarker
- PMID: 34549145
- PMCID: PMC8444300
- DOI: 10.1021/acsomega.1c03481
Fluorescent Carbon Dots as Biosensor, Green Reductant, and Biomarker
Abstract
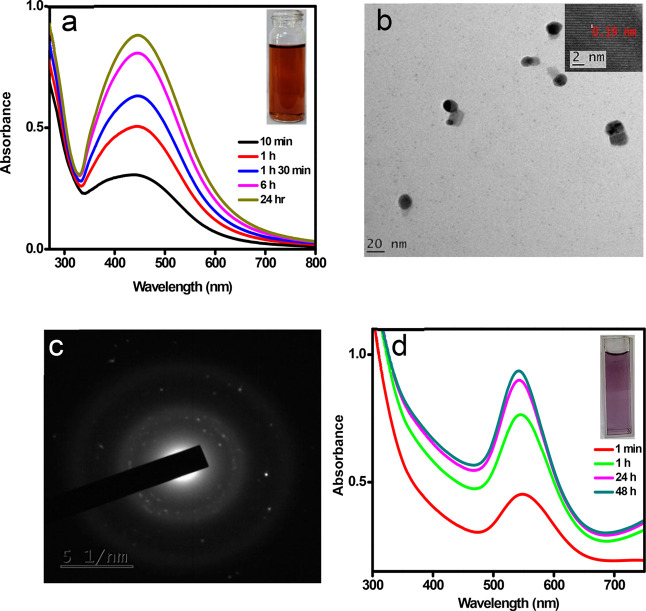
Carbon dots, the celebrated green material among the nanocarbon family, are blessed with several interesting features like biocompatibility, solubility, tunable luminescence, and so forth. Herein, carbon dots derived from Mint leaf extract (M-CDs) via a green method are exploited for versatile applications as a biosensor, reductant, and biomarker. M-CDs are applied for fluorimetric sensing of biologically relevant folic acid through quenching response originating from the inner filter effect, with a limit of detection of 280 nM. The carbon dots were highly selective toward folic acid in a collection of 16 biomolecules. The specificity of carbon dots toward folic acid is explained based on the interaction between the two. Along with sensing, herein, we project M-CDs as a green reducing agent by demonstrating the reduction of Fe(III) and noble metal nanoparticle synthesis from their salt solutions. The particles are found to be significantly non-cytotoxic, as evident from the MTT assay performed on primary H8 cells. The application of M-CDs in multicolor imaging is also illustrated using HeLa cells.
© 2021 The Authors. Published by American Chemical Society.
Conflict of interest statement
The authors declare no competing financial interest.
Figures


Similar articles
-
Green synthesis of carbon dots using the flowers of Osmanthus fragrans (Thunb.) Lour. as precursors: application in Fe3+ and ascorbic acid determination and cell imaging.Anal Bioanal Chem. 2019 May;411(12):2715-2727. doi: 10.1007/s00216-019-01712-6. Epub 2019 Apr 2. Anal Bioanal Chem. 2019. PMID: 30941477
-
Green synthesis of carbon dots originated from Lycii Fructus for effective fluorescent sensing of ferric ion and multicolor cell imaging.J Photochem Photobiol B. 2017 Oct;175:219-225. doi: 10.1016/j.jphotobiol.2017.08.035. Epub 2017 Sep 1. J Photochem Photobiol B. 2017. PMID: 28915491
-
One-step synthesis of nitrogen-doped multi-emission carbon dots and their fluorescent sensing in HClO and cellular imaging.Mikrochim Acta. 2021 Sep 8;188(10):330. doi: 10.1007/s00604-021-04973-0. Mikrochim Acta. 2021. PMID: 34498123
-
Metal Ion Detection by Carbon Dots-A Review.Crit Rev Anal Chem. 2022;52(4):756-767. doi: 10.1080/10408347.2020.1824117. Epub 2020 Sep 27. Crit Rev Anal Chem. 2022. PMID: 32985228 Review.
-
Green Sources Derived Carbon Dots for Multifaceted Applications.J Fluoresc. 2021 Jul;31(4):915-932. doi: 10.1007/s10895-021-02721-4. Epub 2021 Mar 30. J Fluoresc. 2021. PMID: 33786684 Review.
Cited by
-
Preparation, characterization and cell labelling of strong pH-controlled bicolor fluorescence carbonized polymer dots.RSC Adv. 2022 Jan 5;12(3):1258-1264. doi: 10.1039/d1ra08092j. eCollection 2022 Jan 5. RSC Adv. 2022. PMID: 35425208 Free PMC article.
-
Microwave Synthesis of Fluorescent Carbon Quantum dots from Araucaria Heterophylla Gum: Application in Drug Detection.J Fluoresc. 2025 Jun;35(6):4751-4762. doi: 10.1007/s10895-024-03874-8. Epub 2024 Aug 10. J Fluoresc. 2025. PMID: 39126608
-
Carbon Dots: A Review with Focus on Sustainability.Adv Sci (Weinh). 2024 Sep;11(35):e2405472. doi: 10.1002/advs.202405472. Epub 2024 Jul 18. Adv Sci (Weinh). 2024. PMID: 39023174 Free PMC article. Review.
-
Synthesis of Doped/Hybrid Carbon Dots and Their Biomedical Application.Nanomaterials (Basel). 2022 Mar 8;12(6):898. doi: 10.3390/nano12060898. Nanomaterials (Basel). 2022. PMID: 35335711 Free PMC article. Review.
-
Facile Synthesis of Multifunctional Carbon Dots Derived from Camel Milk for Mn7+ Sensing and Antiamyloid and Anticancer Activities.ACS Omega. 2023 Sep 20;8(39):36521-36533. doi: 10.1021/acsomega.3c05485. eCollection 2023 Oct 3. ACS Omega. 2023. PMID: 37810638 Free PMC article.
References
-
- Wang R.; Lu K.-Q.; Tang Z.-R.; Xu Y.-J. Recent progress in carbon quantum dots: synthesis, properties and applications in photocatalysis. J. Mater. Chem. A 2017, 5, 3717–3734. 10.1039/C6TA08660H. - DOI
-
- Wang Y.; Hu A. Carbon quantum dots: synthesis, properties and applications. J. Mater. Chem. C 2014, 2, 6921–6939. 10.1039/c4tc00988f. - DOI
LinkOut - more resources
Full Text Sources
