

Dairy Product Consumption and Cardiovascular Health: A Systematic Review and Meta-analysis of Prospective Cohort Studies
- PMID: 34550320
- PMCID: PMC8970833
- DOI: 10.1093/advances/nmab118
Dairy Product Consumption and Cardiovascular Health: A Systematic Review and Meta-analysis of Prospective Cohort Studies
Abstract
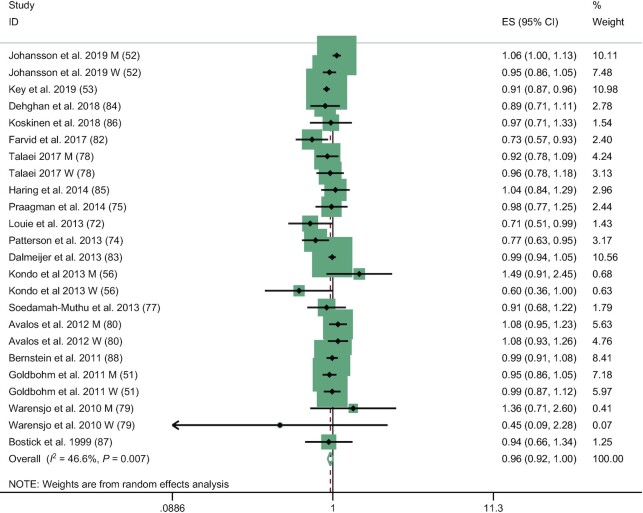
The association between dairy product consumption and cardiovascular health remains highly debated. We quantitatively synthesized prospective cohort evidence on the associations between dairy consumption and risk of hypertension (HTN), coronary heart disease (CHD), and stroke. We systematically searched PubMed, Embase, and Web of Science through August 1, 2020, to retrieve prospective cohort studies that reported on dairy consumption and risk of HTN, CHD, or stroke. We used random-effects models to calculate the pooled RR and 95% CI for the highest compared with the lowest category of intake and for a 1-serving/d increase in consumption. We rated the quality of evidence using NutriGrade. Fifty-five studies were included. Total dairy consumption was associated with a lower risk of HTN (RR for highest compared with lowest level of intake: 0.91, 95% CI: 0.86, 0.95, I2 = 73.5%; RR for 1-serving/d increase: 0.96, 95% CI: 0.94, 0.97, I2 = 66.5%), CHD (highest compared with lowest level of intake: 0.96, 95% CI: 0.92, 1.00, I2 = 46.6%; 1-serving/d increase: 0.98, 95% CI: 0.95, 1.00, I2 = 56.7%), and stroke (highest compared with lowest level of intake: 0.90, 95% CI: 0.85, 0.96, I2 = 60.8%; 1-serving/d increase: 0.96, 95% CI: 0.93, 0.99, I2 = 74.7%). Despite moderate to considerable heterogeneity, these associations remained consistent across multiple subgroups. Evidence on the relation between total dairy and risk of HTN and CHD was of moderate quality and of low quality for stroke. Low-fat dairy consumption was associated with lower risk of HTN and stroke and high-fat dairy with a lower risk of stroke. Milk, cheese, or yogurt consumption showed inconsistent associations with the cardiovascular outcomes in high compared with low intake and dose-response meta-analyses. Total dairy consumption was associated with a modestly lower risk of hypertension, CHD, and stroke. Moderate to considerable heterogeneity was observed in the estimates, and the overall quality of the evidence was low to moderate.
Keywords: cheese; coronary heart disease; dairy; hypertension; milk; stroke; yogurt.
Copyright © 2021 © The Author(s) 2021. Published by Oxford University Press on behalf of the American Society for Nutrition. Published by Elsevier Inc. All rights reserved.
Figures


References
-
- Arnett DK, Blumenthal RS, Albert MA, Buroker AB, Goldberger ZD, Hahn EJ, Himmelfarb CD, Khera A, Lloyd-Jones D, McEvoy JWet al. 2019 ACC/AHA guideline on the primary prevention of cardiovascular disease: executive summary: a report of the American College of Cardiology/American Heart Association Task Force on Clinical Practice Guidelines. Circulation. 2019;140(11):e563–e95. - PMC - PubMed
-
- Morze J, Danielewicz A, Hoffmann G, Schwingshackl L. Diet quality as assessed by the Healthy Eating Index, Alternate Healthy Eating Index, Dietary Approaches to Stop Hypertension score, and health outcomes: a second update of a systematic review and meta-analysis of cohort studies. J Acad Nutr Diet. 2020;120(12):1998–2031.e15. - PubMed
-
- Willett WC, Ludwig DS. Milk and health. N Engl J Med. 2020;382(7):644–54. - PubMed
-
- Astrup A. Milk and health. N Engl J Med. 2020;382(23):e86. - PubMed
