. 2022 Apr;44(2):683-698.
doi: 10.1007/s11357-021-00456-5. Epub 2021 Sep 22.

DNA damage-induced degradation of Sp1 promotes cellular senescence

Affiliations

DNA damage-induced degradation of Sp1 promotes cellular senescence

Michelle L Swift et al. Geroscience. 2022 Apr.

Abstract

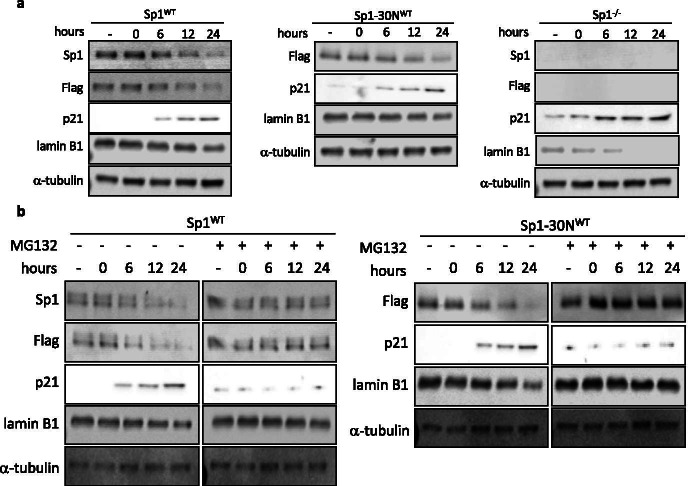
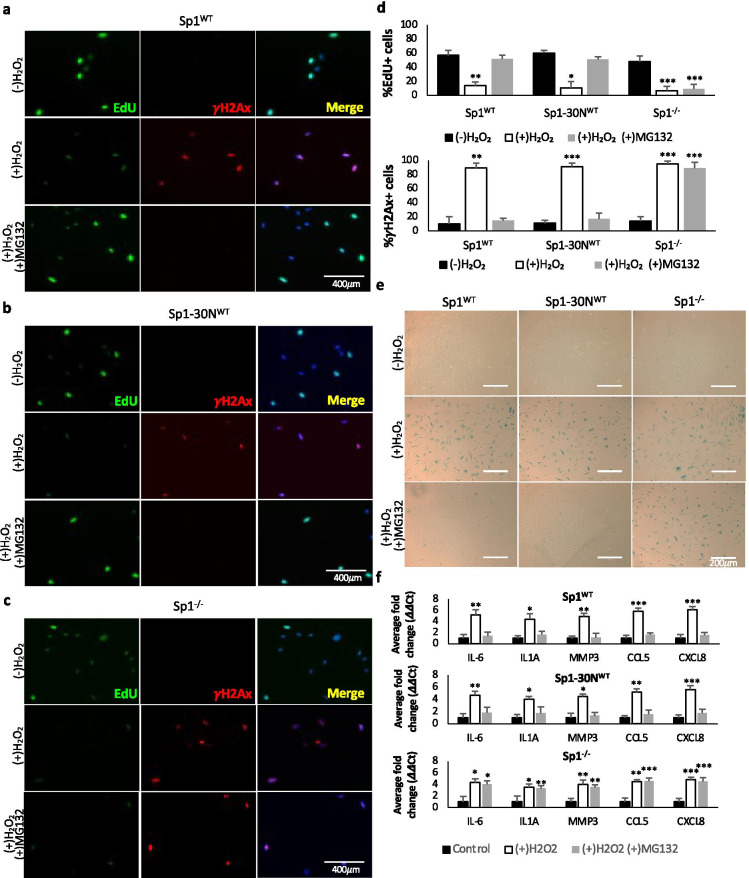
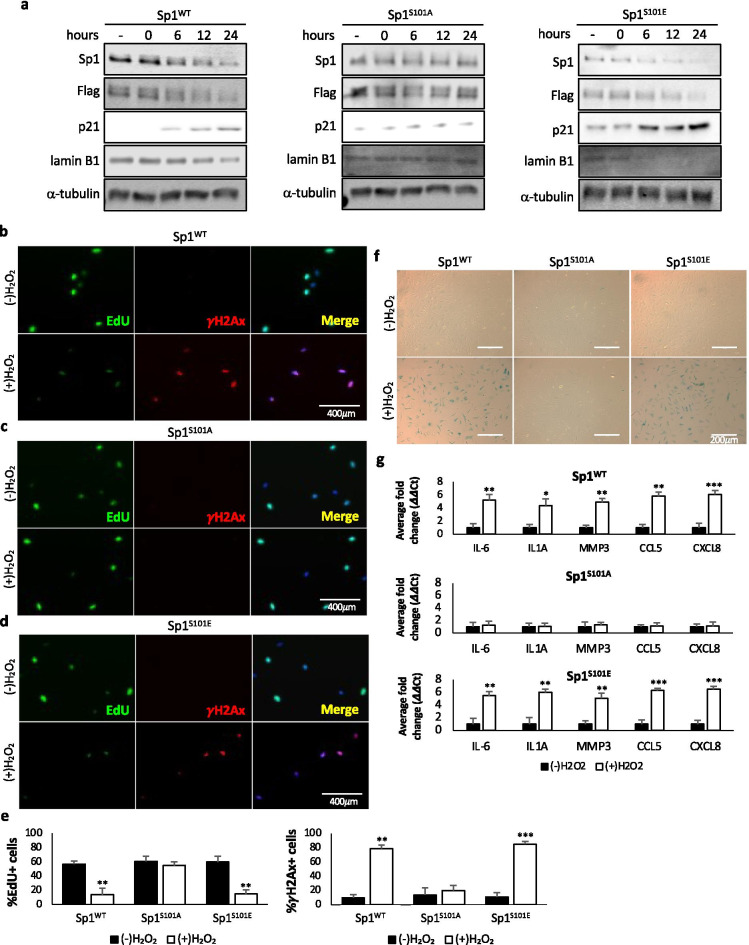
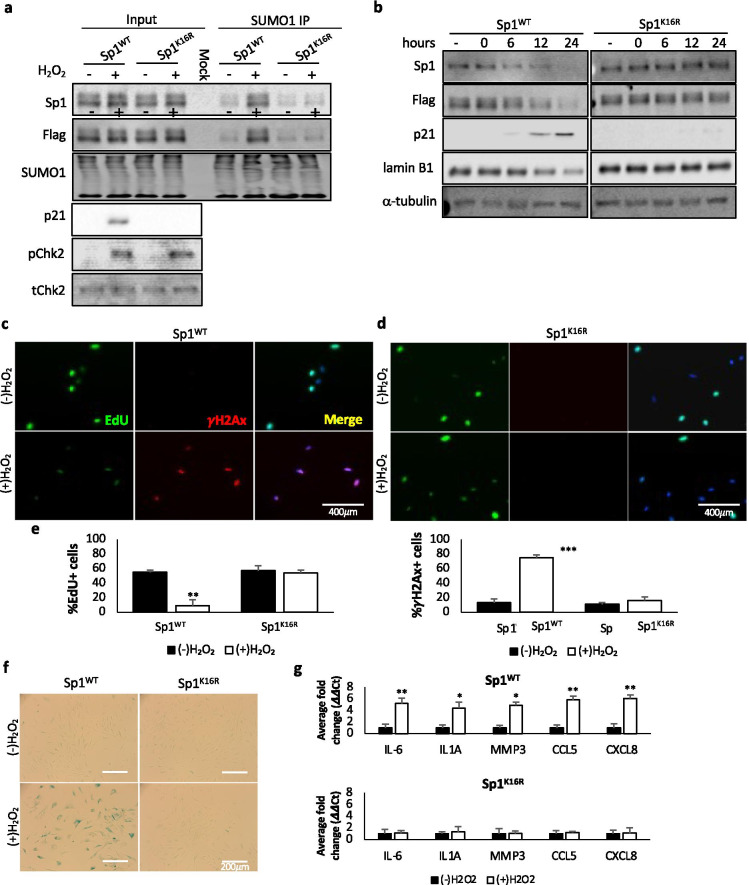
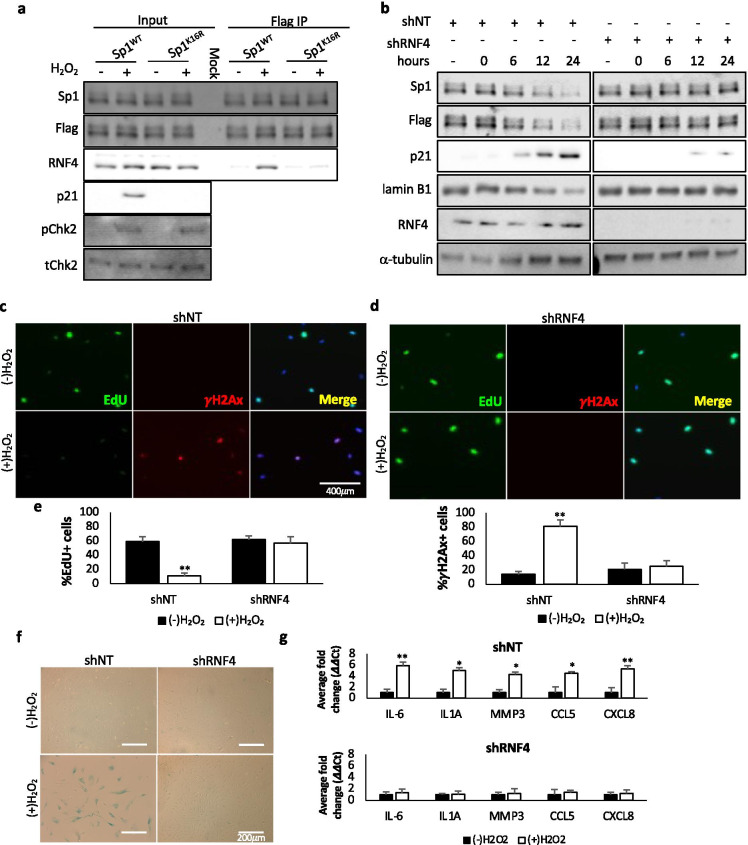
Persistent DNA damage (genotoxic stress) triggers signaling cascades that drive cells into apoptosis or senescence to avoid replicating a damaged genome. Sp1 has been found to play a role in double strand break (DSB) repair, and a link between Sp1 and aging has also been established, where Sp1 protein, but not RNA, levels decrease with age. Interestingly, inhibition ATM reverses the age-related degradation of Sp1, suggesting that DNA damage signaling is involved in senescence-related degradation of Sp1. Proteasomal degradation of Sp1 in senescent cells is mediated via sumoylation, where sumoylation of Sp1 on lysine 16 is increased in senescent cells. Taking into consideration our previous findings that Sp1 is phosphorylated by ATM in response to DNA damage and that proteasomal degradation of Sp1 at DSBs is also mediated by its sumoylation and subsequent interaction with RNF4, we investigated the potential contribution of Sp1's role as a DSB repair factor in mediating cellular senescence. We report here that Sp1 expression is decreased with a concomitant increase in senescence markers in response to DNA damage. Mutation of Sp1 at serine 101 to create an ATM phospho-null mutant, or mutation of lysine 16 to create a sumo-null mutant, prevents the sumoylation and subsequent proteasomal degradation of Sp1 and results in a decrease in senescence. Conversely, depletion of Sp1 or mutation of Sp1 to create an ATM phosphomimetic results in premature degradation of Sp1 and an increase in senescence markers. These data link a loss of genomic stability with senescence through the action of a DNA damage repair factor.

Keywords: DNA damage; SUMOylation; Senescence; Sp1; Ubiquitylation.


Conflict of interest statement

The authors declare no conflict of interest.

Figures

Fig. 1
Fig. 1
Damage-induced degradation of Sp1 results in increased p21 expression. a, b hTert-BJ1 cells were depleted of Sp1 using CRIPSR/Cas9 and transduced with lentivirus expressing Flag-tagged Sp1WT, Flag-tagged Sp1-30NWT, or empty-vector (Sp1−/−) (Supplemental Fig. 1a). Cells were treated with 200 μM H2O2 for 2 h, which was then replaced with fresh media for a total of 24 h. Lysates were collected at indicated time points past H2O2 removal and used for Western blot analysis of protein levels. Sp1 antibody does not detect Flag-Sp1-30 N. b Cells described in a were also treated with 10 μM MG132 for entire length of experiment
Fig. 2
Fig. 2
Damage-induced degradation of Sp1 promotes cellular senescence. af hTert-BJ1 cells were depleted of Sp1 using CRIPSR/Cas9 and transduced with lentivirus empty-vector (Sp1−/−), or lentivirus expressing Flag-tagged Sp1WT, or Flag-tagged Sp1-30NWT (Supplemental Fig. 1a). Cells were treated with 200 μM H2O2 for 2 h, ± 10 μM MG132 for 24 h, then placed in fresh media for a total of 7 days. ad 6 h prior to fixation, cells were treated with 10 μM EdU. Cells were then fixed and stained for EdU, γH2Ax, and DAPI. Scale bar represents 400 μm. e Cells described in a were also stained for β-galactosidase. Scale bar represents 200 μm. f RNA was collected from cells described above. Quantitative RT-PCR was used to analyze samples with verified primers for SASP markers. GAPDH was used as a reference gene. Data were processed for ΔΔCt method. Data represent means and SEM from 3 independent experiments assessed in triplicate. Significant differences between groups were determined by two-tailed Student’s t test. *, **, or *** indicate p values < 0.05, 0.01 or 0.001, respectively. No * indicates p value > 0.05
Fig. 3
Fig. 3
Phosphorylation of Sp1 by ATM is necessary for Sp1 degradation and damage-associated senescence. ag hTert-BJ1 cells were depleted of Sp1 using CRIPSR/Cas9 and transduced with lentivirus expressing Flag-tagged Sp1WT, Sp1S101A, or Sp1S101E (Supplemental Fig. 1a). a Cells were treated with 200 μM H2O2 for 2 h, then placed in fresh media for 24 h. Lysates were collected at indicated time points past H2O2 release and used for Western blot analysis of protein levels. bg Cells were treated with 200 μM H2O2 for 2 h, then placed in fresh media for 7 days. be 6 h prior to fixation, cells were treated with 10 μM EdU. Cells were then fixed and stained for EdU, γH2Ax, and DAPI. Scale bar represents 400 μm. f Cells described above were also stained for β-galactosidase. Scale bar represents 200 μm. g RNA was collected from cells described above. Quantitative RT-PCR was used to analyze samples with verified primers for SASP markers. GAPDH was used as a reference gene. Data were processed using the ΔΔCt method. Data represent means and SEM from 3 independent experiments assessed in triplicate. Significant differences between groups were determined by two-tailed Student’s t test. *, **, or *** indicate p values < 0.05, 0.01, or 0.001, respectively. No * indicates p value > 0.05
Fig. 4
Fig. 4
Expression of a sumo-null mutant prevents damage-induced cellular senescence. ag hTert-BJ1 cells were depleted of Sp1 using CRIPSR/Cas9 and transduced with lentivirus expressing Flag-tagged Sp1WT, or Sp1K16R (Supplemental Fig. 1a). a Following treatment with 200 μM H2O2 for 2 h, which was then replaced with fresh media for 24 h, and 10 μM MG132 for length of experiment, lysates were immunoprecipitated with SUMO1 antibody, followed by Western blotting with Flag and Sp1 to determine potential interaction with SUMO1. Phospho-Chk2 (pChk2) was used as a control to confirm DNA damage. b Cells were treated with 200 μM H2O2 for 2 h, which was replaced with fresh media for 24 h. Lysates were collected at indicated time points past H2O2 treatment and used for western blot analysis of protein levels. c − g Cells were treated with 200 μM H2O2 for 2 h, followed by fresh media for 7 days. ce 6 h prior to fixation, cells were treated with 10 μM EdU. Cells were then fixed and stained for EdU, γH2Ax, and DAPI. Scale bars represent 400 μm. f Cells described above were also stained for β-galactosidase. Scale bars represent 200 μm. g RNA was collected from cells described above. Quantitative RT-PCR was used to analyze samples with verified primers for SASP markers. GAPDH was used as a reference gene. Data were processed by the ΔΔCt method. Data represent means and SEM from 3 independent experiments assessed in triplicate. Significant differences between groups were determined by two-tailed Student’s t test. *, **, or *** indicate p values < 0.05, 0.01, or 0.001, respectively. No * indicates p value > 0.05
Fig. 5
Fig. 5
DNA damage increases Sp1’s interaction with RNF4 to facilitate Sp1 degradation and cellular senescence. a hTert-BJ1 cells were transduced with lentivirus expressing Flag-tagged Sp1WT, or Sp1K16R (Supplemental Fig. 1a). Following treatment with 200 μM H2O2 for 2 h and replacement with fresh media for 24 h, and 10 μM MG132 for length of experiment, lysates were immunoprecipitated with Flag antibody, followed by western blotting with RNF4 to determine potential interaction with Sp1. Phospho-Chk2 (pChk2) was used as a control to confirm DNA damage. be hTert-BJ1 cells were transduced with lentivirus expressing non-targeting shRNA or shRNA against RNF4. b Cells were treated with 200 μM H2O2 for 2 h followed by replacement with fresh media for 24 h. Lysates were collected at indicated time points after H2O2 release and used for Western blot analysis of protein levels. cg Cells were treated with 200 μM H2O2 for 2 h, then released into fresh media for 7 days. ce 6 h prior to fixation, cells were treated with 10 μM EdU. Cells were then fixed and stained for EdU, γH2Ax, and DAPI. Scale bar represents 400 μm. f Cells described above were also stained for β-galactosidase. Scale bar represents 200 μm. g RNA was collected from cells described above. Quantitative RT-PCR was used to analyze samples with verified primers for SASP markers. GAPDH was used as a reference gene. Data were processed for ΔΔCt method. Data represent means and SEM from 3 independent experiments assessed in triplicate. Significant differences between groups were determined by two-tailed Student’s t test. *, **, or *** indicate p values < 0.05, 0.01, or 0.001, respectively. No * indicates p value > 0.05

References

    1. Hughes KA, Reynolds RM. Evolutionary and mechanistic theories of aging. Annu Rev Entomol. 2005;50:421–445. doi: 10.1146/annurev.ento.50.071803.130409. - DOI - PubMed
    1. Kirkwood TB. Understanding the odd science of aging. Cell. 2005;120:437–447. doi: 10.1016/j.cell.2005.01.027. - DOI - PubMed
    1. Martin GM. Modalities of gene action predicted by the classical evolutionary biological theory of aging. Ann N Y Acad Sci. 2007;1100:14–20. doi: 10.1196/annals.1395.002. - DOI - PubMed
    1. Wilson DM, 3rd, Bohr VA, McKinnon PJ. DNA damage, DNA repair, ageing and age-related disease. Mech Ageing Dev. 2008;129:349–352. doi: 10.1016/j.mad.2008.02.013. - DOI - PMC - PubMed
    1. Schumacher B, Garinis GA, Hoeijmakers JH. Age to survive: DNA damage and aging. Trends Genet. 2008;24:77–85. doi: 10.1016/j.tig.2007.11.004. - DOI - PubMed

Publication types