. 2021 Sep 24;7(39):eabi4642.
doi: 10.1126/sciadv.abi4642. Epub 2021 Sep 22.

Subarctic climate for the earliest Homo sapiens in Europe

Affiliations

Subarctic climate for the earliest Homo sapiens in Europe

Sarah Pederzani et al. Sci Adv. .

Abstract

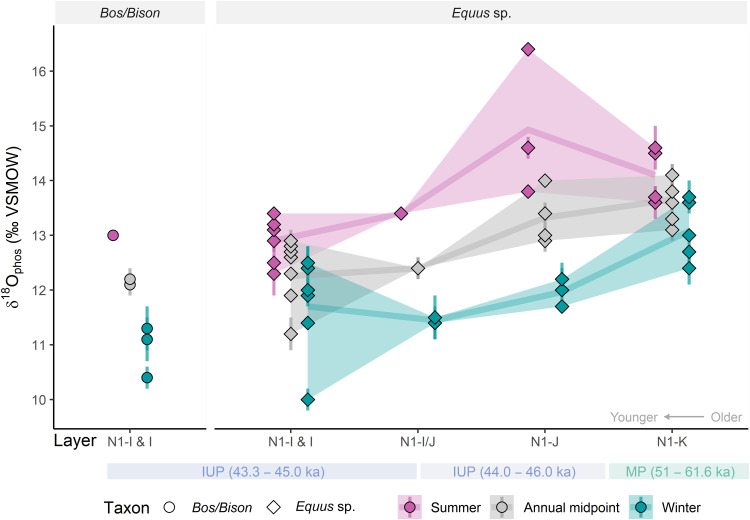
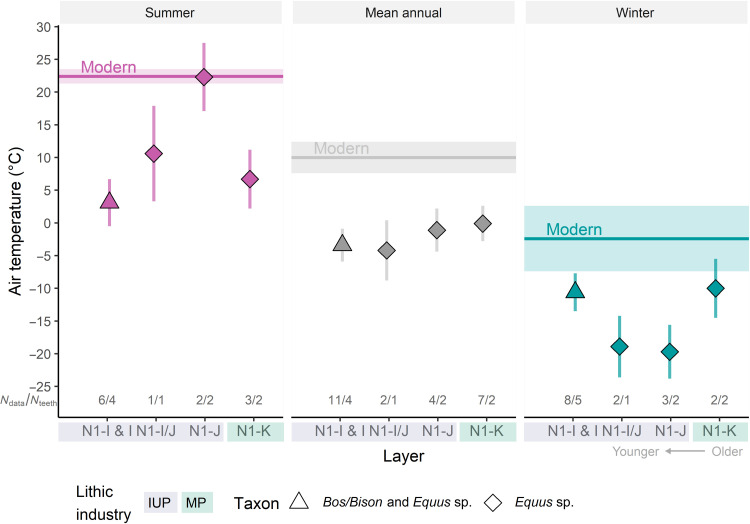
The expansion of Homo sapiens across Eurasia marked a major milestone in human evolution that would eventually lead to our species being found across every continent. Current models propose that these expansions occurred only during episodes of warm climate, based on age correlations between archaeological and climatic records. Here, we obtain direct evidence for the temperatures faced by some of these humans through the oxygen isotope analysis of faunal remains from Bacho Kiro Cave, Bulgaria, the earliest clear record of H. sapiens in Europe. The results indicate that humans ∼45,000 years ago experienced subarctic climates with far colder climatic conditions than previously suggested. This demonstrates that the early presence of H. sapiens in Europe was not contingent on warm climates. Our results necessitate the revision of key models of human expansion and highlight the need for a less deterministic role of climate in the study of our evolutionary history.


Figures

Fig. 1.
Fig. 1.. Seasonal oxygen isotope data for IUP and Middle Paleolithic (MP) layers of Bacho Kiro Cave.
Temperature-driven summer (pink), annual midpoint (gray), and winter (blue) oxygen isotope values (δ18Ophos) extracted from sequentially sampled Equus sp. (diamonds, right) and Bos/Bison (circles, left; only Layer N1-I & I) tooth enamel show overall low values, particularly in the IUP Layer N1-I & I. Some higher summer δ18Ophos values occurred at the beginning of the IUP in Layer N1-J and at the contact between N1-I and N1-J (N1-I/J), but the sample size for these layers is small. Plotted points represent δ18Ophos summer peaks, winter troughs, and annual means of individual years represented in sinusoidal δ18Ophos time series obtained from sequential samples taken along each analyzed tooth (see supplementary text S4). Summer peak and winter trough values were obtained by visual inspection of each δ18Ophos measurement series and are marked individually in fig. S4. Annual midpoint values represent the mean of the summer and winter values. A comparison of annual midpoint values and full annual averages can be found in supplementary text S8 and figs. S6 and S7. Means for summer, annual midpoint, and winter records, respectively, are connected by shaded lines, while shaded ribbons visualize the maximal spread of the data. For summer and winter values, error bars represent measurement uncertainty (1 SD) as determined by replicate measurements of each sample. For annual midpoint values, error bars represent the uncertainty around the mean derived by error propagation of the measurement uncertainty.
Fig. 2.
Fig. 2.. Reconstructed summer, winter, and mean annual paleotemperatures.
Air temperatures (°C) reconstructed for the MP (Layer N1-K, green) and IUP (Layer N1-J and following, blue) at Bacho Kiro Cave fall substantially below modern-day temperatures [horizontal lines (mean) and shaded areas (SD); 2012–2020 data obtained from Gorna Oryahovitsa (41)] for summer (pink), mean annual (gray), and winter (blue) temperatures. In particular, the IUP occupation of Layer N1-I & I shows especially cold conditions with mean annual temperatures below freezing. Reconstructed temperatures are similarly low at the contact between N1-I and N1-J (N1-I/J); however, the small sample size for this stratigraphic unit means that this result is less secure. A small temperature decline can be seen from the MP to the IUP, but sample numbers are low for the lower IUP layers [noted in gray as number of data points (Ndata) and number of teeth (Nteeth)]. Plotted points represent calibrated temperatures reconstructed for each layer derived from Equus sp. (diamonds) or a combination of Equus sp. and Bos/Bison (triangles) oxygen isotope measurements. Error bars indicate compound error around each temperature reconstruction. Summer and winter temperatures were converted from maxima and minima of the inverse model described in supplementary text S7, while mean annual temperatures were converted from the annual midpoint of unmodeled oxygen isotope values, as described in supplementary text S8.

References

    1. Staubwasser M., Draguşin V., Onac B. P., Assonov S., Ersek V., Hoffmann D. L., Veres D., Impact of climate change on the transition of Neanderthals to modern humans in Europe. Proc. Natl. Acad. Sci. 115, 9116–9121 (2018). - PMC - PubMed
    1. Müller U. C., Pross J., Tzedakis P. C., Gamble C., Kotthoff U., Schmiedl G., Wulf S., Christanis K., The role of climate in the spread of modern humans into Europe. Quat. Sci. Rev. 30, 273–279 (2011).
    1. Hublin J. J., The modern human colonization of western Eurasia: When and where? Quat. Sci. Rev. 118, 194–210 (2015).
    1. Kuhn S. L., Zwyns N., Rethinking the initial Upper Paleolithic. Quat. Int. 347, 29–38 (2014).
    1. Hublin J.-J., Sirakov N., Aldeias V., Bailey S., Bard E., Delvigne V., Endarova E., Fagault Y., Fewlass H., Hajdinjak M., Kromer B., Krumov I., Marreiros J., Martisius N. L., Paskulin L., Sinet-Mathiot V., Meyer M., Pääbo S., Popov V., Rezek Z., Sirakova S., Skinner M. M., Smith G. M., Spasov R., Talamo S., Tuna T., Wacker L., Welker F., Wilcke A., Zahariev N., McPherron S. P., Tsanova T., Initial upper palaeolithic Homo sapiens from Bacho Kiro Cave, Bulgaria. Nature 581, 299–302 (2020). - PubMed