. 2021 Sep 24;7(39):eabi7828.
doi: 10.1126/sciadv.abi7828. Epub 2021 Sep 22.

Integration of feeding behavior by the liver circadian clock reveals network dependency of metabolic rhythms

Affiliations

Integration of feeding behavior by the liver circadian clock reveals network dependency of metabolic rhythms

Carolina M Greco et al. Sci Adv. .

Abstract

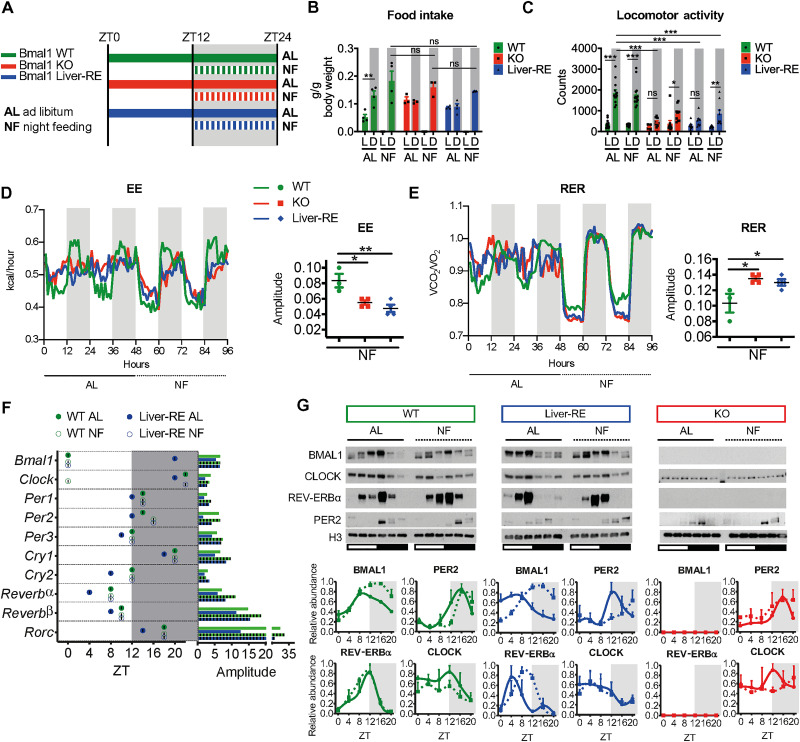
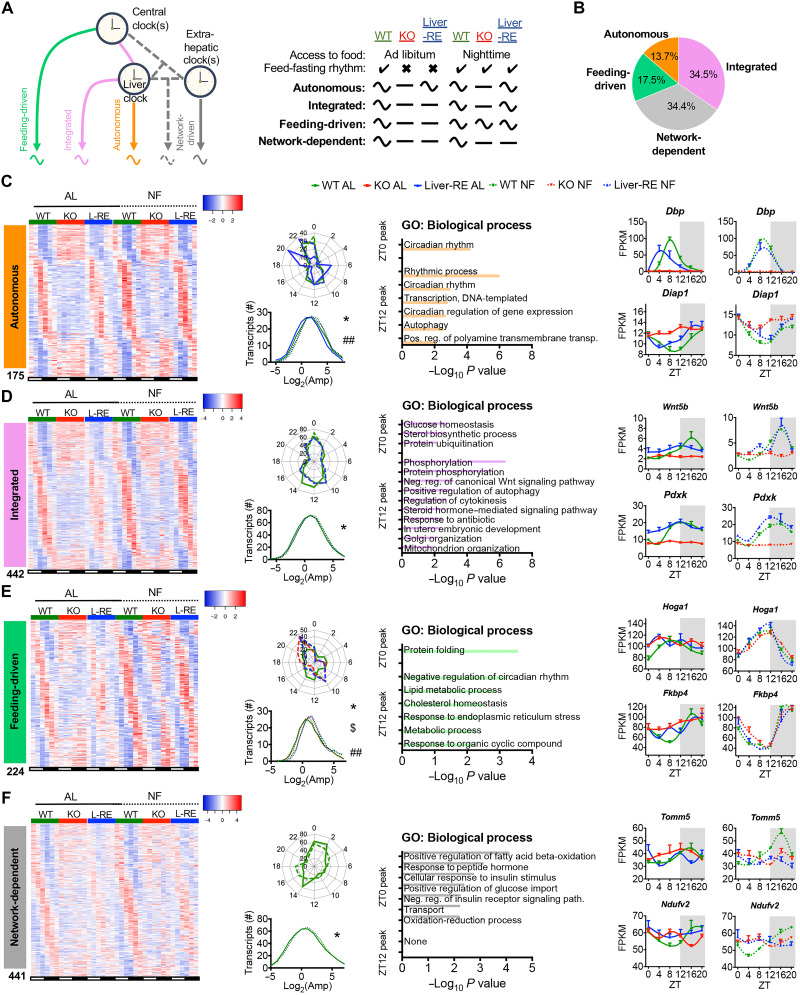
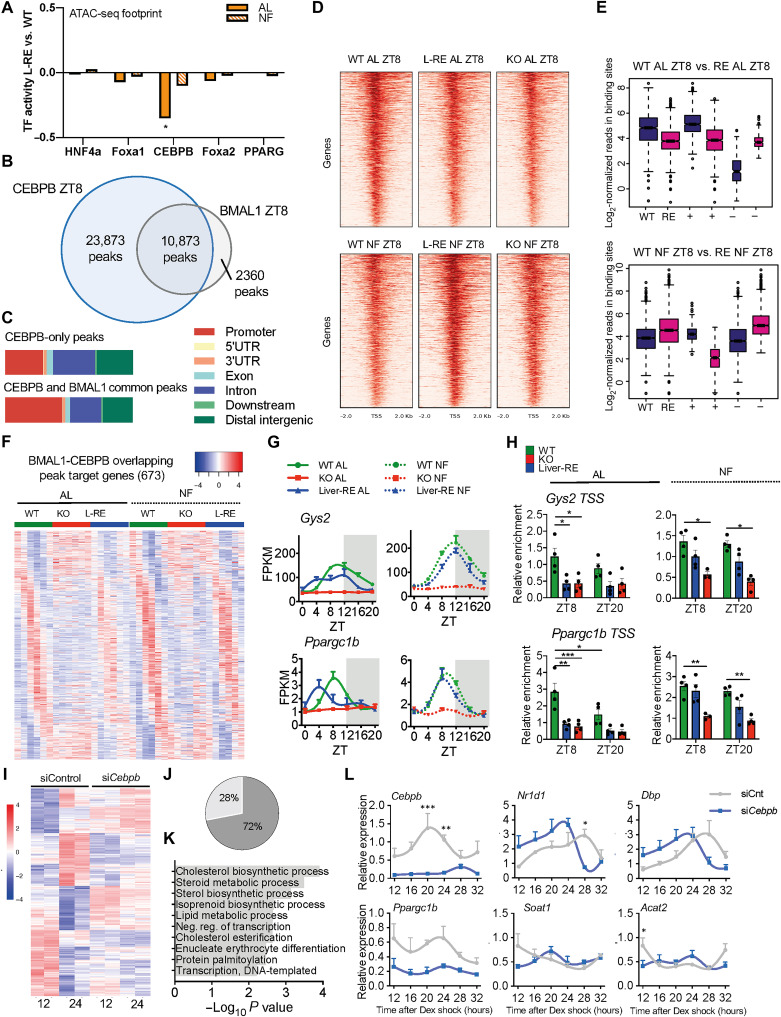
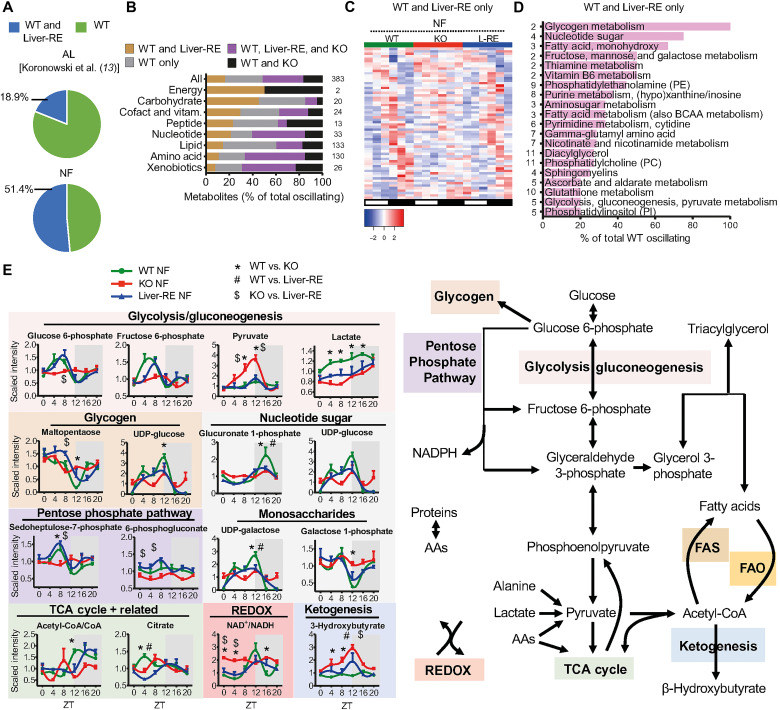
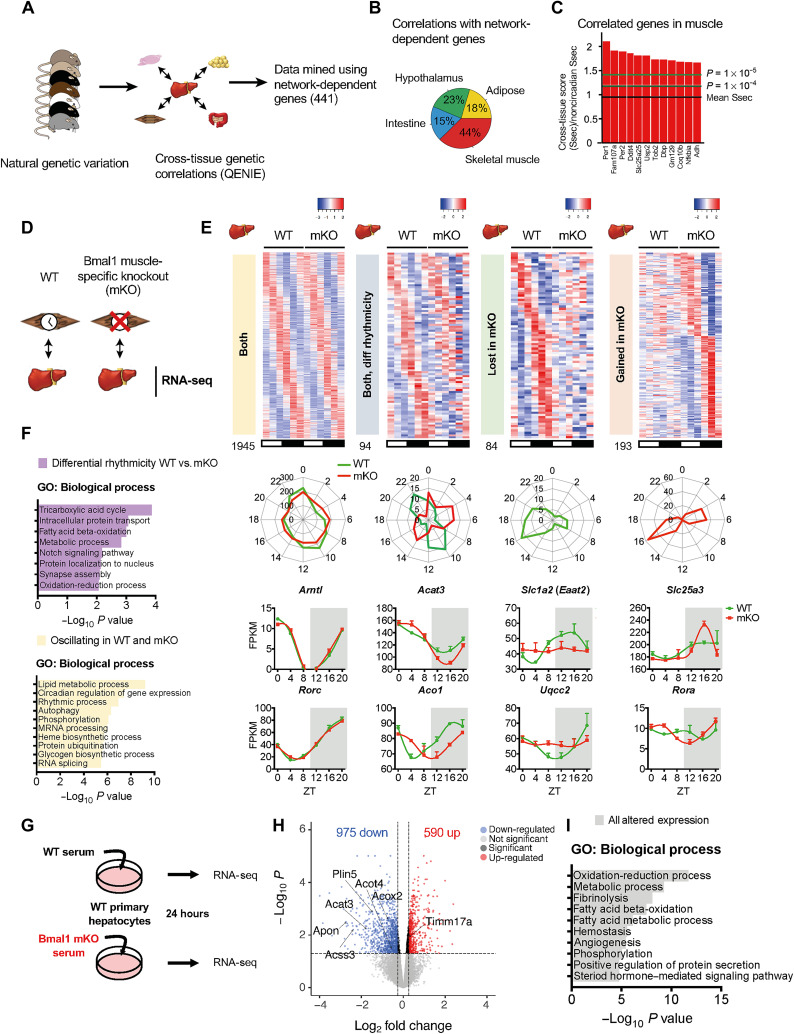
The mammalian circadian clock, expressed throughout the brain and body, controls daily metabolic homeostasis. Clock function in peripheral tissues is required, but not sufficient, for this task. Because of the lack of specialized animal models, it is unclear how tissue clocks interact with extrinsic signals to drive molecular oscillations. Here, we isolated the interaction between feeding and the liver clock by reconstituting Bmal1 exclusively in hepatocytes (Liver-RE), in otherwise clock-less mice, and controlling timing of food intake. We found that the cooperative action of BMAL1 and the transcription factor CEBPB regulates daily liver metabolic transcriptional programs. Functionally, the liver clock and feeding rhythm are sufficient to drive temporal carbohydrate homeostasis. By contrast, liver rhythms tied to redox and lipid metabolism required communication with the skeletal muscle clock, demonstrating peripheral clock cross-talk. Our results highlight how the inner workings of the clock system rely on communicating signals to maintain daily metabolism.


Figures

Fig. 1.
Fig. 1.. Effects of an imposed feeding rhythm on systemic metabolism and the autonomous liver clock.
(A) Summary of experimental design. Horizontal bars indicate timing of food availability, and shaded area represents dark phase. (B) Food intake from metabolic cages (means ± SEM, n = 3 to 4 per group). L, light phase; D, dark phase. Two-way analysis of variance (ANOVA) with Bonferroni post hoc test; **P < 0.01. (C) Ambulatory locomotor activity measured from home cage (means ± SEM; WT, n = 13; KO, n = 10; Liver-RE, n = 9). Two-way ANOVA with Bonferroni post hoc test; *P < 0.05, **P < 0.01, and ***P < 0.001. ns, not significant. (D and E) Metabolic cage assessment of mice in light-dark. Traces show group averages. BioDare2 eJTK_CYCLE amplitude is shown to the right; P values for each parameter of individual mice are shown in fig. S1D. n = 3 to 4 per group; one-way ANOVA with Tukey post hoc tests; *P < 0.05 and **P < 0.01. (F) JTK_CYCLE phase and amplitude from total RNA sequencing (RNA-seq) (n = 3). (G) Western blot analysis of core clock components from liver chromatin fractions. Representative blots from three independent experiments are shown. Densitometry analysis displayed as means ± SEM, n = 3 per group, per time point, normalized to H3, except BMAL1 signal that is expressed as ratio of upper to lower band.
Fig. 2.
Fig. 2.. Defining drivers of gene oscillations in the liver.
(A to F) Data presented are liver transcriptome at six time points over the diurnal cycle (ZT0, ZT4, ZT8, ZT12, ZT16, and ZT20) by RNA-seq (n = 3) and JTK_CYCLE rhythmicity detection (P < 0.01). (A) Gene classification scheme used to determine the drivers of oscillating genes in the liver. Curved and flat lines represent oscillating and nonoscillating genes, respectively. (B) Breakdown of oscillating genes by mechanism, displayed as the percentage of total oscillating in WT under either AL or NF. (C to F) Features of each set of oscillating genes. Left: Phase-sorted heatmap. Middle left: Polar histogram of peak phase and amplitude distribution (one-way ANOVA with Newman-Keuls post hoc tests: autonomous, *WT AL versus Liver-RE AL and ##Liver-RE AL versus NF; integrated, *WT AL versus NF; feeding-driven, *WT NF versus KO NF, $KO NF versus Liver-RE NF, and ##WT AL versus NF; network-dependent, *WT AL versus NF; *P < 0.05. Middle right: Pathway enrichment analysis for the two main peaks of gene expression detected (ZT0 peak = ZT20 to ZT4, ZT12 peak = ZT8 to ZT16, P < 0.01). Right: Example genes (means ± SEM, n = 3 per group, per time point).
Fig. 3.
Fig. 3.. CEBPB cooperates with hepatic BMAL1 to drive oscillations in gene expression.
(A) Footprint of TF binding within regions of accessible chromatin at BMAL1 sites [n = 2 per group; unpaired t test; *P < 0.05, Liver-RE (L-RE) versus WT]. PPARG, peroxisome proliferator–activated receptor gamma. (B) Venn diagram of CEBPB and BMAL1 binding sites in livers of WT AL. (C) CEBPB ChIP peak distribution at ZT8. UTR, untranslated region. (D) Heatmap of CEBPB ChIP-seq binding profiles at CEBPB and BMAL1 common sites. (E) Boxplot of read distribution at CEBPB-BMAL1 common sites. + and − indicate sites with higher enrichment in WT or Liver-RE, respectively (DiffBind, P < 0.05; two-sided Wilcoxon-Mann-Whitney test; n = 2 per group). (F) Heatmap of oscillating target genes bound by CEBPB and BMAL1. (G) BMAL1/CEBPB target gene examples (means ± SEM, n = 3 per time point, per group). (H) CEBPB ChIP at Gys2 and Ppargc1b promoters (means ± SEM, n = 4 per time point, per group; two-way ANOVA with Holm-Sidak post hoc tests; *P < 0.05, **P < 0.01, and ***P < 0.001). (I) Hierarchical clustering of genes differentially expressed at 12 versus 24 hours after DEX in siControl (siCnt) AML12 cells (n = 2 per time point per group; FDR < 0.05). (J) Effect of siCebpb on time-regulated genes. (K) Biological processes of genes that lose time dependency on siCebpb. (L) Examples of genes modulated by siCebpb (means ± SEM, n = 3 per time point, per group; two-way ANOVA with Holm-Sidak post hoc tests; *P < 0.05, **P < 0.01, and ***P < 0.001).
Fig. 4.
Fig. 4.. Influence of local BMAL1 on liver metabolite oscillations under NF.
(A to E) Metabolite profiles from six time points (ZT0, ZT4, ZT8, ZT12, ZT16, and ZT20) over the diurnal cycle in the liver under NF (n = 4, per group, per time point) and JTK_CYCLE (P < 0.05) rhythmicity detection. (A) Pie chart showing the percentage of metabolites oscillating in both WT and Liver-RE under AL (AL, previous report) or NF conditions. (B) Overlap of oscillating metabolites broken down into chemical class (with the number in each class shown to the right). Data show percentages of total oscillating metabolites for that class. (C) Phase-sorted heatmap of metabolites oscillating in WT and Liver-RE only. (D) Pathways of WT-only and Liver-RE–only oscillating metabolites (numbers in each class are shown to the left). BCAA, branched chain amino acid. (E) Example metabolites involved in macronutrient and energy metabolism (means ± SEM, n = 4 per group, per time point; two-way ANOVA with Bonferroni post hoc tests; P < 0.05; *WT versus KO, #WT versus Liver-RE, and $KO versus Liver-RE). AAs, amino acids; NADPH, reduced form of NAD phosphate.
Fig. 5.
Fig. 5.. A large portion of daily hepatic metabolism requires extrahepatic BMAL1 even in the presence of a feeding-fasting rhythm.
(A to F) Analysis of diurnal metabolite profiles under NF as in Fig. 4 (n = 4). (A) Phase-sorted heatmap of WT NF oscillating metabolites that failed to oscillate in Liver-RE NF, thereby showing a dependence on the rest of the clock network (“network-dependent”). (B) Pathways containing metabolites that oscillate in WT NF-only (JTK_CYCLE, P < 0.05), ranked by percentage of metabolites oscillating (numbers in each class are shown to the left of bars). (C) Phase-sorted heatmap showing all WT oscillating lipid metabolites. (D) Examples of WT NF-only oscillating and other informative lipid metabolites (means ± SEM, n = 4 per group, per time point; two-way ANOVA with Bonferroni post hoc tests; P < 0.05; *WT versus KO, #WT versus Liver-RE, and $KO versus Liver-RE). (E) Number of pairwise metabolite correlations under NF. (F) Overlap of metabolite correlation pairs between genotypes.
Fig. 6.
Fig. 6.. Identification of the muscle clock as a key node supporting network-dependent circadian function in the liver.
(A) Scheme showing the QENIE approach used to identify genes in nonhepatic tissues correlated with network-dependent genes in the liver. (B) Tissue distribution of significant correlations related to network-dependent genes in the liver. (C) Top significant correlations in muscle with network-dependent genes in the liver; arrows indicate circadian clock genes. (D) Scheme of experimental setup; livers from WT or Bmal1 mKO mice were harvested over circadian time and subjected to RNA-seq. n = 3 animals of each genotype per time point (ZT0, ZT4, ZT8, ZT12, ZT16, and ZT20). (E) Phase-aligned heatmaps of circadian genes identified by JTK_CYCLE then subjected to LimoRhyde analysis to reveal differentially regulated transcripts. Both, genes oscillating in livers from WT and mKO; both differential rhythmicity, genes oscillating in livers from both genotypes but with different phases and/or amplitudes; lost in mKO, genes that lose oscillation in livers from mKO; gained in mKO, genes that oscillate in mKO exclusively. Phase maps of oscillating genes and example genes from each classification displayed below corresponding heatmap. (F) GO analysis from genes designated as either unaltered or differentially regulated by LimoRhyde analysis. (G) Experimental setup for serum treatment of primary hepatocytes and individual serum samples from WT and mKO mice were assessed by RNA-seq for their impact on gene expression in cultured hepatocytes (n = 5 per genotype). (H) Volcano plot of genes significantly regulated by treatment with mKO serum versus WT (FDR < 0.05). (I) GO analysis of significantly altered transcripts in primary hepatocytes treated with mKO versus WT serum.

References

    1. Bass J., Lazar M. A., Circadian time signatures of fitness and disease. Science 354, 994–999 (2016). - PubMed
    1. Benitah S. A., Welz P. S., Circadian regulation of adult stem cell homeostasis and aging. Cell Stem Cell 26, 817–831 (2020). - PubMed
    1. Chaix A., Lin T., Le H. D., Chang M. W., Panda S., Time-restricted feeding prevents obesity and metabolic syndrome in mice lacking a circadian clock. Cell Metab. 29, 303–319.e4 (2019). - PMC - PubMed
    1. Panda S., Circadian physiology of metabolism. Science 354, 1008–1015 (2016). - PMC - PubMed
    1. Cederroth C. R., Albrecht U., Bass J., Brown S. A., Dyhrfjeld-Johnsen J., Gachon F., Green C. B., Hastings M. H., Helfrich-Förster C., Hogenesch J. B., Lévi F., Loudon A., Lundkvist G. B., Meijer J. H., Rosbash M., Takahashi J. S., Young M., Canlon B., Medicine in the fourth dimension. Cell Metab. 30, 238–250 (2019). - PMC - PubMed