Observational Study
. 2022 Jan 1;205(1):75-87.
doi: 10.1164/rccm.202106-1359OC.

Hourly Kinetics of Critical Organ Dysfunction in Extremely Preterm Infants

Affiliations
Observational Study

Hourly Kinetics of Critical Organ Dysfunction in Extremely Preterm Infants

Orlyn C Lavilla et al. Am J Respir Crit Care Med. .

Abstract

Rationale: Use of severity of illness scores to classify patients for clinical care and research is common outside of the neonatal ICU. Extremely premature (<29 weeks' gestation) infants with extremely low birth weight (<1,000 g) experience significant mortality and develop severe pathology during the protracted birth hospitalization. Objectives: To measure at high resolution the changes in organ dysfunction that occur from birth to death or discharge home by gestational age and time, and among extremely preterm infants with and without clinically meaningful outcomes using the neonatal sequential organ failure assessment score. Methods: A single-center, retrospective, observational cohort study of inborn, extremely preterm infants with extremely low birth weight admitted between January 2012 and January 2020. Neonatal sequential organ failure assessment scores were calculated every hour for every patient from admission until death or discharge. Measurements and Main Results: Longitudinal, granular scores from 436 infants demonstrated early and sustained discrimination of those who died versus those who survived to discharge. The discrimination for mortality by the maximum score was excellent (area under curve, 0.91; 95% confidence intervals, 0.88-0.94). Among survivors with and without adverse outcomes, most score variation occurred at the patient level. The weekly average score over the first 28 days was associated with the sum of adverse outcomes at discharge. Conclusions: The neonatal sequential organ failure assessment score discriminates between survival and nonsurvival on the first day of life. The major contributor to score variation occurred at the patient level. There was a direct association between scores and major adverse outcomes, including death.

Keywords: critical illness; neonatal ICU; newborn; organ dysfunction score.


Figures
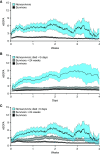
Figure 1.
Figure 1.
Longitudinal neonatal sequential organ failure assessment (nSOFA) score trajectory in the neonatal period by survival group. (A) Consecutive q1-hour nSOFA score mean (internal line) and 95% confidence intervals (surrounding band) among all survivors to discharge (n = 344) and all nonsurvivors (n = 92) over the first 4 weeks after birth. (B) Consecutive q1 hour nSOFA score mean (internal line) and 95% confidence intervals (surrounding band) among survivors (all or only infants ⩽24 wk gestation at birth; the median birth gestational age among all who died) to discharge (n = 344) and nonsurvivors who died at no more than 120 hours (50th percentile of mortality timing; n = 49). (C) Consecutive q1 hour nSOFA score mean (internal line) and 95% confidence intervals (surrounding band) among survivors (all or only infants ⩽24 wk gestation at birth) to discharge (n = 344) and nonsurvivors who died after 120 hours (50th percentile of mortality timing; n = 43).
Figure 2.
Figure 2.
The cumulative neonatal sequential organ failure assessment (nSOFA) score on first day of life by survival group. The cumulative nSOFA score among survivors (⩽24 wk gestation at birth and >24 wk gestation at birth) and nonsurvivors (median gestational age 24 wk; median timing of death 5 d). Violin plots with all patient values including median and quartiles are shown. No mortality occurred before 12 hours of life based on study design. Comparisons were made by Kruskal-Wallis. Maximum possible nSOFA score was 15 for any hour. Maximum possible cumulative nSOFA was 360. *P < 0.05 and **P < 0.001.
Figure 3.
Figure 3.
Longitudinal neonatal sequential organ failure assessment (nSOFA) score trajectory among survivors in the first 12 weeks of life by gestational age group. Consecutive q1 hour neonatal sequential organ failure assessment score mean (internal line) and 95% confidence intervals (surrounding band) among survivors to discharge over the first 12 weeks of life by birth gestational age (A) 23 or fewer weeks, (B) 24 weeks, (C) 25 weeks, (D) 26 weeks, (E) 27 weeks, and (F) 28 weeks.
Figure 4.
Figure 4.
Longitudinal neonatal sequential organ failure assessment (nSOFA) score trajectory among survivors in the neonatal period by severe intraventricular hemorrhage group. (A) Consecutive q1 hour nSOFA score mean (internal line) and 95% confidence intervals (surrounding band) over the first week of life among survivors with severe intraventricular hemorrhage (grade 3–4; SIVH) and those without any intraventricular hemorrhage. (B) Consecutive q1 hour nSOFA score mean (internal line) and 95% confidence intervals (surrounding band) over the first week of life among survivors born at 24 or fewer weeks’ gestation with severe intraventricular hemorrhage (grade 3–4; SIVH) and those without SIVH (grade ⩽2). G2 = grade 2; IVH = intraventricular hemhorrhage.
Figure 5.
Figure 5.
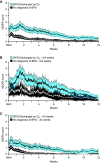
Longitudinal neonatal sequential organ failure assessment (nSOFA) score trajectory in the neonatal period by bronchopulmonary dysplasia with discharge on oxygen (BPD-Discharged on O2) group. (A) Consecutive q1 hour nSOFA score mean (internal line) and 95% confidence intervals (surrounding band) over the first week of life among survivors with BPD-Discharged on O2 and those without BPD. (B) Consecutive q1 hour nSOFA score mean (internal line) and 95% confidence intervals (surrounding band) over the first week of life among patients born at 24 or fewer weeks’ gestation with BPD-DC on O2 and those without BPD. (C) Consecutive q1 hour nSOFA score mean (internal line) and 95% confidence intervals (surrounding band) over the first week of life among patients born at more than 24 weeks’ gestation with BPD-DC on O2 and those without BPD.
Figure 6.
Figure 6.
Longitudinal neonatal sequential organ failure assessment (nSOFA) score trajectory in the neonatal period by severe retinopathy of prematurity (ROP) group. (A) Consecutive q1 hour nSOFA score mean (internal line) and 95% confidence intervals (surrounding band) over the first week of life among all survivors with severe ROP (received intervention prior to discharge) and those without ROP. (B) Consecutive q1 hour nSOFA score mean (internal line) and 95% confidence intervals (surrounding band) over the first week of life among all survivors with severe ROP (received intervention prior to discharge; median gestational age 25 wk) and those without ROP who completed 24–25 weeks’ gestation at birth (no surviving infant at 23 or fewer wk in the cohort was without a diagnosis of ROP).
Figure 7.
Figure 7.
Relationship between the neonatal sequential organ failure assessment index (nSOFAindex), gestational age, and the number of adverse outcomes among survivors. (A) nSOFAindex values by birth gestational age among survivors. Histograms represent medians. Error bars represent interquartile ranges. Comparisons by Kruskal-Wallis. (B) The relationship between the nSOFAindex and the sum of adverse outcomes at an individual patient level (maximum of 7 including severe intraventricular hemorrhage [SIVH], infection [early-onset bacteremia, late-onset bacteremia, spontaneous intestinal perforation, or necrotizing enterocolitis], bronchopulmonary dysplasia with discharge on O2, and severe retinopathy of prematurity). All patient nSOFAindex values are shown. *P < 0.05 and ** P < 0.001.

Comment in

References

    1. Sun Y, Kaur R, Gupta S, Paul R, Das R, Cho SJ, et al. Development and validation of high definition phenotype-based mortality prediction in critical care units. JAMIA Open . 2021;4:ooab004. - PMC - PubMed
    1. Keuning BE, Kaufmann T, Wiersema R, Granholm A, Pettilä V, Møller MH, et al. HEALICS consortium Mortality prediction models in the adult critically ill: a scoping review. Acta Anaesthesiol Scand . 2020;64:424–442. - PubMed
    1. Strand K, Flaatten H. Severity scoring in the ICU: a review. Acta Anaesthesiol Scand . 2008;52:467–478. - PubMed
    1. Schlapbach LJ, Straney L, Bellomo R, MacLaren G, Pilcher D. Prognostic accuracy of age-adapted SOFA, SIRS, PELOD-2, and qSOFA for in-hospital mortality among children with suspected infection admitted to the intensive care unit. Intensive Care Med . 2018;44:179–188. - PMC - PubMed
    1. Matics TJ, Sanchez-Pinto LN. Adaptation and validation of a pediatric sequential organ failure assessment score and evaluation of the sepsis-3 definitions in critically ill children. JAMA Pediatr. 2017;171:e172352. - PMC - PubMed

Publication types

MeSH terms