. 2021 Sep 22;17(9):e1009439.
doi: 10.1371/journal.pcbi.1009439. eCollection 2021 Sep.

Partitioning variability in animal behavioral videos using semi-supervised variational autoencoders

Affiliations

Partitioning variability in animal behavioral videos using semi-supervised variational autoencoders

Matthew R Whiteway et al. PLoS Comput Biol. .

Abstract

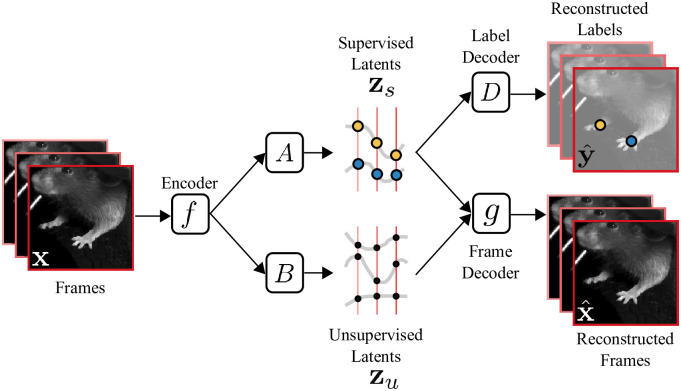
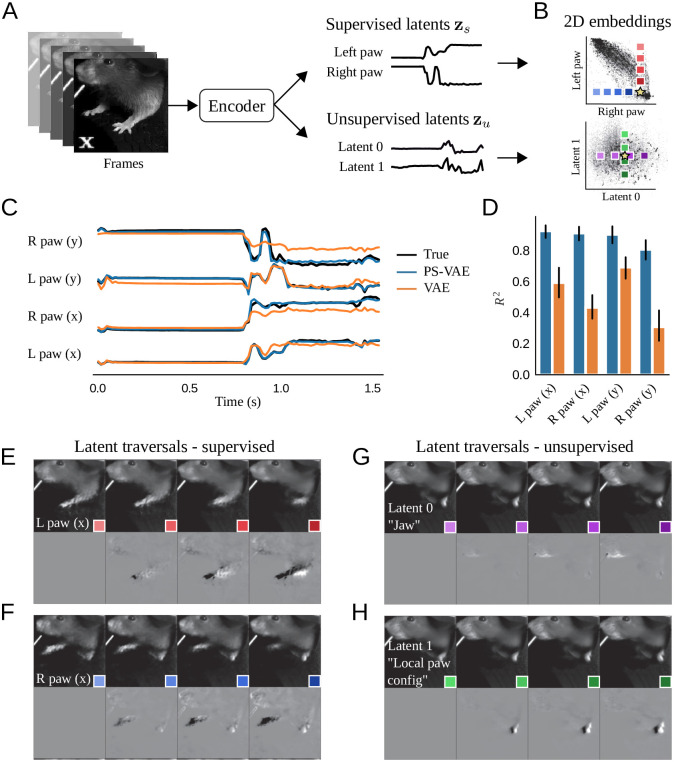
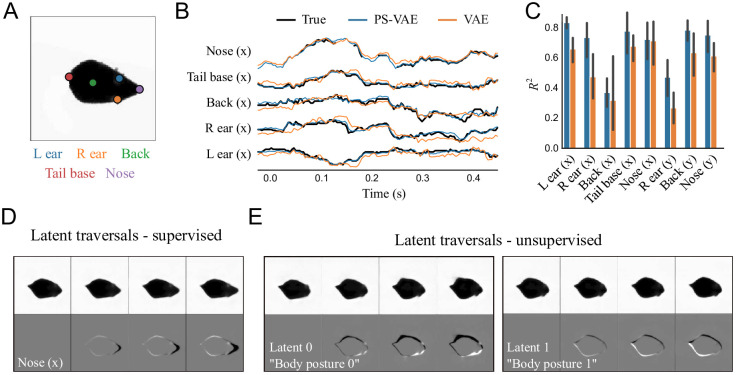
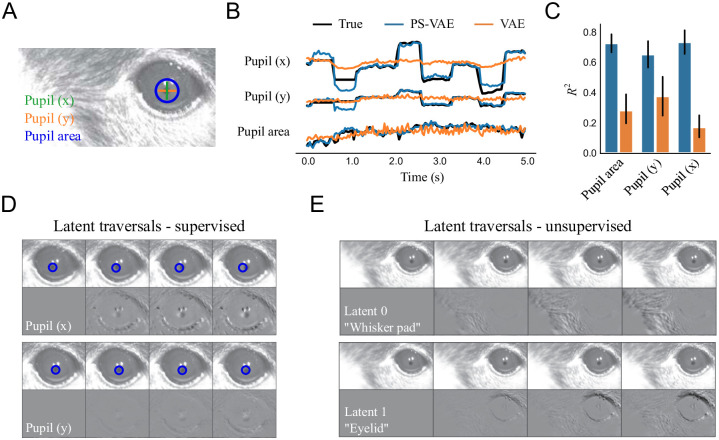
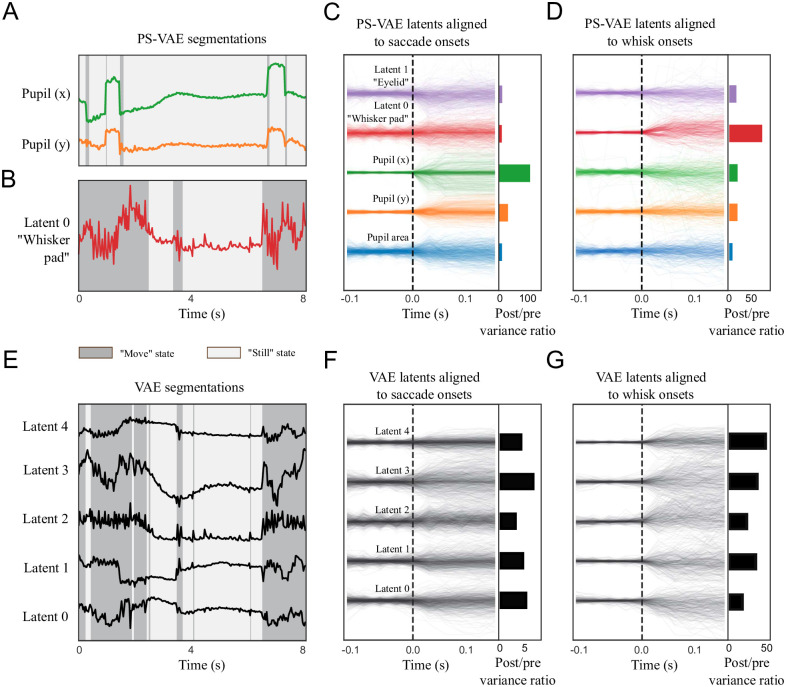
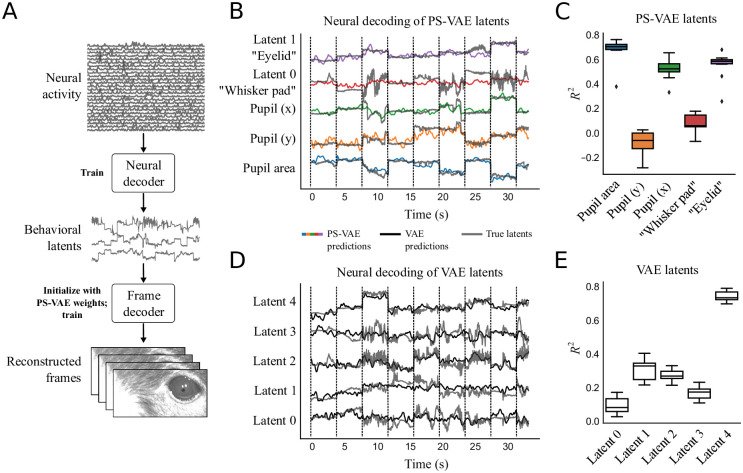
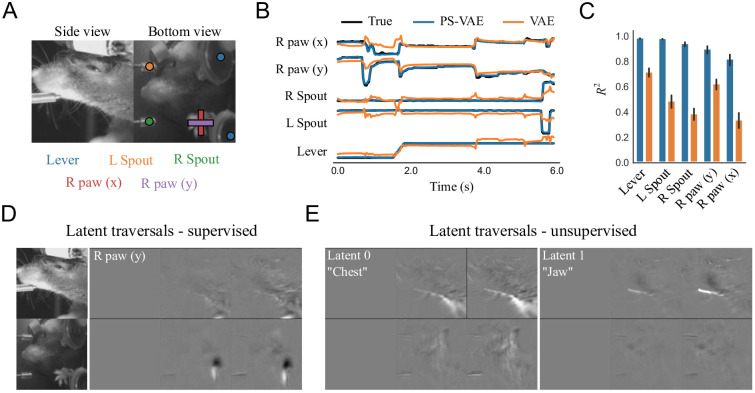
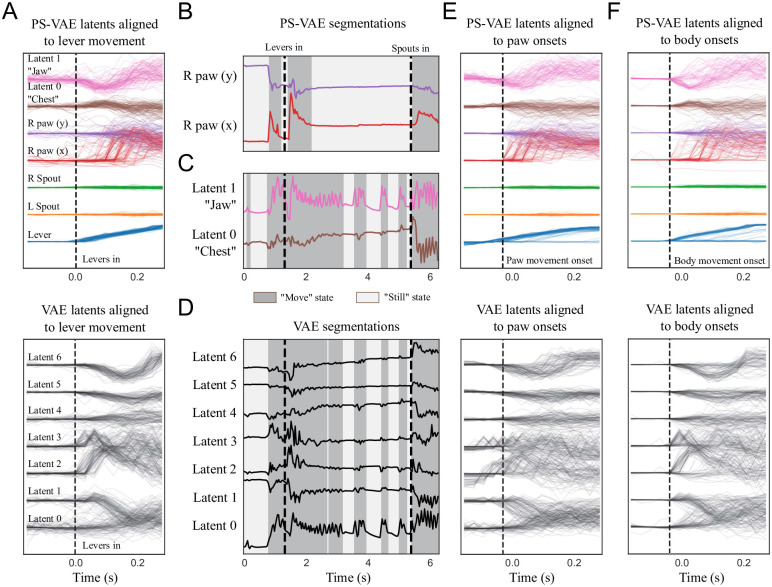
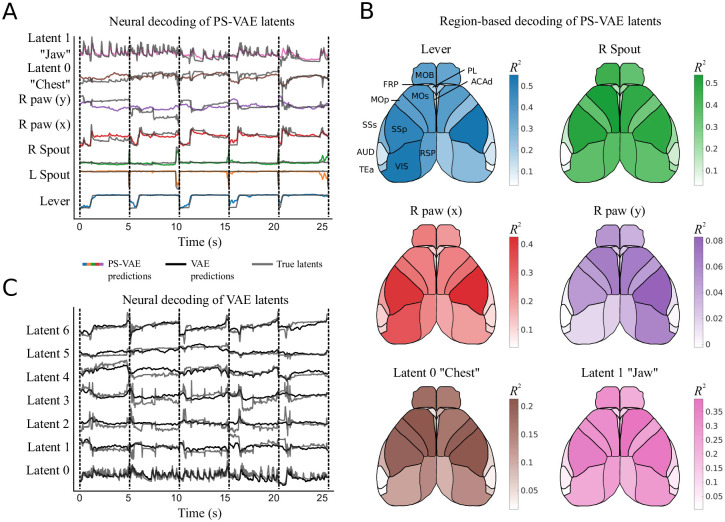
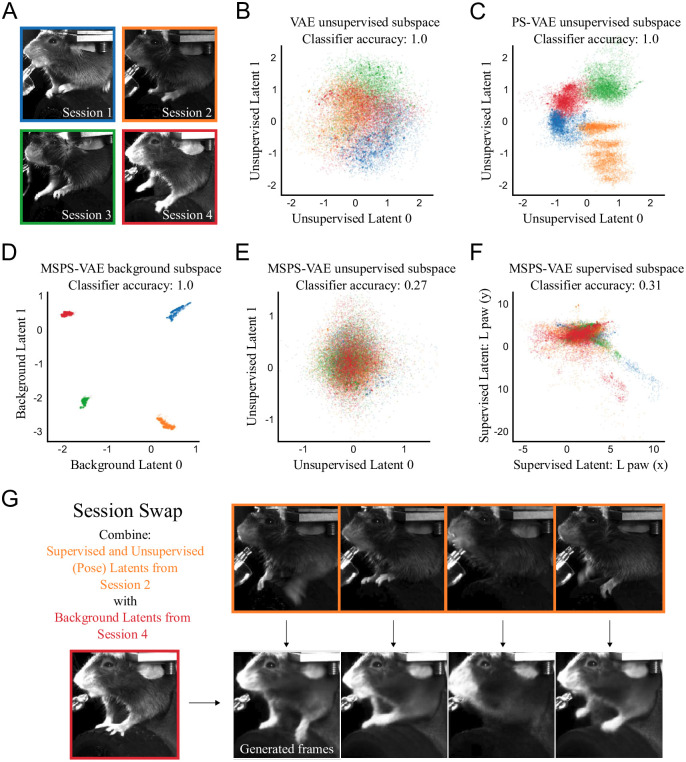
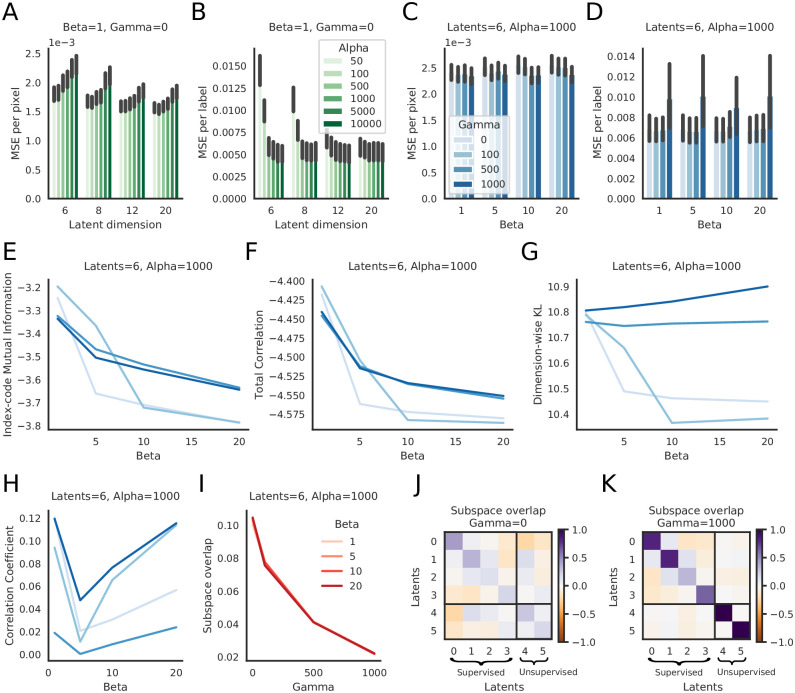
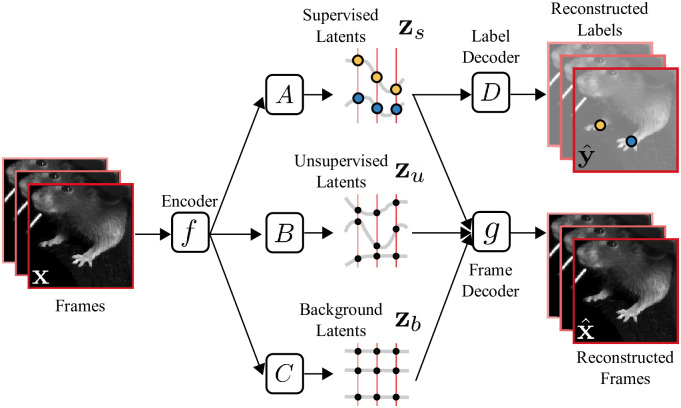
Recent neuroscience studies demonstrate that a deeper understanding of brain function requires a deeper understanding of behavior. Detailed behavioral measurements are now often collected using video cameras, resulting in an increased need for computer vision algorithms that extract useful information from video data. Here we introduce a new video analysis tool that combines the output of supervised pose estimation algorithms (e.g. DeepLabCut) with unsupervised dimensionality reduction methods to produce interpretable, low-dimensional representations of behavioral videos that extract more information than pose estimates alone. We demonstrate this tool by extracting interpretable behavioral features from videos of three different head-fixed mouse preparations, as well as a freely moving mouse in an open field arena, and show how these interpretable features can facilitate downstream behavioral and neural analyses. We also show how the behavioral features produced by our model improve the precision and interpretation of these downstream analyses compared to using the outputs of either fully supervised or fully unsupervised methods alone.


Conflict of interest statement

The authors have declared that no competing interests exist.

Figures

Fig 1
Fig 1. Overview of the Partitioned Subspace VAE (PS-VAE).
The PS-VAE takes a behavioral video as input and finds a low-dimensional latent representation that is partitioned into two subspaces: one subspace contains the supervised latent variables zs, and the second subspace contains the unsupervised latent variables zu. The supervised latent variables are required to reconstruct user-supplied labels, for example from pose estimation software (e.g. DeepLabCut [10]). The unsupervised latent variables are then free to capture remaining variability in the video that is not accounted for by the labels. This is achieved by requiring the combined supervised and unsupervised latents to reconstruct the video frames. An additional term in the PS-VAE objective function factorizes the distribution over the unsupervised latents, which has been shown to result in more interpretable latent representations [45].
Fig 2
Fig 2. The PS-VAE successfully partitions the latent representation of a head-fixed mouse video [46].
The dataset contains labels for each fore paw. A: The PS-VAE transforms frames from the video into a set of supervised latents zs and unsupervised latents zu. B: Top: A visualization of the 2D embedding of supervised latents corresponding to the horizontal coordinates of the left and right paws. Bottom: The 2D embedding of the unsupervised latents. C: The true labels (black lines) are almost perfectly reconstructed by the supervised subspace of the PS-VAE (blue lines). We also reconstruct the labels from the latent representation of a standard VAE (orange lines), which captures some features of the labels but misses much of the variability. D: Observations from the trial in C hold across all labels and test trials. Error bars represent a 95% bootstrapped confidence interval over test trials. E: To investigate individual dimensions of the latent representation, frames are generated by selecting a test frame (yellow star in B), manipulating the latent representation one dimension at a time, and pushing the resulting representation through the frame decoder. Top: Manipulation of the x coordinate of the left paw. Colored boxes indicate the location of the corresponding point in the latent space from the top plot in B. Movement along this (red) dimension results in horizontal movements of the left paw. Bottom: To better visualize subtle differences between the frames above, the left-most frame is chosen as a base frame from which all frames are subtracted. F: Same as E except the manipulation is performed with the x coordinate of the right paw. G, H: Same as E, F except the manipulation is performed in the two unsupervised dimensions. Latent 0 encodes the position of the jaw line, while Latent 1 encodes the local configuration (rather than absolute position) of the left paw. See S6 Video for a dynamic version of these traversals. See S1 Table for information on the hyperparameters used in the models for this and all subsequent figures.
Fig 3
Fig 3. The PS-VAE successfully partitions the latent representation of a freely moving mouse video.
A: Example frame from the video. The indicated points are tracked to provide labels for the PS-VAE supervised subspace. B: The true labels (black lines) and their reconstructions from the PS-VAE supervised subspace (blue lines) and a standard VAE (orange lines); both models are able to capture much of the label variability. The PS-VAE is capable of interpolating missing labels, as seen in the “Nose (x)” trace; see text for details. Only x coordinates are shown to reduce clutter. C: Observations from the example trial hold across all labels and test trials. The y coordinates of the left ear and tail base are missing because these labels are fixed by our egocentric alignment procedure. Error bars are computed as in Fig 2D. D: Frames generated by manipulating the latent corresponding to the x coordinate of the nose in the supervised subspace. E: Same as panel D except the manipulation is performed in the two unsupervised dimensions. These latents capture more detailed information about the body posture than can be reconstructed from the labels. See S12 Video for a dynamic version of these traversals.
Fig 4
Fig 4. The PS-VAE successfully partitions the latent representation of a mouse face video.
A: Example frame from the video. Pupil area and pupil location are tracked to provide labels for the PS-VAE supervised subspace. B: The true labels (black lines) are again almost perfectly reconstructed by the supervised subspace of the PS-VAE (blue lines). Reconstructions from a standard VAE (orange lines) are able to capture pupil area but miss much of the variability in the pupil location. C: Observations from the example trial hold across all labels and test trials. Error bars are computed as in Fig 2D. D: Frames generated by manipulating the representation in the supervised subspace. Top: Manipulation of the x coordinate of the pupil location. The change is slight due to a small dynamic range of the pupil position in the video, so a static blue circle is superimposed as a reference point. Bottom: Manipulation of the y coordinate of the pupil location. E: Same as panel D except the manipulation is performed in the two unsupervised dimensions. Latent 0 encodes the position of the whisker pad, while Latent 1 encodes the position of the eyelid. See S14 Video for a dynamic version of these traversals.
Fig 5
Fig 5. The PS-VAE enables targeted downstream behavioral analyses of the mouse face video.
A simple 2-state autoregressive hidden Markov model (ARHMM) is used to segment subsets of latents into “still” and “moving” states (which refer only to the behavioral features modeled by the ARHMM, not the overall behavioral state of the mouse). A: An ARHMM is fit to the two supervised latents corresponding to the pupil location, resulting in a saccade detector (S21 Video). Background colors indicate the most likely state at each time point. B: An ARHMM is fit to the single unsupervised latent corresponding to the whisker pad location, resulting in a whisking detector (S22 Video). C: Left: PS-VAE latents aligned to saccade onsets found by the model from panel A. Right: The ratio of post-saccade to pre-saccade activity shows the pupil location has larger modulation than the other latents. D: PS-VAE latents aligned to onset of whisker pad movement; the largest increase in variability is seen in the whisker pad latent. E: An ARHMM is fit to five fully unsupervised latents from a standard VAE. The ARHMM can still reliably segment the traces into “still” and “moving” periods, although these tend to align more with movements of the whisker pad than the pupil location (compare to segmentations in panels A and B). F: VAE latents aligned to saccade onsets found by the model from panel A. Variability after saccade onset increases across many latents, demonstrating the distributed nature of the pupil location representation. G: VAE latents aligned to whisker movement onsets found by the model from panel B. The whisker pad is clearly represented across all latents. This distributed representation makes it difficult to interpret individual VAE latents, and therefore does not allow for the targeted behavioral models enabled by the PS-VAE.
Fig 6
Fig 6. The PS-VAE enables targeted downstream neural analyses of the mouse face video.
A: A neural decoder is trained to map neural activity to the interpretable behavioral latents. These predicted latents can then be further mapped through the frame decoder learned by the PS-VAE to produce video frames reconstructed from neural activity. B: PS-VAE latents (gray traces) and their predictions from neural activity (colored traces) recorded in primary visual cortex with two-photon imaging. Vertical black lines delineate individual test trials. See S25 Video for a video of the full frame decoding. C: Decoding accuracy (R2) computed separately for each latent demonstrates how the PS-VAE can be utilized to investigate the neural representation of different behavioral features. Boxplots show variability over 10 random subsamples of 200 neurons from the full population of 1370 neurons. D: Standard VAE latents (gray traces) and their predictions from the same neural activity (black traces). E: Decoding accuracy for each VAE dimension reveals one dimension that is much better decoded than the rest, but the distributed nature of the VAE representation makes it difficult to understand which behavioral features the neural activity is predicting.
Fig 7
Fig 7. The PS-VAE successfully partitions the latent representation of a two-view mouse video [22].
A: Example frames from the video. Mechanical equipment (lever and two independent spouts) as well as the single visible paw are tracked to provide labels for the PS-VAE supervised subspace. By tracking the moving mechanical equipment, the PS-VAE can isolate this variability in a subset of the latent dimensions, allowing the remaining dimensions to solely capture the animal’s behavior. B: The true labels (black lines) are again almost perfectly reconstructed by the supervised subspace of the PS-VAE (blue lines). Reconstructions from a standard VAE (orange lines) miss much of the variability in these labels. C: Observations from the example trial hold across all labels and test trials. Error bars are computed as in Fig 2D. D: Frames generated by manipulating the y coordinate of the tracked paw results in changes in the paw position, and only small changes in the side view. Only differenced frames are shown for clarity. E: Manipulation of the two unsupervised dimensions. Latent 0 (left) encodes the position of the chest, while Latent 1 (right) encodes the position of the jaw. The contrast of the latent traversal frames has been increased for visual clarity. See S16 Video for a dynamic version of these traversals.
Fig 8
Fig 8. The PS-VAE enables targeted downstream behavioral analyses of the two-view mouse video.
A: PS-VAE latents (top) and VAE latents (bottom) aligned to the lever movement. The PS-VAE isolates this movement in the first (blue) dimension, and variability in the remaining dimensions is behavioral rather than mechanical. The VAE does not clearly isolate the lever movement, and as a result it is difficult to distinguish variability that is mechanical versus behavioral. B: An ARHMM is fit to the two supervised latents corresponding to the paw position (S23 Video). Background colors as in Fig 5. C: An ARHMM is fit to the two unsupervised latents corresponding to the chest and jaw, resulting in a “body” movement detector that is independent of the paw (S24 Video). D: An ARHMM is fit to seven fully unsupervised latents from a standard VAE. The “still” and “moving” periods tend to align more with movements of the body than the paw (compare to panels B and C). E: PS-VAE latents (top) and VAE latents (bottom) aligned to the onsets of paw movement found in B. This movement also is often accompanied by movements of the jaw and chest, although this is impossible to ascertain from the VAE latents. F: This same conclusion holds when aligning the latents to the onsets of body movement.
Fig 9
Fig 9. The PS-VAE enables a detailed brain region-to-behavior mapping in the two-view mouse dataset.
A: PS-VAE latents (gray traces) and their predictions from neural activity (colored traces) recorded across dorsal cortex with widefield calcium imaging. Vertical dashed black lines delineate individual test trials. See S26 Video for a video of the full frame decoding. B: The behavioral specificity of the PS-VAE can be combined with the anatomical specificity of computational tools like LocaNMF [19] to produce detailed mappings from distinct neural populations to distinct behavioral features. Region acronyms are defined in Table 1. C: VAE latents (gray traces) and their predictions from the same neural activity as in A (black traces). The distributed behavioral representation produced by the VAE does not allow for the same region-to-behavior mappings enabled by the PS-VAE.
Fig 10
Fig 10. The multi-session PS-VAE (MSPS-VAE) accounts for session-level differences between videos in the head-fixed mouse dataset [46].
A: One example frame from each of four experimental sessions with variation in lighting, experimental equipment, and animal appearance. B: Distribution of two latents from a VAE trained on all four sessions. Noticeable session-related structure is present, and a linear classifier can perfectly predict session identity on held-out test data (note the VAE has a total of eleven latent dimensions). Colors correspond to borders in panel A. C: Distribution of two unsupervised latents from a PS-VAE. D: Distribution of two background latents from an MSPS-VAE, which are designed to contain all of the static across-session variability. E: Distribution of two unsupervised latents from an MSPS-VAE. Note the lack of session-related structure; a linear classifier can only predict 27% of the data points correctly (chance level is 25%). F: Distribution of two supervised latents from an MSPS-VAE. G: Example of a “session swap” where the pose of one mouse is combined with the background appearance of another mouse to generate new frames. These swaps qualitatively demonstrate the model has learned to successfully encode these different features in the proper subspaces. See S27 Video for a dynamic version of these swaps.
Fig 11
Fig 11. PS-VAE hyperparameter selection for the head-fixed mouse dataset.
A: MSE per pixel as a function of latent dimensionality and the hyperparameter α, which controls the strength of the label reconstruction term. The frame reconstruction is robust across many orders of magnitude. B: MSE per label as a function of latent dimensionality and α. As the latent dimensionality increases the model becomes more robust to α, but is sensitive to this value when the model has few latents due to the strong tradeoff between frame and label reconstruction. Subsequent panels detail β and γ with a 6D model and α = 1000. C: MSE per pixel as a function of β and γ; frame reconstruction is robust to both of these hyperprameters. D: MSE per label as a function of β and γ; label reconstruction is robust to both of these hyperprameters. E: Index code mutual information (ICMI; see Eq 13) as a function of β and γ. The ICMI, although not explicitly penalized by β, is affected by this hyperparameter. F: Total Correlation (TC) as a function of β and γ. Increasing β decreases the TC as desired. G: Dimension-wise KL (DWKL) as a function of β and γ. The DWKL, although not explicitly penalized by β, is affected by this hyperparameter. H: Pearson correlation in the model’s 2D unsupervised subspace as a function of β and γ. I: The subspace overlap as defined by ‖UUTI2 (where U = [A;B] and I the identity) as a function of β and γ. Increasing γ leads to an orthogonalized latent space, while varying β has no effect. J: Example subspace overlap matrix (UUT) for γ = 0. The upper left 4x4 block represents the supervised subspace, the lower right 2x2 block represents the unusupervised subspace. K: Example subspace overlap matrix for γ = 1000; the subspace is close to orthogonal. Error bars in panels A-D represent 95% bootstrapped confidence interval over test trials; line plots in panels E-H are the mean values over test trials, and confidence intervals are omitted for clarity.
Fig 12
Fig 12. Overview of the multi-session Partitioned Subspace VAE (MSPS-VAE).
The MSPS-VAE finds a low-dimensional latent representation of a behavioral video that is partitioned into three subspaces: one subspace contains the supervised latent variables zs (present in the PS-VAE), a second subspace contains the unsupervised latent variables zu (present in the PS-VAE), and the third subspace contains the background latent variables zb which capture inter-session variability, and are new to the MSPS-VAE formulation. The supervised latent variables are required to reconstruct user-supplied labels, while all three sets of latent variables are together required to reconstruct the video frames.

References

    1. Anderson DJ, Perona P. Toward a science of computational ethology. Neuron. 2014;84(1):18–31. doi: 10.1016/j.neuron.2014.09.005 - DOI - PubMed
    1. Gomez-Marin A, Paton JJ, Kampff AR, Costa RM, Mainen ZF. Big behavioral data: psychology, ethology and the foundations of neuroscience. Nature neuroscience. 2014;17(11):1455–1462. doi: 10.1038/nn.3812 - DOI - PubMed
    1. Krakauer JW, Ghazanfar AA, Gomez-Marin A, MacIver MA, Poeppel D. Neuroscience needs behavior: correcting a reductionist bias. Neuron. 2017;93(3):480–490. doi: 10.1016/j.neuron.2016.12.041 - DOI - PubMed
    1. Berman GJ. Measuring behavior across scales. BMC biology. 2018;16(1):23. doi: 10.1186/s12915-018-0494-7 - DOI - PMC - PubMed
    1. Datta SR, Anderson DJ, Branson K, Perona P, Leifer A. Computational neuroethology: a call to action. Neuron. 2019;104(1):11–24. doi: 10.1016/j.neuron.2019.09.038 - DOI - PMC - PubMed

Publication types

MeSH terms