. 2021 Nov;11(11):3101-3114.
doi: 10.1002/2211-5463.13303. Epub 2021 Oct 6.

Ferritin heavy chain (FTH1) exerts significant antigrowth effects in breast cancer cells by inhibiting the expression of c-MYC

Affiliations

Ferritin heavy chain (FTH1) exerts significant antigrowth effects in breast cancer cells by inhibiting the expression of c-MYC

Amjad Ali et al. FEBS Open Bio. 2021 Nov.

Abstract

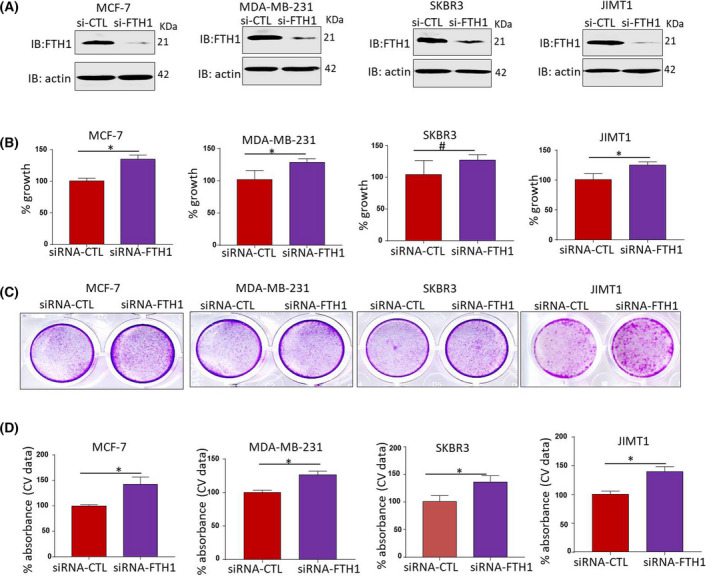
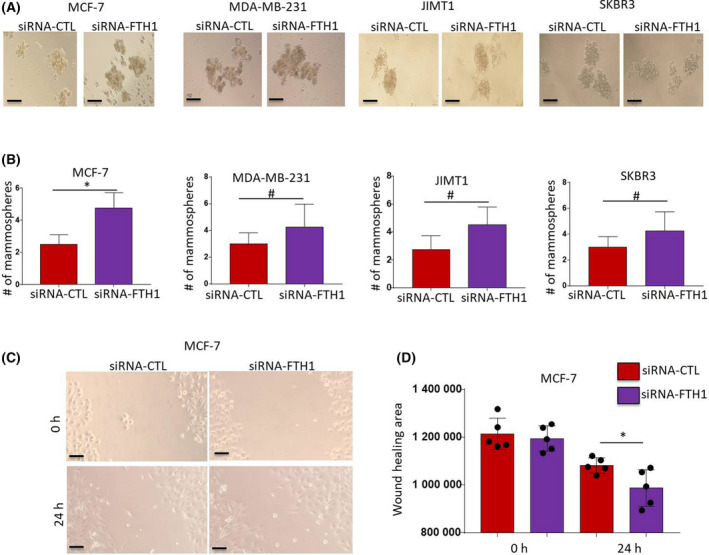
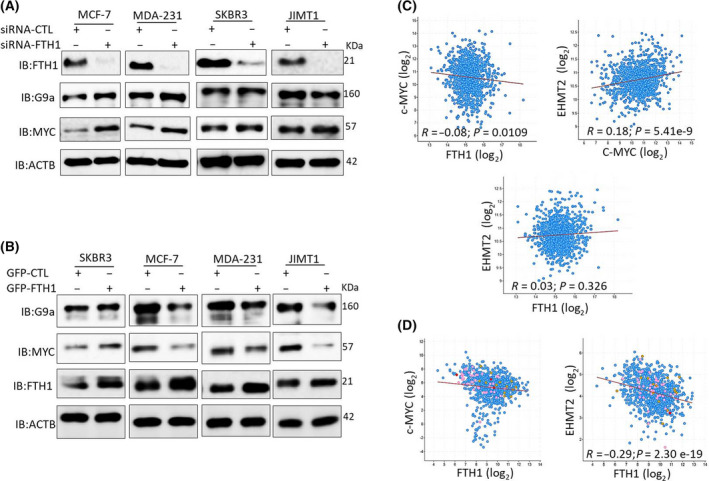
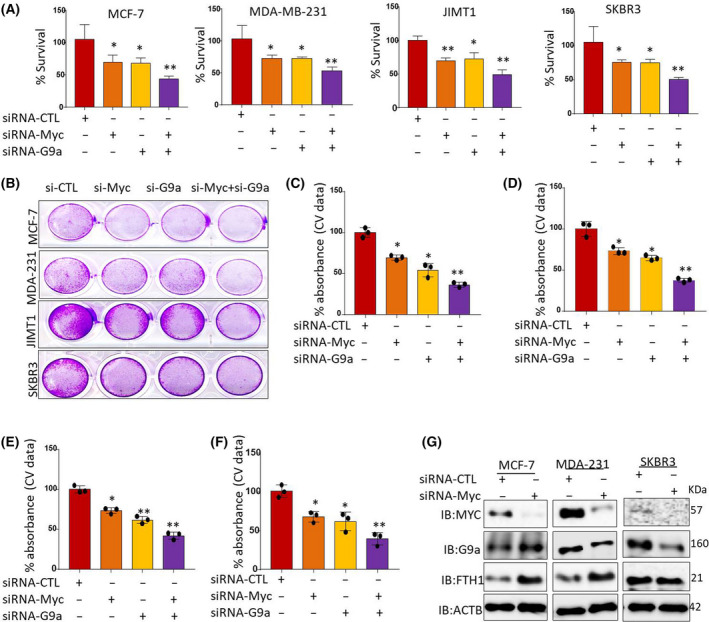
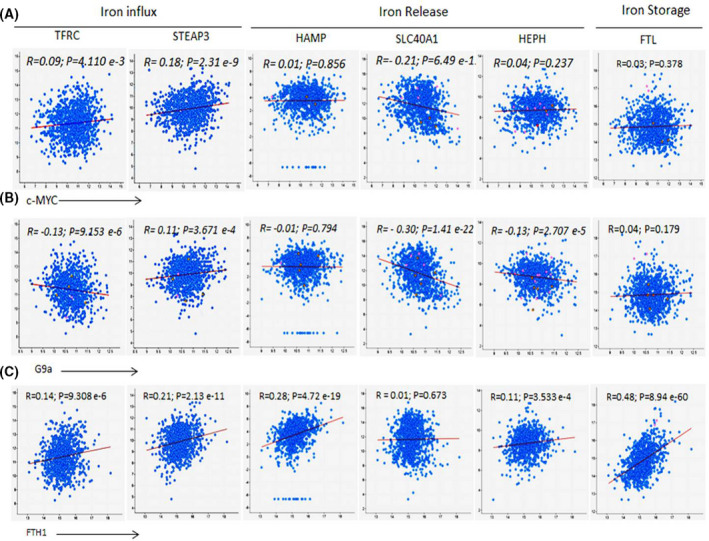
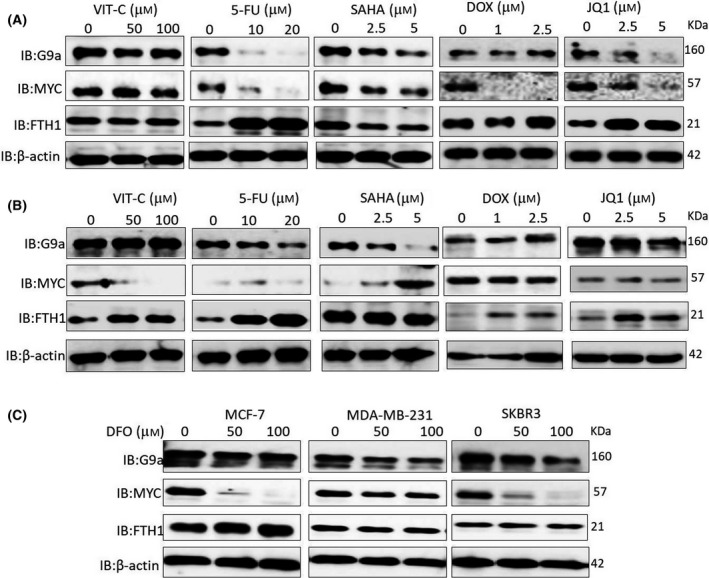
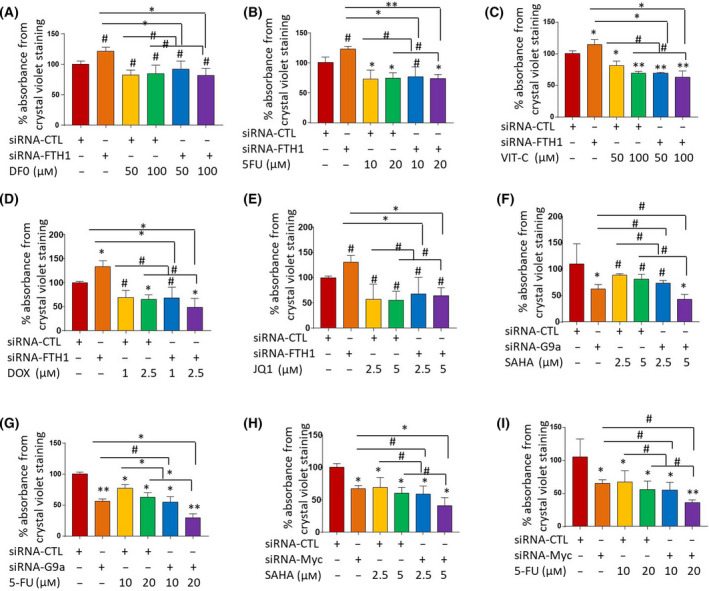
Overexpression of ferritin heavy chain (FTH1) often associates with good prognosis in breast cancer (BCa), particularly in the triple-negative subtype (triple-negative breast cancer). However, the mechanism by which FTH1 exerts its possible tumor suppressor effects in BCa is not known. Here, we examined the bearing of FTH1 silencing or overexpression on several aspects of BCa cell growth in vitro. FTH1 silencing promoted cell growth and mammosphere formation, increased c-MYC expression, and reduced cell sensitivity to chemotherapy. In contrast, FTH1 overexpression inhibited cell growth, decreased c-MYC expression, and sensitized cancer cells to chemotherapy; silencing of c-MYC recapitulated the effects of FTH1 overexpression. These findings show for the first time that FTH1 suppresses tumor growth by inhibiting the expression of key oncogenes, such as c-MYC.

Keywords: FTH1; G9a; breast cancer; c-MYC; iron metabolism.


Conflict of interest statement

The authors declare no conflict interest.

Figures

Fig. 1
Fig. 1
FTH1 knockdown promotes BCa cell growth. (A) Knockdown efficiency of FTH1 in MCF‐7, MDA‐MB‐231, JIMT1, and SKBR3 cell lines at 72 h post‐transfection with control or FTH1‐specific siRNA. Cell growth in MDA‐MB‐231, JIMT1, SKBR3, and MCF‐7 cells at 72 h post‐transfection with control or FTH1‐specific siRNA was evaluated by (B) MTT and (C, D) CV staining. Error bars represent the mean ± SD based on 5 (B) and 3 (D) independent experiments. Statistical analysis was performed using the Student t‐test; *P < 0.05; # no significant difference.
Fig. 2
Fig. 2
Overexpression of FTH1 inhibits BCa cell growth. (A) Overexpression efficiency of FTH1 in MCF‐7, MDA‐MB‐231, JIMT1, and SKBR3 cell lines at 72 h post‐transfection with control or FTH1‐overexpression encoding plasmids. Cell growth in MDA‐MB‐231, JIMT1, SKBR3, and MCF‐7 cells at 72 h post‐transfection with control or FTH1 overexpression was evaluated by (B) MTT and (C, D) CV staining. Error bars represent the mean ± SD based on 4 (B) and 3 (D) independent experiments. Statistical analysis was performed using the Student t‐test; *P < 0.05.
Fig. 3
Fig. 3
FTH1 knockdown promotes mammosphere formation efficiency and cell migration in BCa cells. (A) Mammosphere formation was evaluated in MDA‐MB‐231, JIMT1, SKBR3, and MCF‐7 cells transfected with control or FTH1‐specific siRNA and cultured in ultra‐low attachment plates for 7 days post‐transfection (20× magnification). (B) Error bars represent the mean ± SD of mammosphere numbers based on four independent experiments. (C) Wound‐healing assay was performed in MCF‐7 cells transfected with control or FTH1‐specific siRNA for 72 h post‐transfection (20× magnification); scale bar represents 200 μm. (D) Mean ± SD of wound‐healing area at 24 h postwound administration based on five independent experiments. Statistical analysis was performed using the Student t‐test; *P < 0.05; # no significant difference.
Fig. 4
Fig. 4
FTH1 expression negatively correlates with c‐MYC and G9a in BCa cell lines and tissues. (A) Expression of FTH1, c‐MYC, and G9a was evaluated by western blotting in MDA‐MB‐231, JIMT1, SKBR3, and MCF‐7 cells at 72 h post‐FTH1 silencing. (B) Expression of FTH1, c‐MYC, and G9a was evaluated by western blotting in MDA‐MB‐231, JIMT1, SKBR3, and MCF‐7 cells at 72 h post‐FTH1 overexpression. Coexpression analysis of FTH1 vs c‐MYC, FTH1 vs G9a (EHMT2), and c‐MYC vs G9a in (C) 1084 BCa tissue samples (Breast Invasive Carcinoma, TCGA, PanCancer Atlas, 2018) and (D) in 921 cancer cell lines (Broad Institute and Novartis, 2019; Broad CCLE Portal.) using the c‐BioPortal Cancer Genomics portal.
Fig. 5
Fig. 5
Silencing of c‐Myc and/or G9a upregulates FTH1 and inhibits BCa cell growth. Cell growth was assessed by (A) MTT and (B) CV staining in c‐MYC‐ and/or G9a‐silenced MDA‐MB‐231, MCF‐7, SKBR3, and JIMT1 cells at 72 h post‐transfection; error bars in A represent the mean ± SD based on four independent experiments. (C–F) Mean ± SD of CV absorbance values based on three independent experiments. t‐Test was performed. *P < 0.05; **P < 0.005. (G) Expression of FTH1, c‐MYC, and G9a in c‐MYC‐silenced MDA‐MB‐231, SKBR3, and MCF‐7 cells at 72 h post‐transfection; cells transfected with control siRNA served as negative control; β‐actin was used as a loading control.
Fig. 6
Fig. 6
Correlation of FTH1, MYC, and G9a with key IRGs in BCa samples. mRNA coexpression analysis of (A) c‐MYC, (B) G9a, or (C) FTH1 vs genes that encode the TfR1 gene (TFRC), STEAP3, hepcidin (HAMP), FPN (SLC40A1), hephaestin (HEPH), and FTL chain using TCGA BCa dataset (1084 patient samples; http://www.cbioportal.org); R and P values were generated using Pearson statistic.
Fig. 7
Fig. 7
Anticancer drugs and iron chelation reduce c‐MYC and G9a expression and increase FTH1 expression in BCa cells. (A) MCF‐7 and (B) MDA‐MB‐231 cells treated with the indicated doses of vitamin C, 5‐FU, SAHA, doxorubicin, and JQ1 for 48 h were assessed for the expression of FTH1, c‐MYC, and G9a by western blot. (C) The expression of FTH1, c‐MYC, and G9a was also examined in MCF‐7, MDA‐MB‐231, and SKBR3 cells treated with 50 or 100 µm of DFO for 48 h relative to untreated controls. β‐Actin was used as a loading control.
Fig. 8
Fig. 8
Reduced c‐MYC and G9a expression associates with enhanced cell sensitivity to chemotherapy. Viability of MCF‐7 cells silenced for FTH1 24 h prior to treatment with increasing concentrations of (A) DFO, (B) 5‐FU, (C) vitamin C, (D) doxorubicin, or (E) JQ1. (A‐E) Error bars show the mean ± SD from four replicated experiments. Cell viability of MCF‐7 cells silenced for G9a 24 h prior to treatment with increasing concentrations of (F) SAHA or (G) 5‐FU or silenced for c‐MYC 24 h prior to treatment with increasing concentrations of (H) SAHA or (I) 5‐FU. MCF‐7 cells silenced for c‐MYC 24 h prior to treatment with increasing concentrations of SAHA or 5‐FU. Cell viability was assessed by CV staining at 72 h post‐treatment. (F, I) Error bars show the mean ± SD from four replicated experiments. One‐way ANOVA was performed to test for statistical significance among multiple groups; *P < 0.05, **P < 0.005, # not significant.

References

    1. Bray F, Ferlay J, Soerjomataram I, Siegel RL, Torre LA and Jemal A (2018) Global cancer statistics 2018: GLOBOCAN estimates of incidence and mortality worldwide for 36 cancers in 185 countries. CA Cancer J Clin 68, 394–424. - PubMed
    1. Harbeck N, Penault‐Llorca F, Cortes J, Gnant M, Houssami N, Poortmans P, Ruddy K, Tsang J and Cardoso F (2019) Breast cancer. Nat Rev Dis Primers 5, 66. - PubMed
    1. Torti SV and Torti FM (2013) Cellular iron metabolism in prognosis and therapy of breast cancer. Crit Rev Oncog 18, 435–448. - PMC - PubMed
    1. Harrison PM and Arosio P (1996) The ferritins: molecular properties, iron storage function and cellular regulation. Biochim Biophys Acta 1275, 161–203. - PubMed
    1. Lawson DM, Artymiuk PJ, Yewdall SJ, Smith JM, Livingstone JC, Treffry A, Luzzago A, Levi S, Arosio P and Cesareni G (1991) Solving the structure of human H ferritin by genetically engineering intermolecular crystal contacts. Nature 349, 541–544. - PubMed

Publication types

MeSH terms