. 2021 Sep 21;36(12):109727.
doi: 10.1016/j.celrep.2021.109727.

CCR2 deficiency alters activation of microglia subsets in traumatic brain injury

Affiliations

CCR2 deficiency alters activation of microglia subsets in traumatic brain injury

Kerri Somebang et al. Cell Rep. .

Abstract

In traumatic brain injury (TBI), a diversity of brain resident and peripherally derived myeloid cells have the potential to worsen damage and/or to assist in healing. We define the heterogeneity of microglia and macrophage phenotypes during TBI in wild-type (WT) mice and Ccr2-/- mice, which lack macrophage influx following TBI and are resistant to brain damage. We use unbiased single-cell RNA sequencing methods to uncover 25 microglia, monocyte/macrophage, and dendritic cell subsets in acute TBI and normal brains. We find alterations in transcriptional profiles of microglia subsets in Ccr2-/- TBI mice compared to WT TBI mice indicating that infiltrating monocytes/macrophages influence microglia activation to promote a type I IFN response. Preclinical pharmacological blockade of hCCR2 after injury reduces expression of IFN-responsive gene, Irf7, and improves outcomes. These data extend our understanding of myeloid cell diversity and crosstalk in brain trauma and identify therapeutic targets in myeloid subsets.

Keywords: CCR2; dendritic cells; innate immunity; macrophages; microglia; monocytes; neuroinflammation; single-cell RNA sequencing; traumatic brain injury; type I IFN.


Conflict of interest statement

Declaration of interests I.C., B.A.Z., J.C., and R.S. are presently or were employees of ChemoCentryx during this study. B.T.W., S.G., L.J., M.C., G.B., and E.D.P. are presently or were employees of Biogen during this study. B.T.W. is currently employed by Moderna. C.J.Y. is a Scientific Advisory Board member for and hold equity in Related Sciences and ImmunAI, a consultant for and hold equity in Maze Therapeutics, and a consultant for TReX Bio. C.J.Y. has received research support from Chan Zuckerberg Initiative, Chan Zuckerberg Biohub, and Genentech. A U.S. Provisional Patent Application No. 63/177,727 for the use of CCX872 in TBI, spinal cord injury, or stroke was filed April 21, 2021.

Figures

Figure 1.
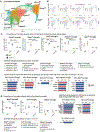
Figure 1.. Defining cell lineages of clusters from scRNA-seq of white cells from ipsilateral acute TBI and normal brain tissues from Ccr2−/− and WT mice
(A) Representative flow-cytometry gates of LIVE CD45+Ly6G cells sorted from ipsilateral brain hemispheres from WT TBI mice (4 days post-injury, n = 3 animals, 1 animal/sample), Ccr2−/− TBI mice (n = 3 animals, 1 animal/sample) and normal control mice (n = 2-3 animals/group, 1 animal/sample). (B) UMAP visualization of identified cell lineages of 111,717 cells from all animal groups combined. (C) Dot plot of cell-lineage marker expression that was used to help define clusters for microglia (Sall1), monocyte/macrophages (Ccr2), dendritic cells (Flt3), B cells (Cd19), T cells (CD3e), NK cells (Ncr1), neutrophils (Ly6g), neurons (Slc12a5), astrocytes (Aldh1l1), and oligodendrocytes (Mog). (D) Cell proportions of microglia and circulating leukocytes per brain hemisphere by genotype and by injury show that TBI induced increases in macrophages/dendritic cells. Ccr2 deficiency robustly reduced the macrophage/dendritic cells in the ipsilateral brain tissue post-TBI.
Figure 2.
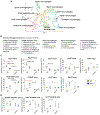
Figure 2.. Quantification and gene-expression analysis of microglia subsets reveal subsets upregulated in TBI and pathways associated with Ccr2
(A) ScRNA-seq and clustering analysis of all microglia (102,997 microglia analyzed) from all samples (n = 11 individual animals: n = 3 per TBI animal group; n = 2–3 per control animal group) separated the microglia into 13 distinct subsets as visualized by a UMAP. (B) Gene-expression plots of selected top DEGs. Irf7 was a DEG of Cxcl10hi and Ifi27l2ahi microglia subsets, Ccl4 and Clec7a were DEGS of Ccl4hi microglia, Tnf was the top DEG for Nfkbiahi microglia. Irf7-, Ccl4-, and Clec7a-expressing microglia were present in normal brain tissue and expanded in TBI. (C) Quantification of microglia subsets that significantly increased in proportion relative to all microglia analyzed during acute TBI compared to normal brains (n = 3/TBI group, n = 2–3/control group). The proportions of Ccl4hi microglia were decreased in Ccr2−/− TBI mice compared to WT TBI (p = 0.01). Proportions (top; mean ± SD) and pathway enrichment analysis (middle) for each microglia subset that increase in TBI are shown. Differential expression analysis between WT TBI and Ccr2−/− TBI microglia subsets are shown (bottom). Many ISGs were consistently and significantly upregulated in WT TBI microglia subsets and are highlighted in salmon color (p = 2E-8 to 4E-118). (D) Analysis of a few microglia subsets that did not alter proportions relative to all microglia during TBI. Gene ontology (GO) analysis of DEGs of these subsets showed that they shared a response to IL-1. Some of these microglia showed transcriptional differences between WT and Ccr2−/− mice. Differential expression analysis between WT TBI and Ccr2−/− TBI microglia subsets revealed increased ISG expression in WT TBI Btg2hi and Junhi microglia (right).
Figure 3.
Figure 3.. Histological validation and quantification of microglia subsets at the injury site
(A) Four days after TBI or sham surgery, immunohistochemistry was performed on brain tissue sections with costaining for CXCL10 (green), IBA1 (red), NEUN (blue), and DAPI (white). The hippocampus and thalamic regions were analyzed. Scale bars indicate 20 μm. (B) CXCL10 and IBA1 co-localized in cells in the ipsilateral hippocampus and thalamus in magnified insets. (C) Quantification of IBA1+ CXCL10+ microglia/macrophages per square mm revealed a significant increase in cell numbers in the ipsilateral TBI hemisphere compared to sham animals (p = 0.017) (n = 4 TBI; n = 4 sham). (D) Immunohistochemistry on brain tissue post-TBI for the cell-proliferation marker, Ki67 (brown), and IBA-1 (purple). Scale bar indicates 200 μm for far-left and far-right images. (E) Quantification of Ki67 and IBA1 expressing cells demonstrated elevated proliferative (p = 0.003) and non-proliferative (p = 0.0004) microglia/macrophages in the ipsilateral TBI hemisphere compared to sham controls (n = 3 TBI; n = 4 sham).
Figure 4.
Figure 4.. Monocyte/macrophage and dendritic cell subcluster analysis
(A) UMAP visualization of nine monocyte/macrophage subclusters and two dendritic cell subclusters in addition to the Ccr7hi dendritic cell cluster from all animal groups (n = 11 individual animal samples: n = 3 per TBI animal group; n = 2–3 per control animal group. The total number of monocyte/dendritc cells analyzed were 4,076). (B) GO analysis of five selected monocyte/macrophage and dendritic cell subclusters showed that macrophage/dendritic cells are enriched in type I IFN response genes and wound-healing genes. (C and D) Quantification of proportions of monocyte/macrophage subsets (C) and proportions (D) of dendritic cell subsets (mean ± SD) in TBI as a percentage of all monocyte/macrophages/dendritic cells analyzed.
Figure 5.
Figure 5.. Validation of Ly6Chi protein co-expression with Chil3 in TBI macrophage subsets by flow cytometry
(A) Flow-cytometry gating strategy for TBI day 4 ipsilateral brain white cells that are LIVE, CD45hiCD11b+, and Ly6G. Cells were further gated for their binding to RNA probes for Chil3, Arg1, Gpnmb, and a control RNA probe for Dapb (data are representative of three independent experiments). (B) Histogram analysis for Ly6C surface expression on gated TBI macrophages showed that Ly6C was preferentially highly expressed in 60% of Chil3+ TBI macrophages by flow cytometry. Arg1 expression was distinct from Chil3 expression as Arg1 was predominantly found in Ly6Clo cells. Gpnmb served as a co-expression marker for Arg1. FMO, fluorescence minus one. (C) UMAP visualization of all cells as in Figure 1B and their expression of signature M(IL-4) genes, Arg1, Chil3, and Mrc1.
Figure 6.
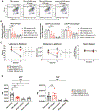
Figure 6.. Targeting hCCR2 pharmacologically after TBI in hCCR2 knockin mice led to reduced macrophage infiltration into the brain, improved cognitive memory, and reduced expression of a key ISG, Irf7
(A) hCCR2 knockin mice were administered CCX872 at 30 mg/kg (mpk), 100 mpk, or vehicle beginning 2 h post-surgery. Flow-cytometry analysis of microglia and macrophages proportions in the brain 1 day after surgery are shown. Ly6G viable cells are shown. Data represent at least three independent experiments. (B) Absolute macrophage numbers in ipsilateral hemispheres 4 days post-TBI or sham surgery were quantified by flow cytometry (n = 8–10 per TBI group; n = 3 per sham group) (*p < 0.05, **p < 0.01, ***p < 0.001, ****p < 0.0001). (C) A cued platform version of the Morris water maze was performed beginning 4 weeks post-surgery (n = 17 per TBI group; n = 4–9 per sham group). Data are shown with statistics reflecting rank summary score analysis. (D) Relative gene-expression analysis of ipsilateral brain hemispheres 4 days post-TBI or sham surgery was performed in triplicate with biological replicates (n = 9–10 per TBI group; n = 3–5 per sham group). Two independent experiments were performed.

References

    1. Becht E, McInnes L, Healy J, Dutertre CA, Kwok IWH, Ng LG, Ginhoux F, and Newell EW (2018). Dimensionality reduction for visualizing single-cell data using UMAP. Nat. Biotechnol Published online December 3, 2018. 10.1038/nbt.4314. - DOI - PubMed
    1. Bennett ML, Bennett FC, Liddelow SA, Ajami B, Zamanian JL, Fernhoff NB, Mulinyawe SB, Bohlen CJ, Adil A, Tucker A, et al. (2016). New tools for studying microglia in the mouse and human CNS. Proc. Natl. Acad. Sci. USA 113, E1738–E1746. - PMC - PubMed
    1. Boring L, Gosling J, Cleary M, and Charo IF (1998). Decreased lesion formation in CCR2−/− mice reveals a role for chemokines in the initiation of atherosclerosis. Nature 394, 894–897. - PubMed
    1. Butler A, Hoffman P, Smibert P, Papalexi E, and Satija R (2018). Integrating single-cell transcriptomic data across different conditions, technologies, and species. Nat. Biotechnol 36, 411–420. - PMC - PubMed
    1. Buttgereit A, Lelios I, Yu X, Vrohlings M, Krakoski NR, Gautier EL, Nishinakamura R, Becher B, and Greter M (2016). Sall1 is a transcriptional regulator defining microglia identity and function. Nat. Immunol 17, 1397–1406. - PubMed

Publication types

MeSH terms