. 2021 Sep 21;36(12):109742.
doi: 10.1016/j.celrep.2021.109742.

Brown adipocyte ATF4 activation improves thermoregulation and systemic metabolism

Affiliations

Brown adipocyte ATF4 activation improves thermoregulation and systemic metabolism

Esther Paulo et al. Cell Rep. .

Abstract

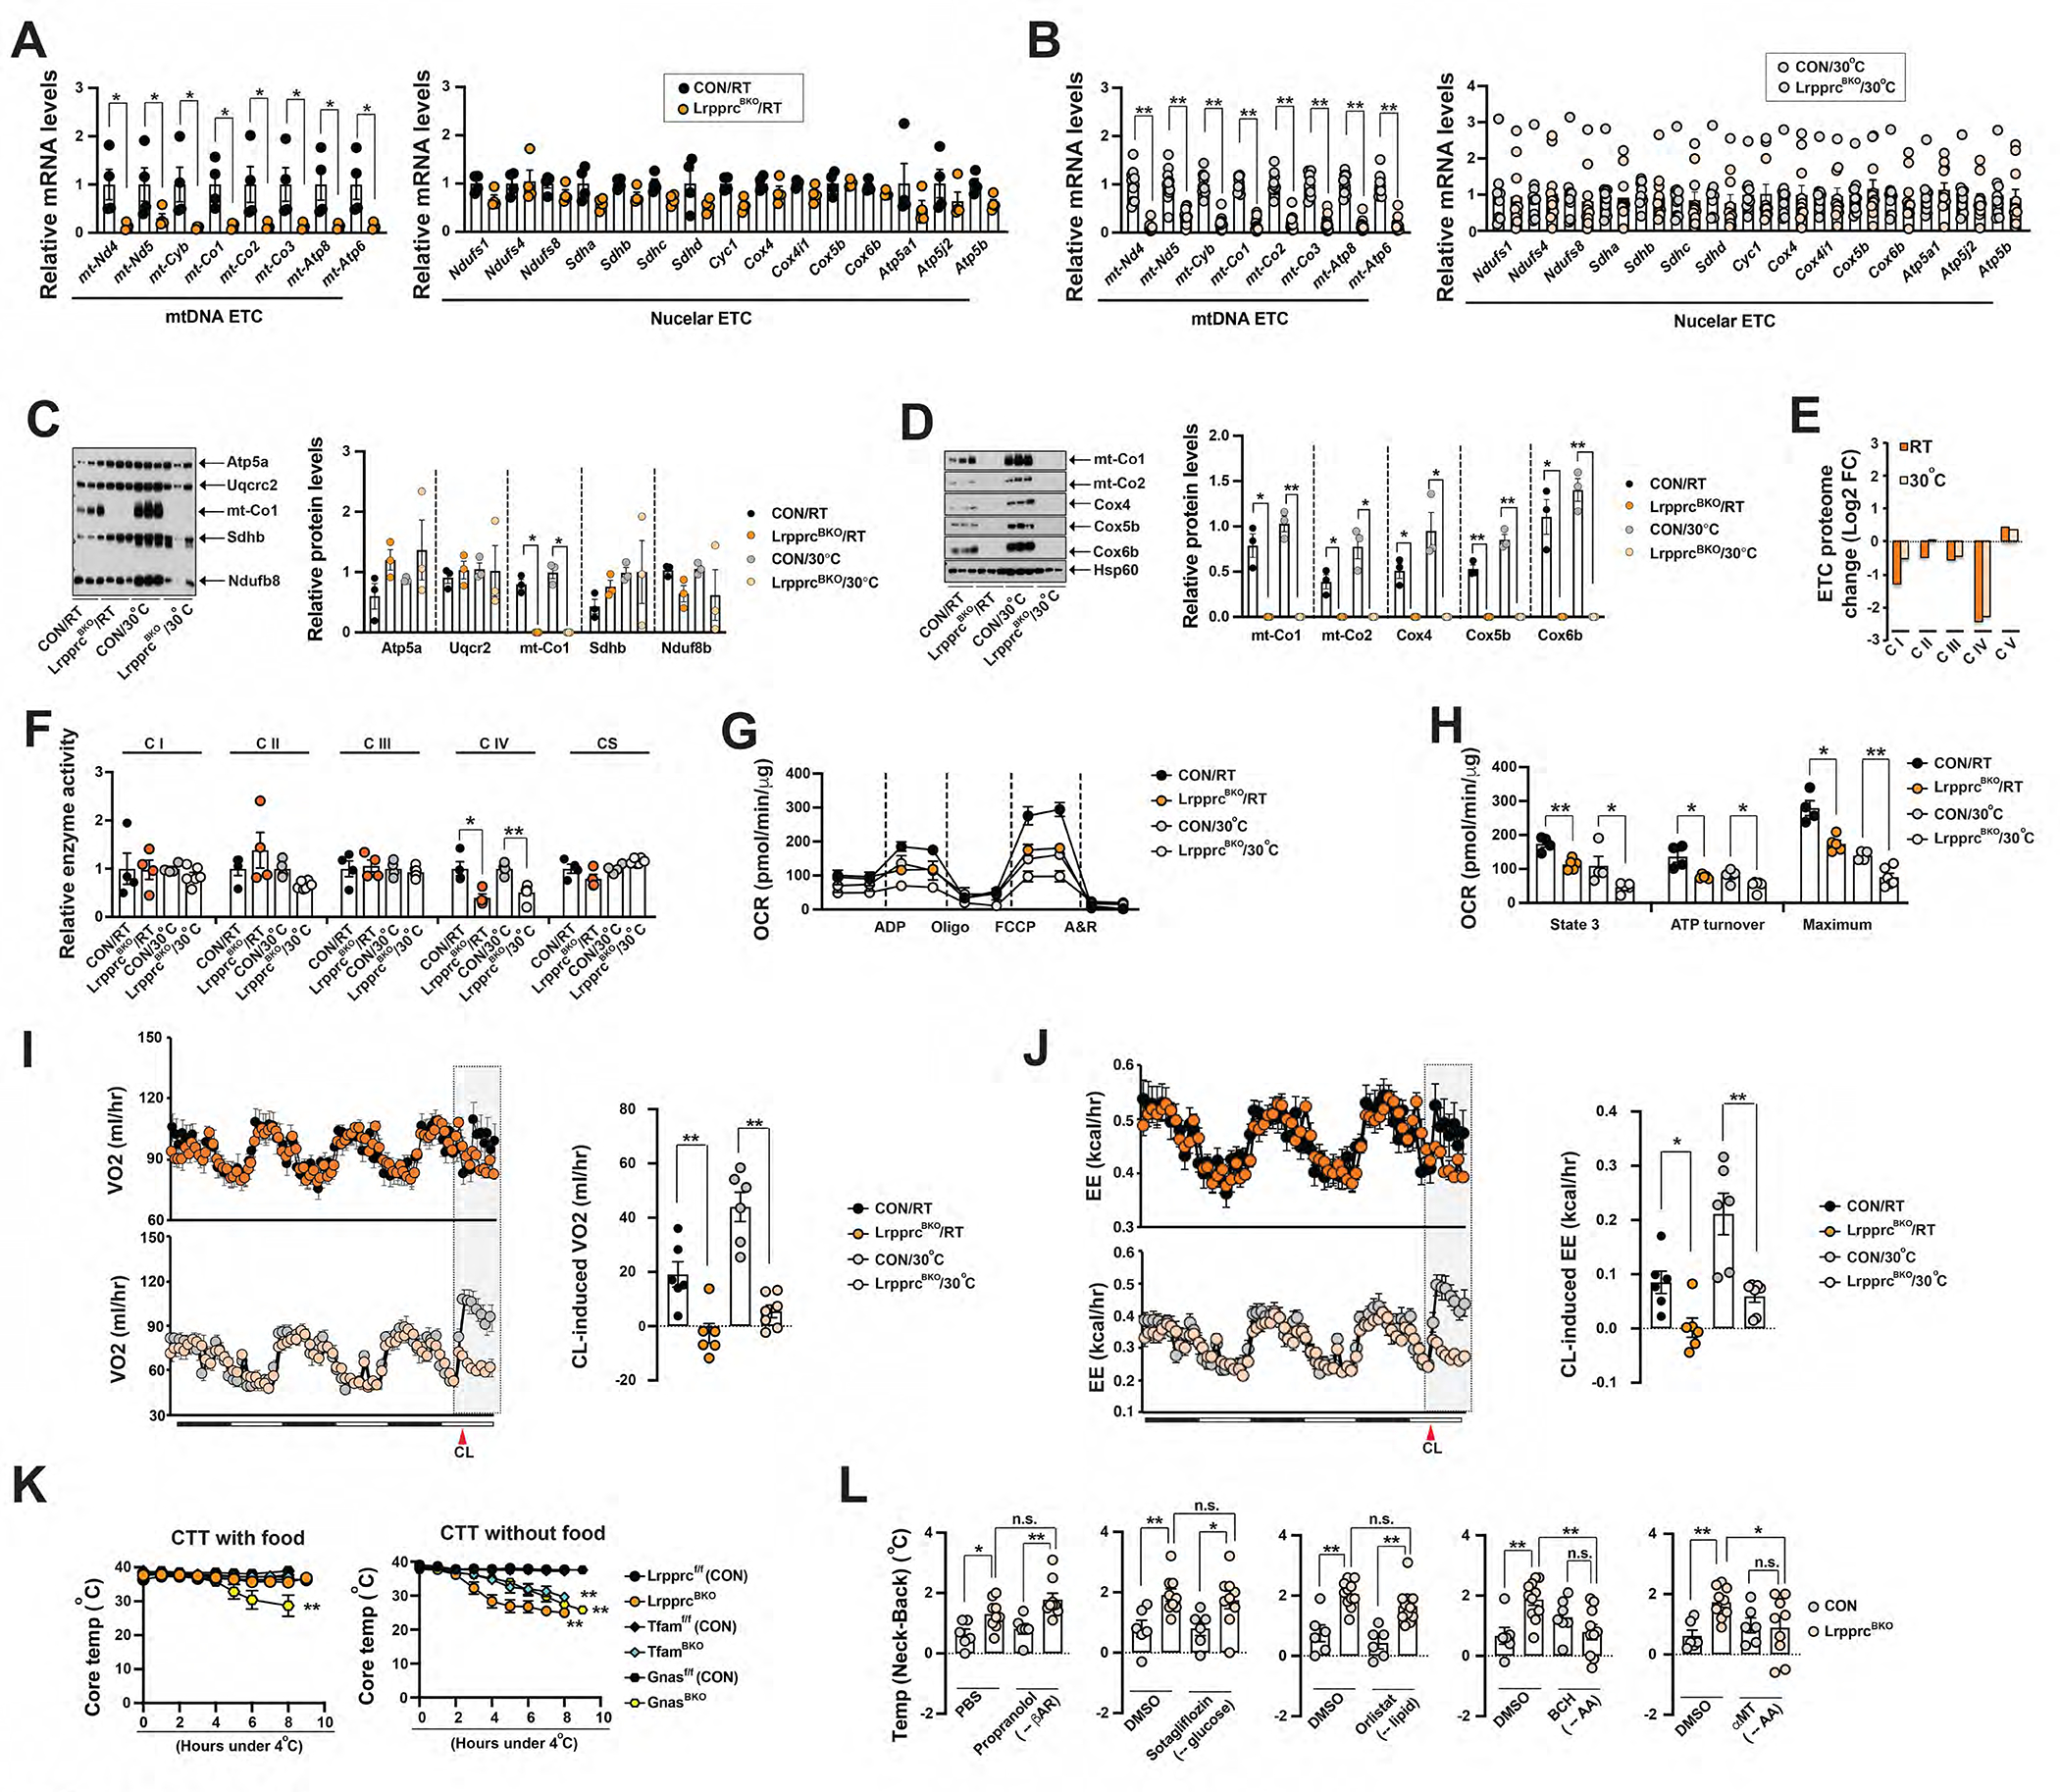
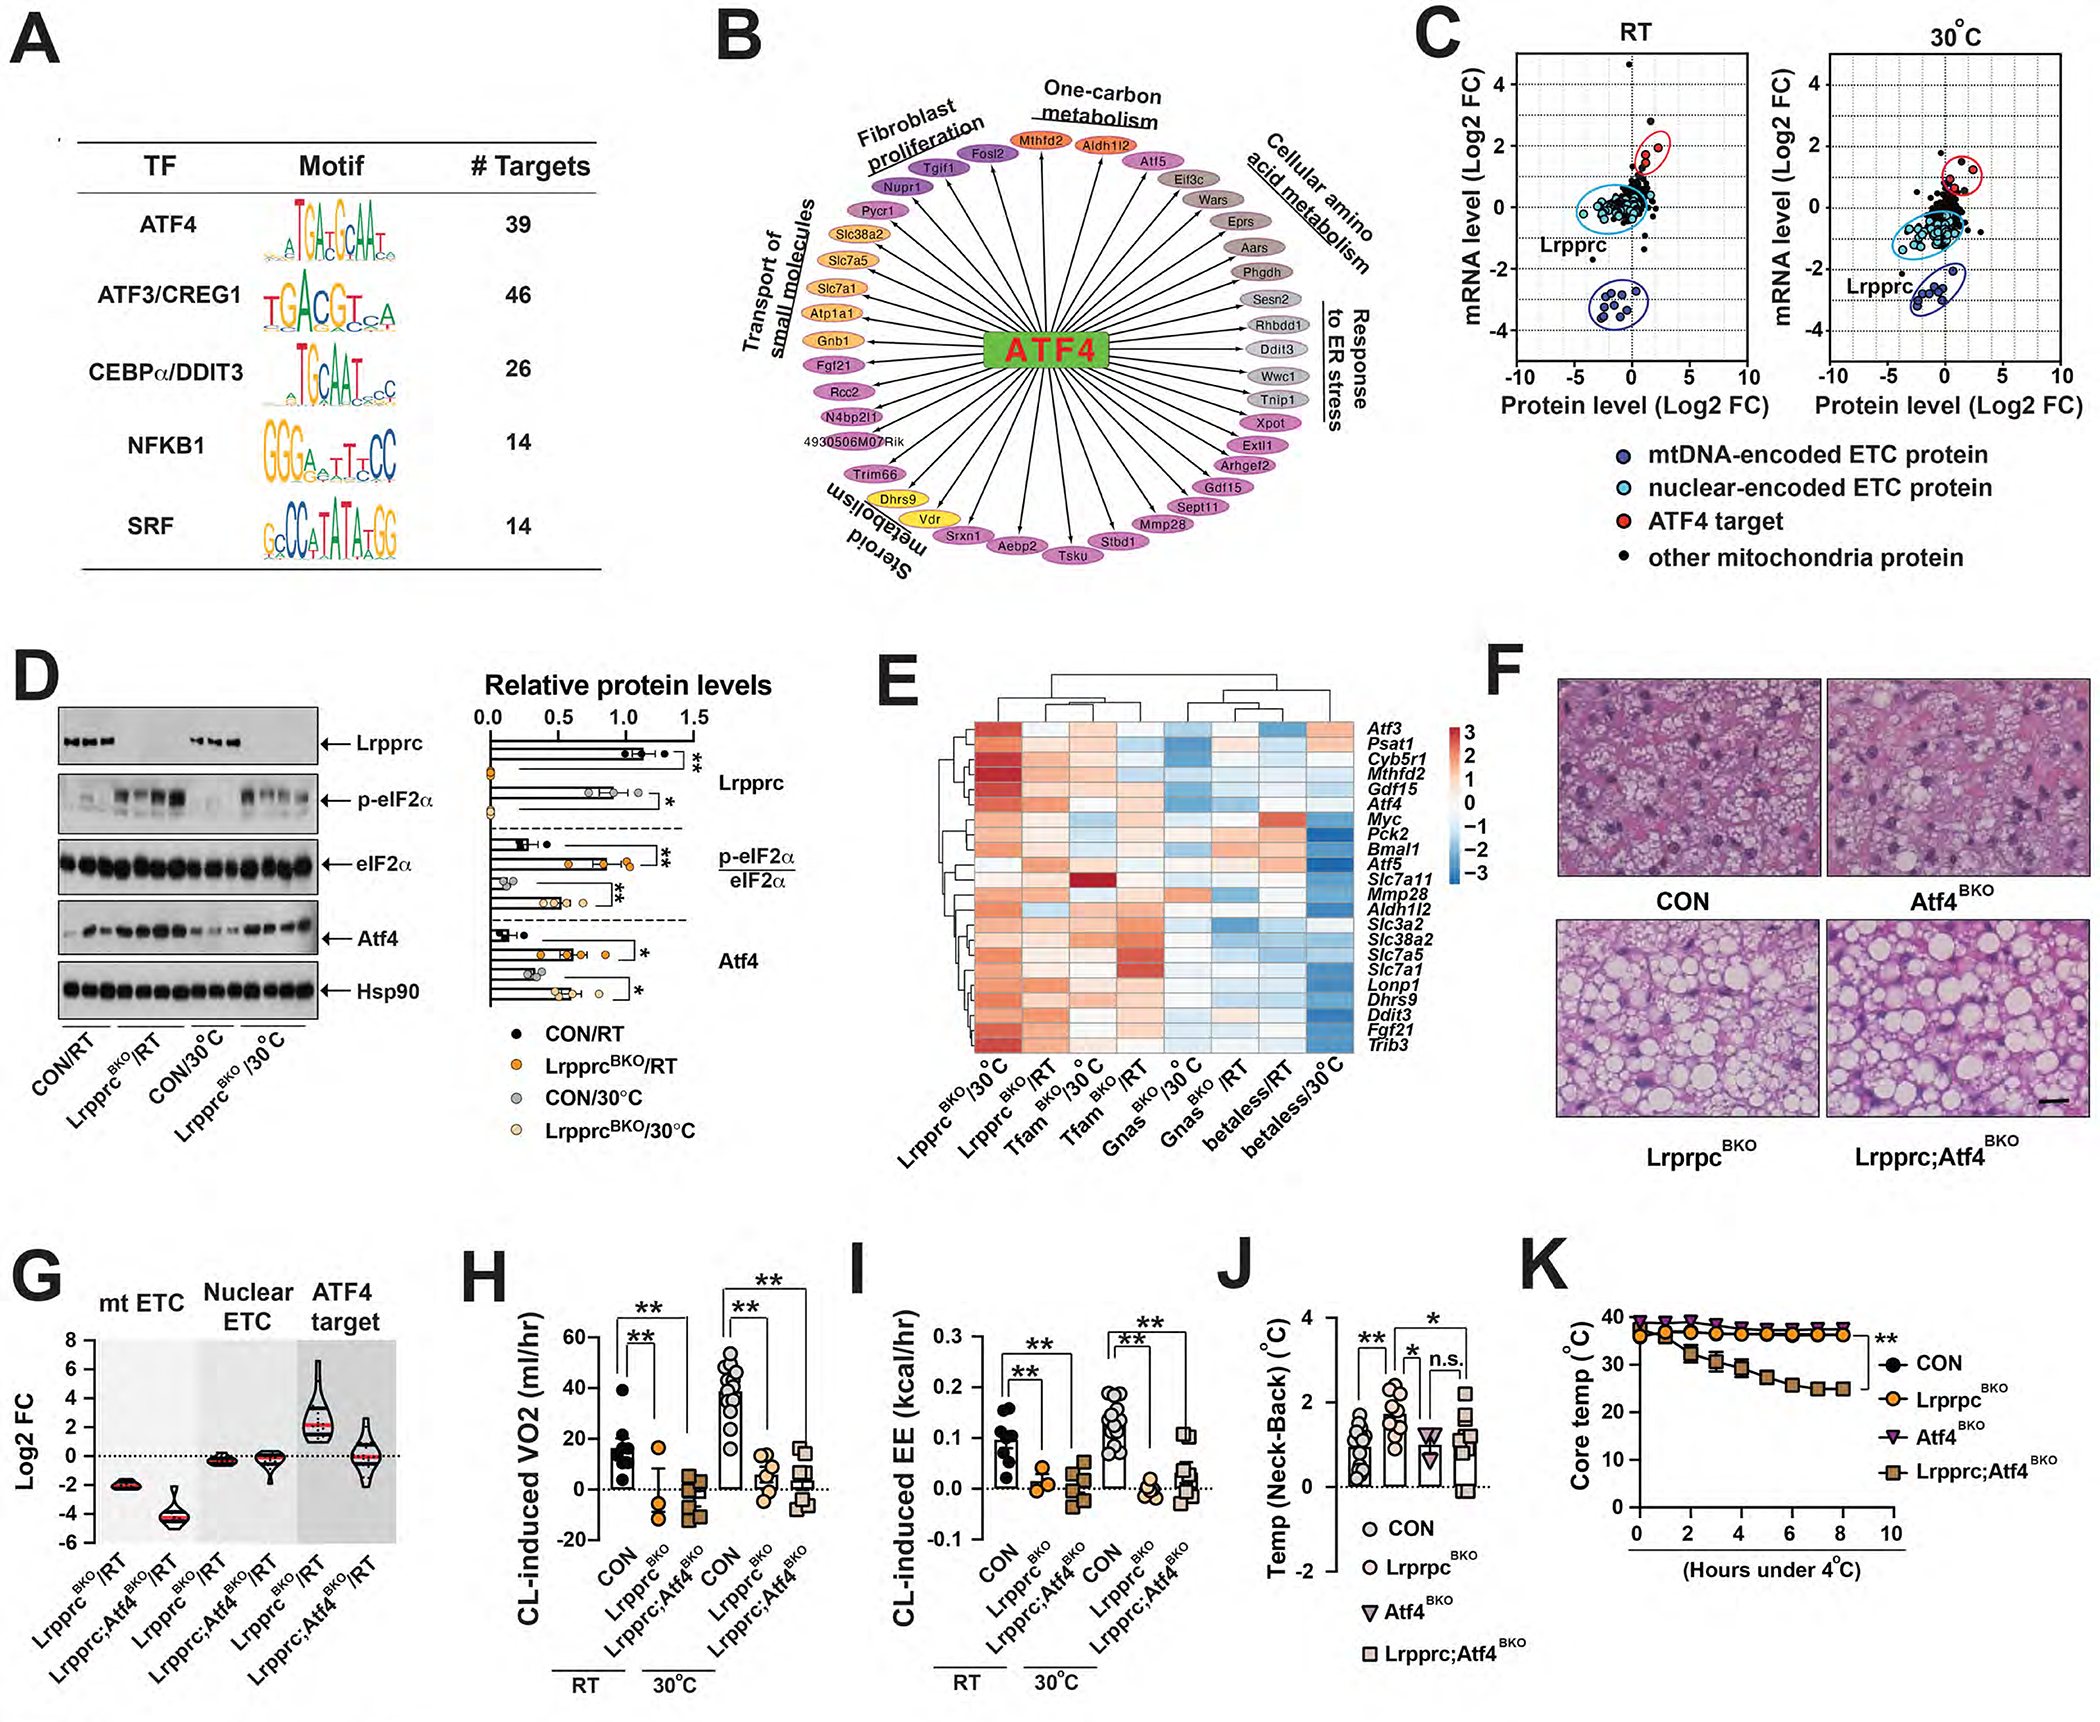
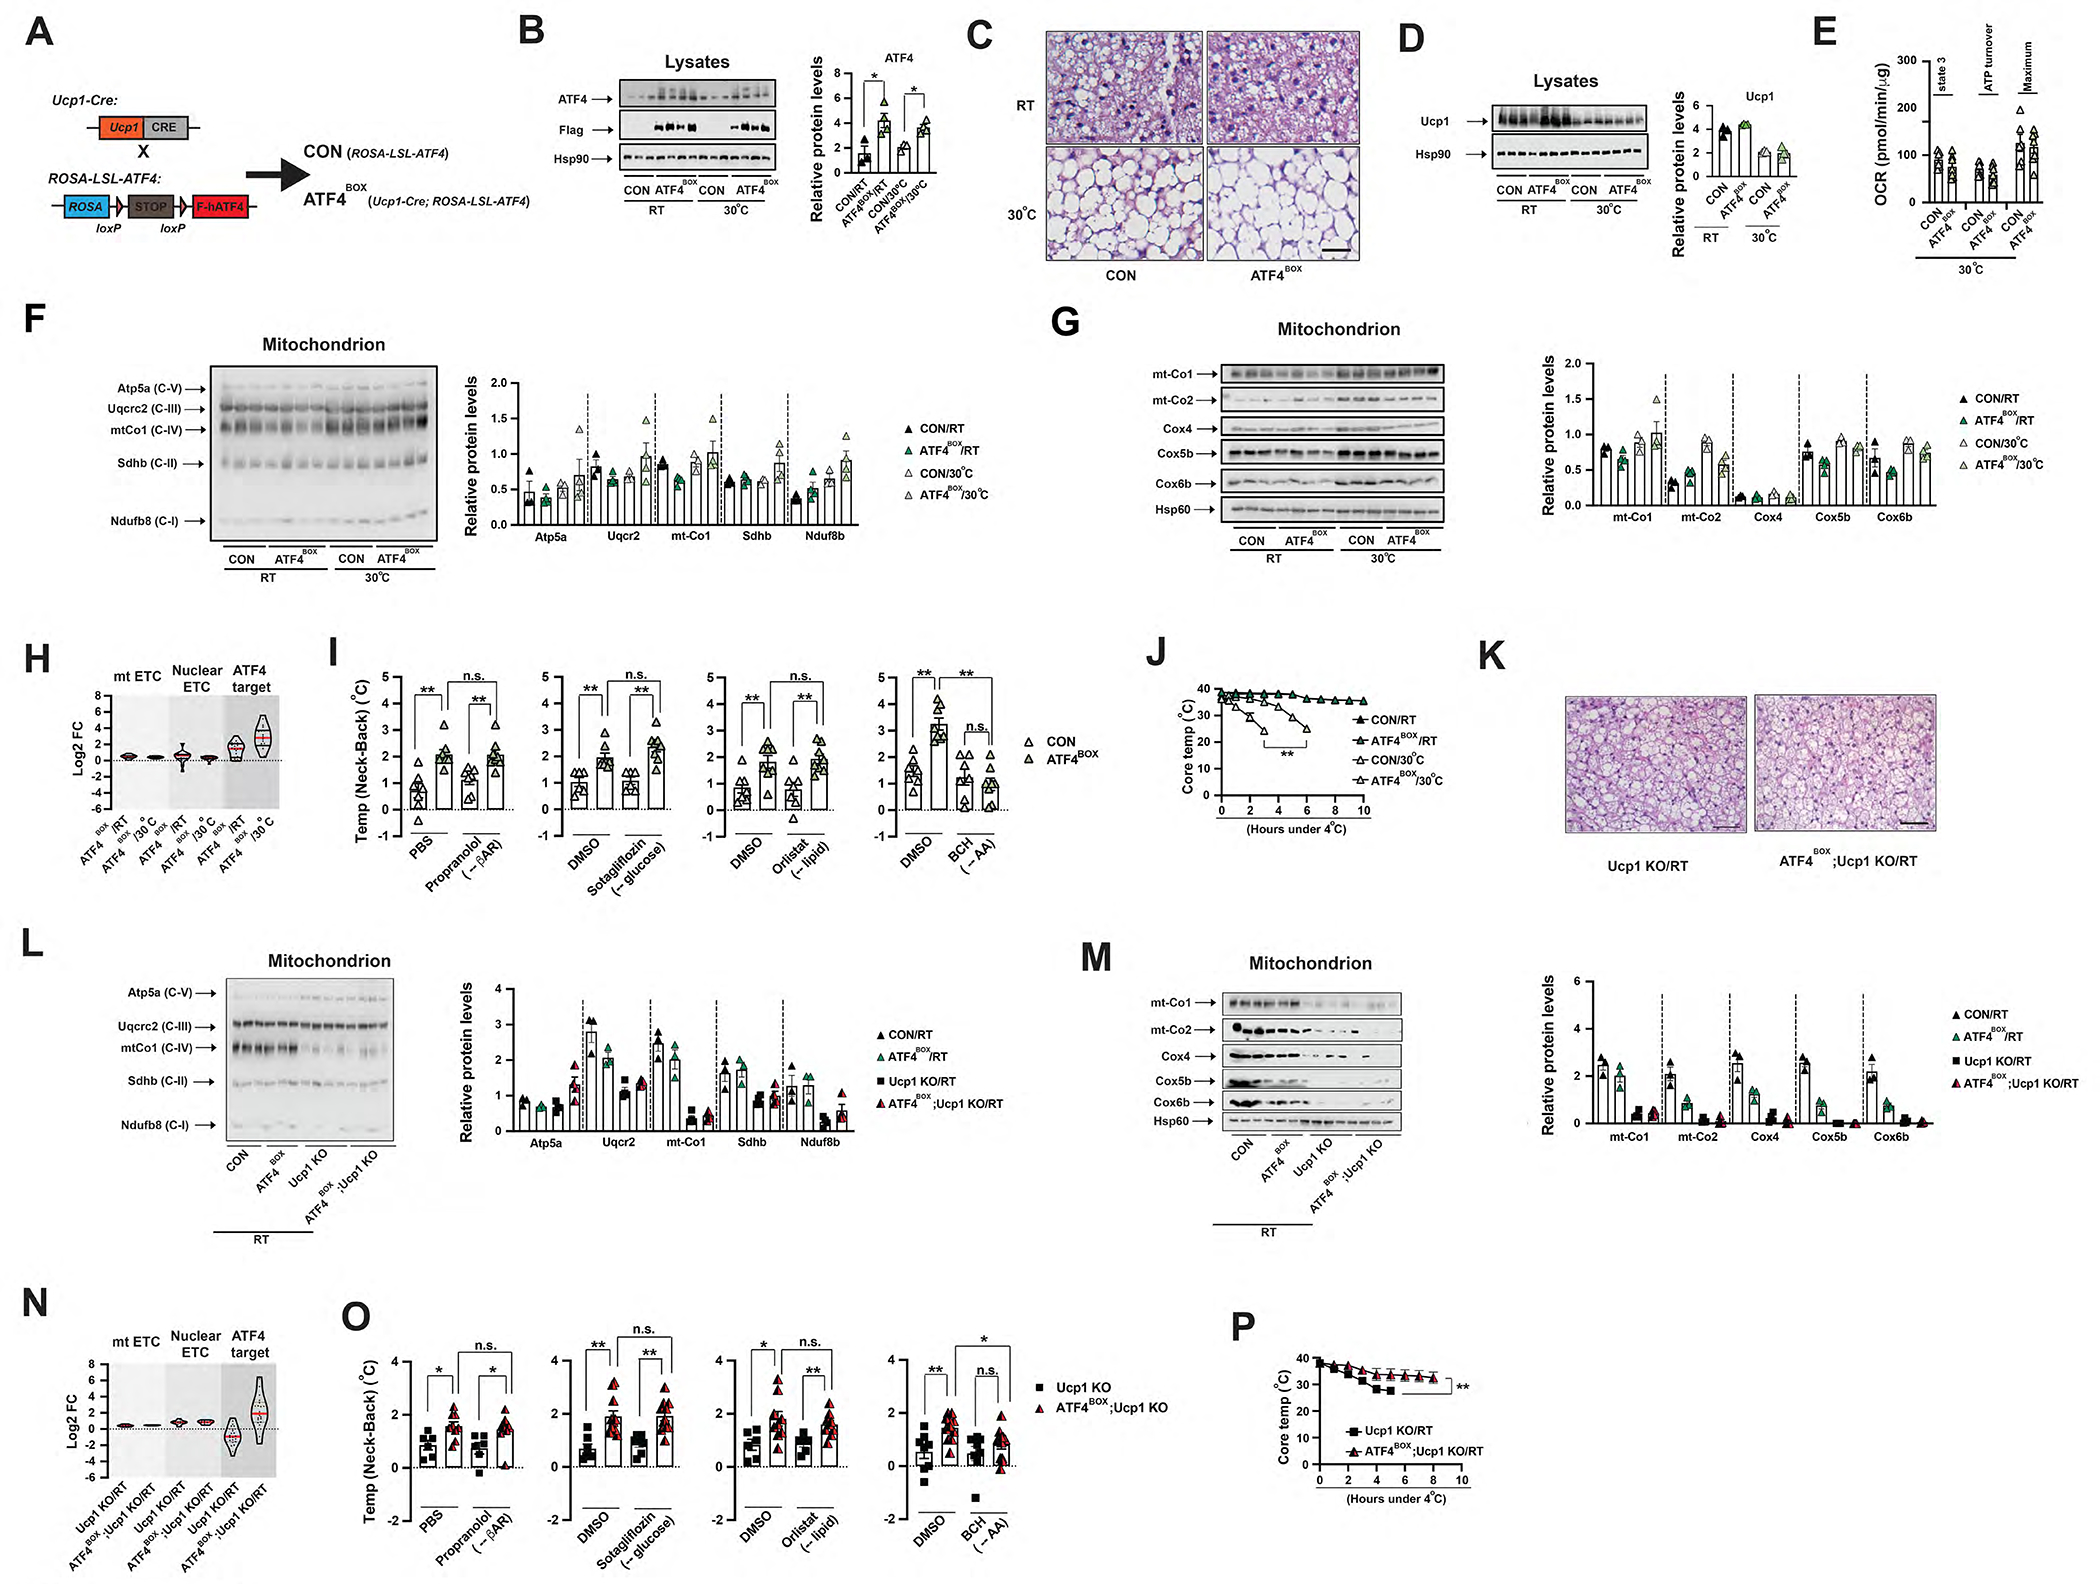
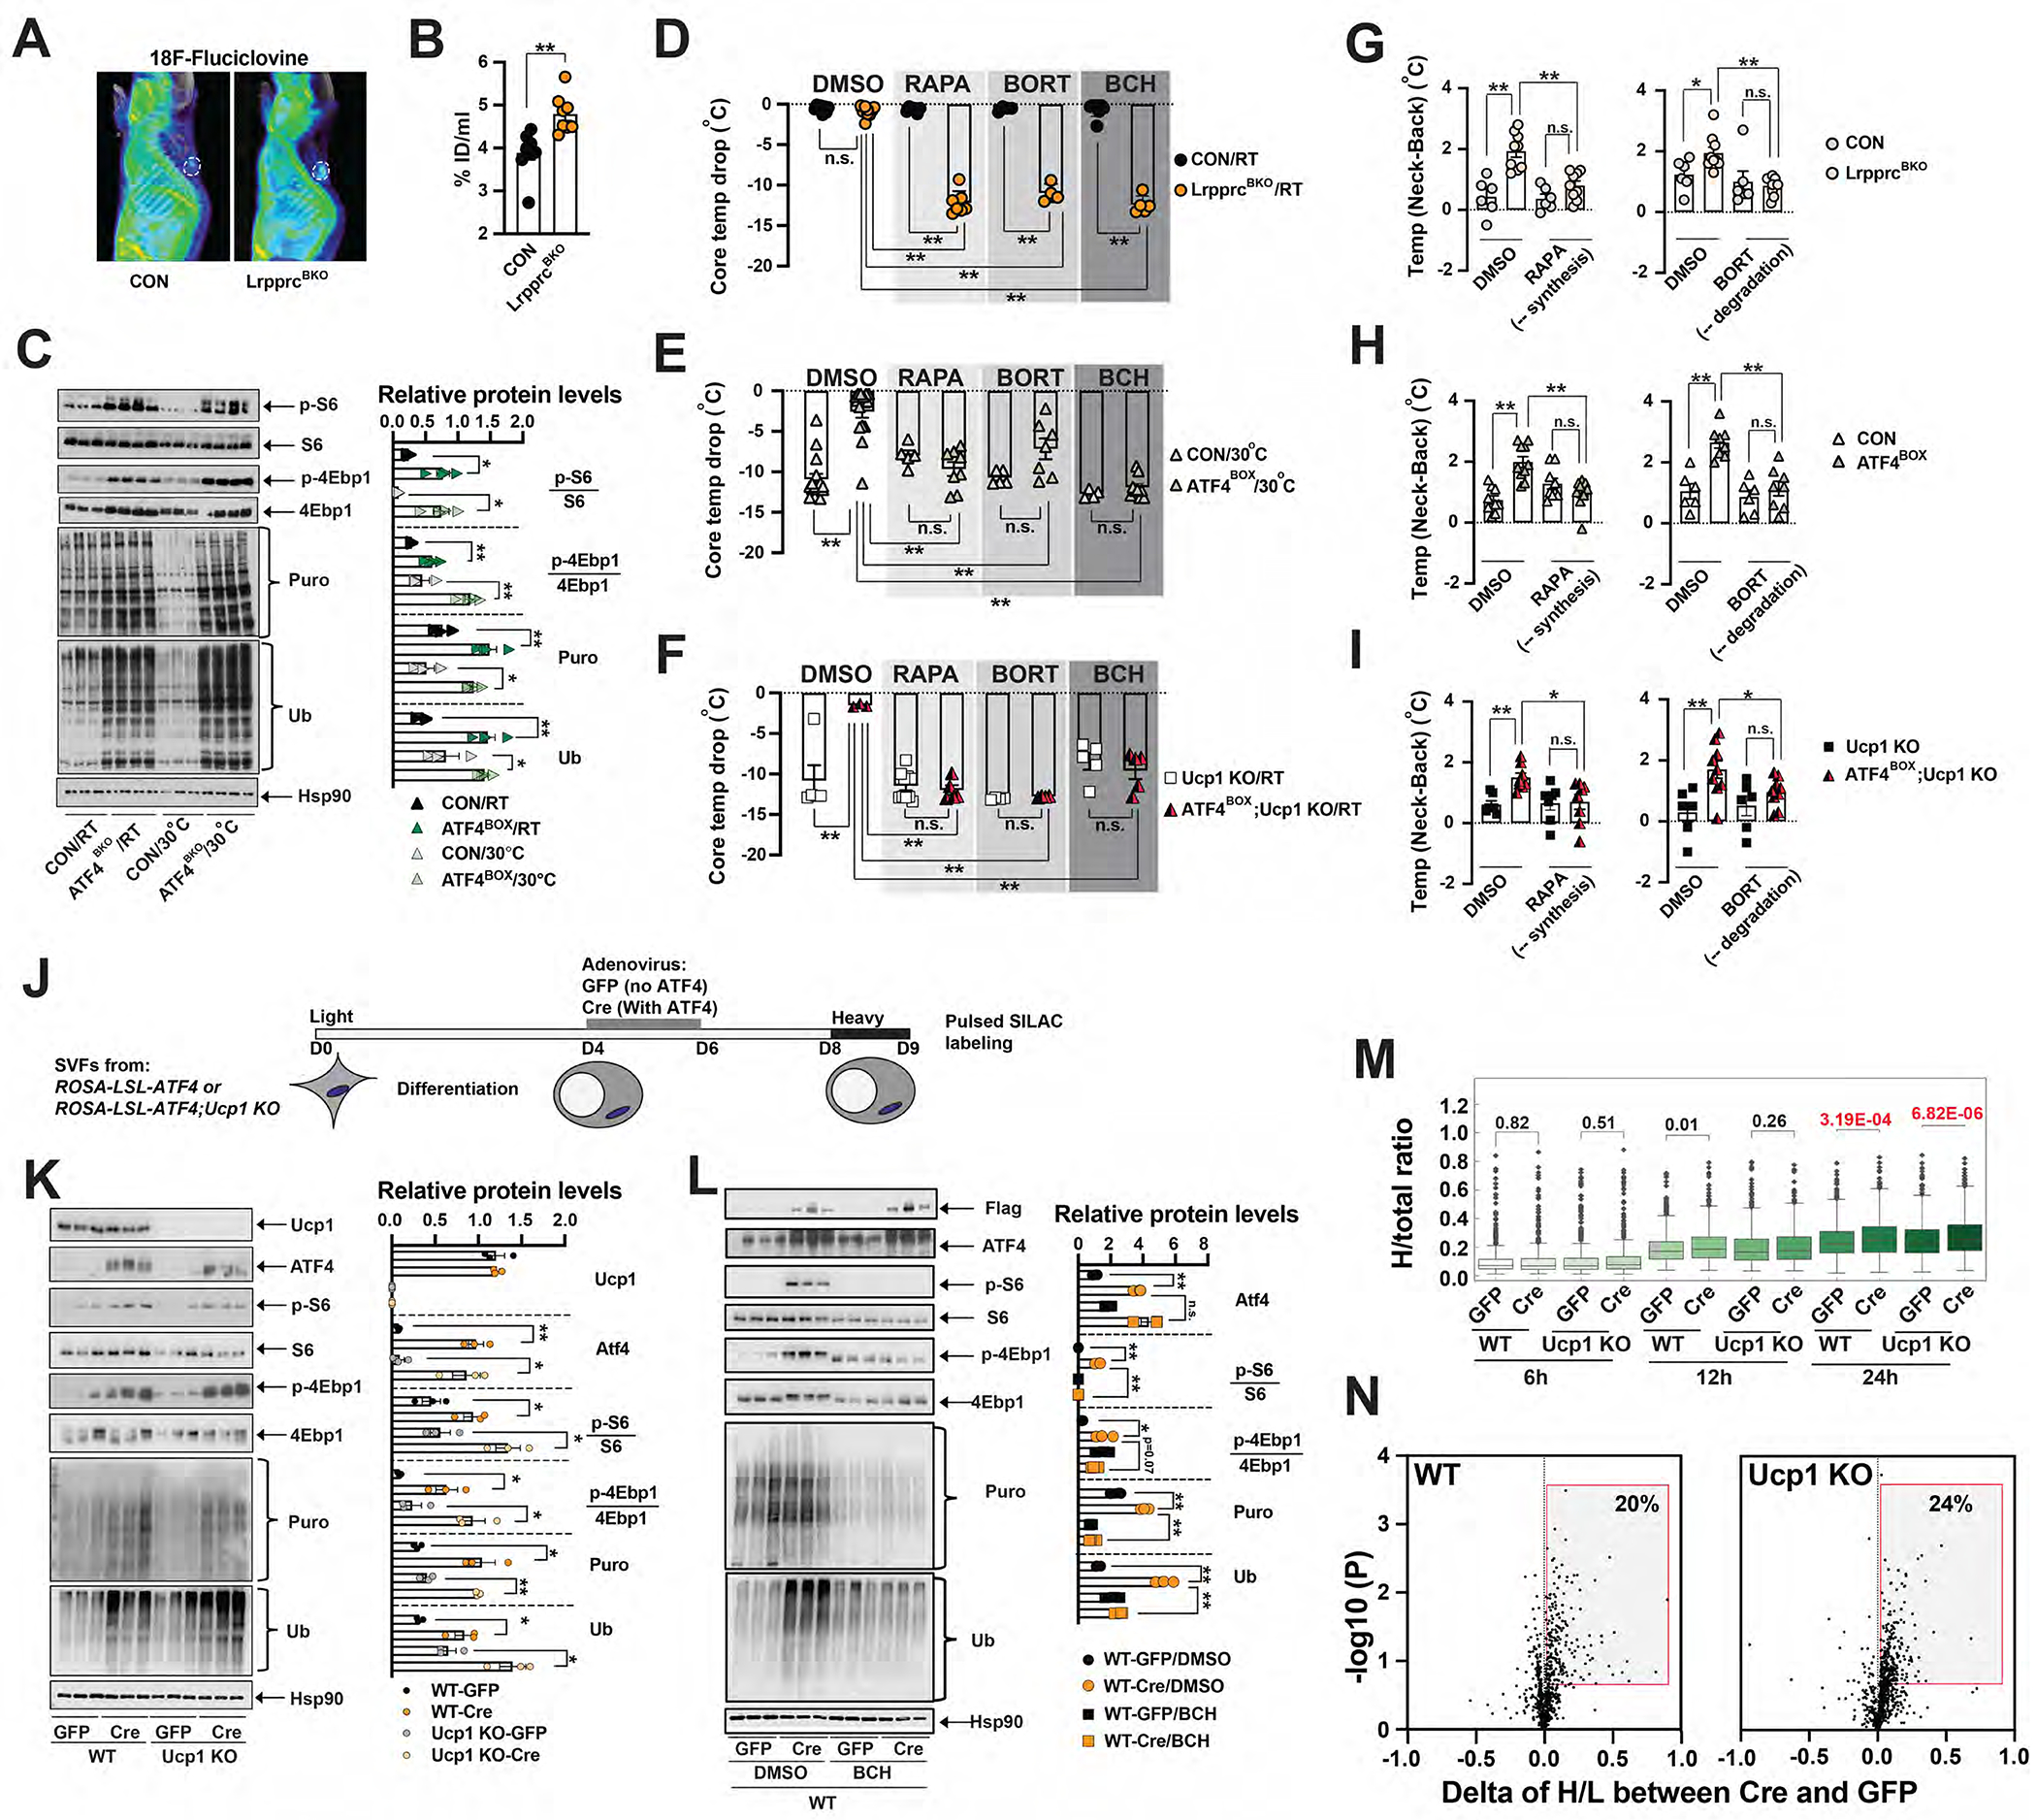
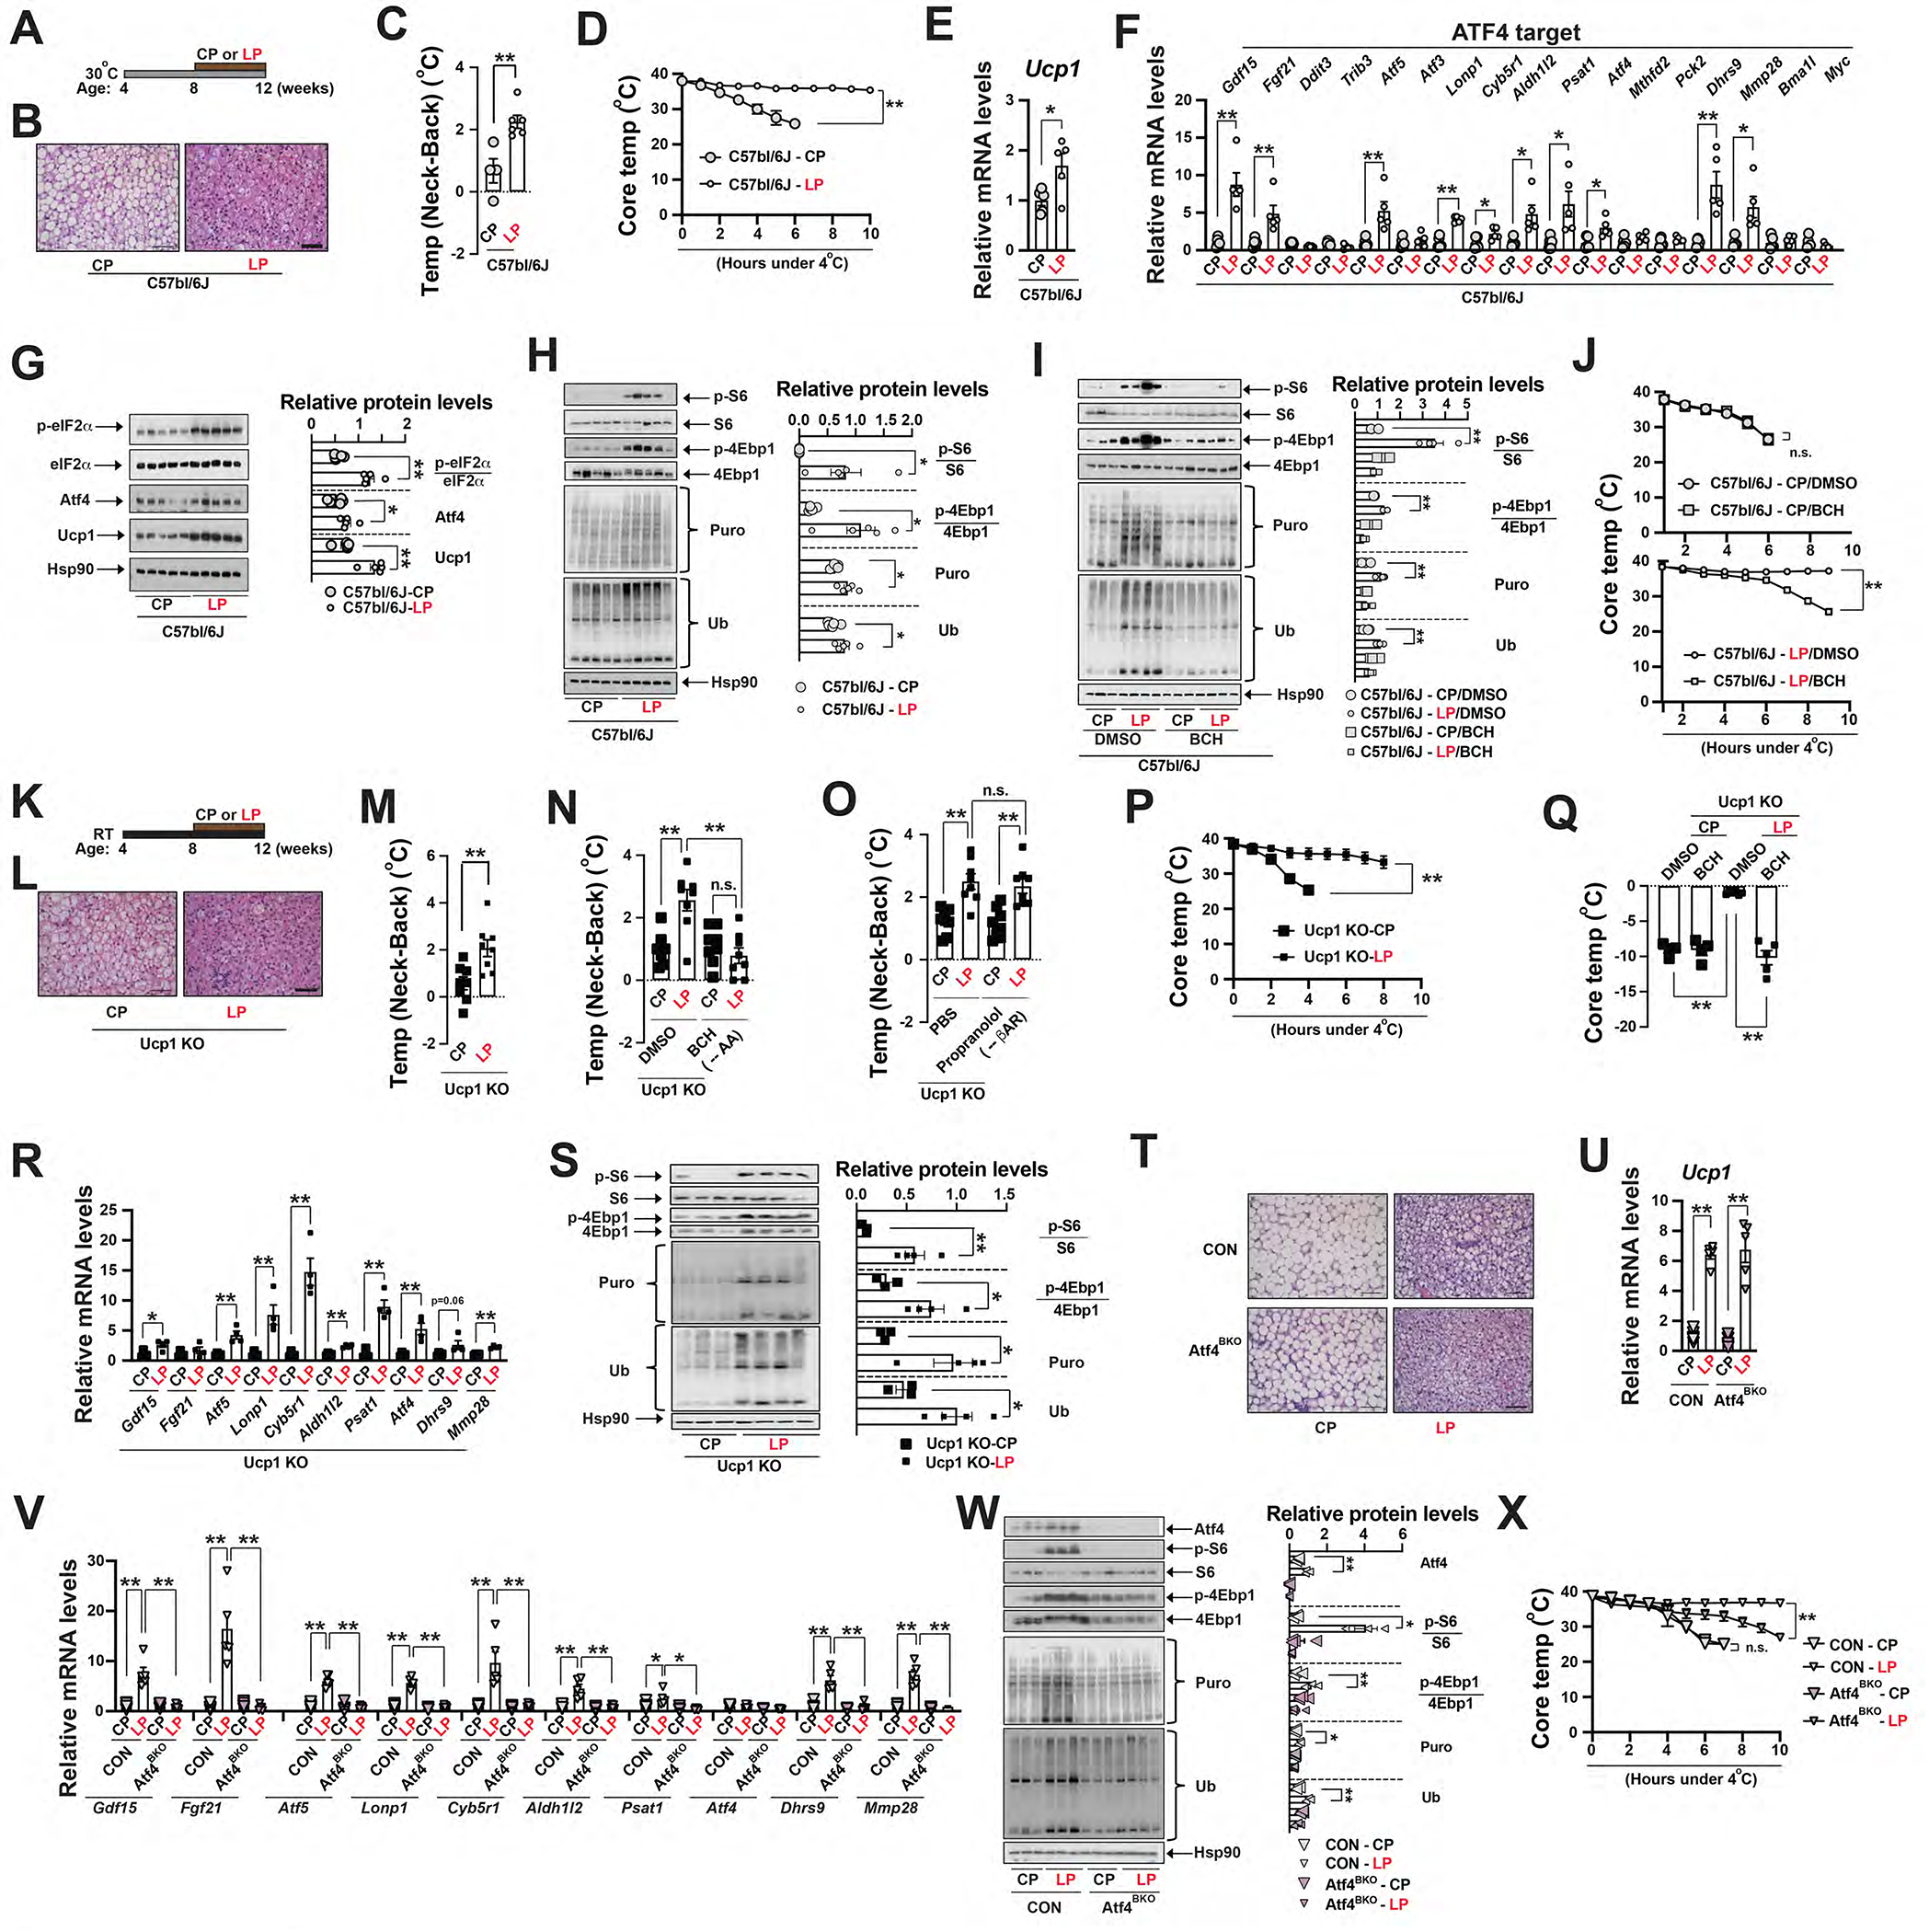
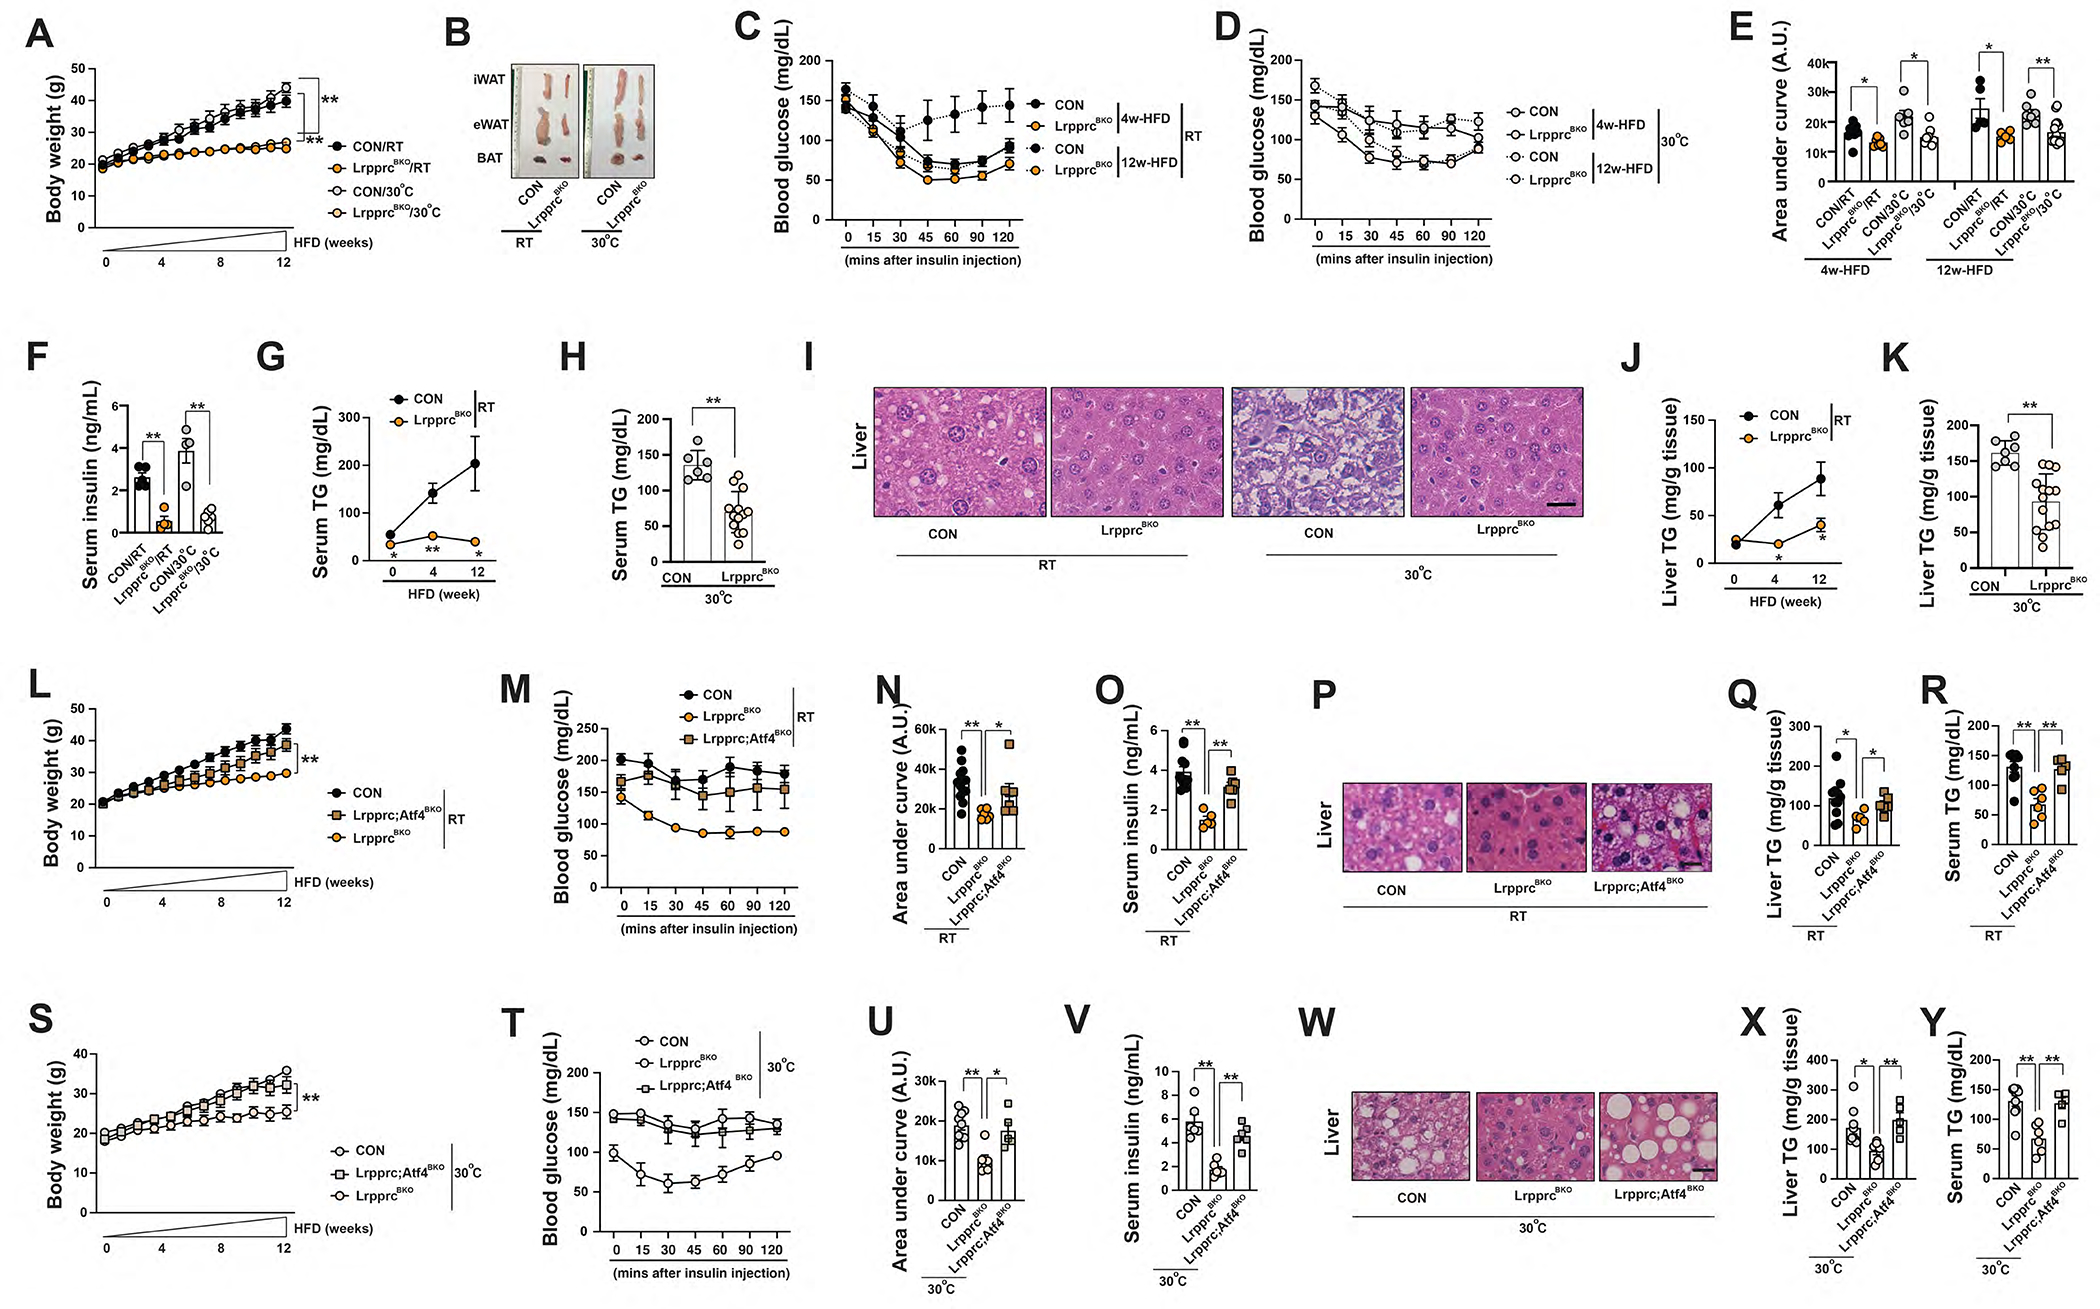
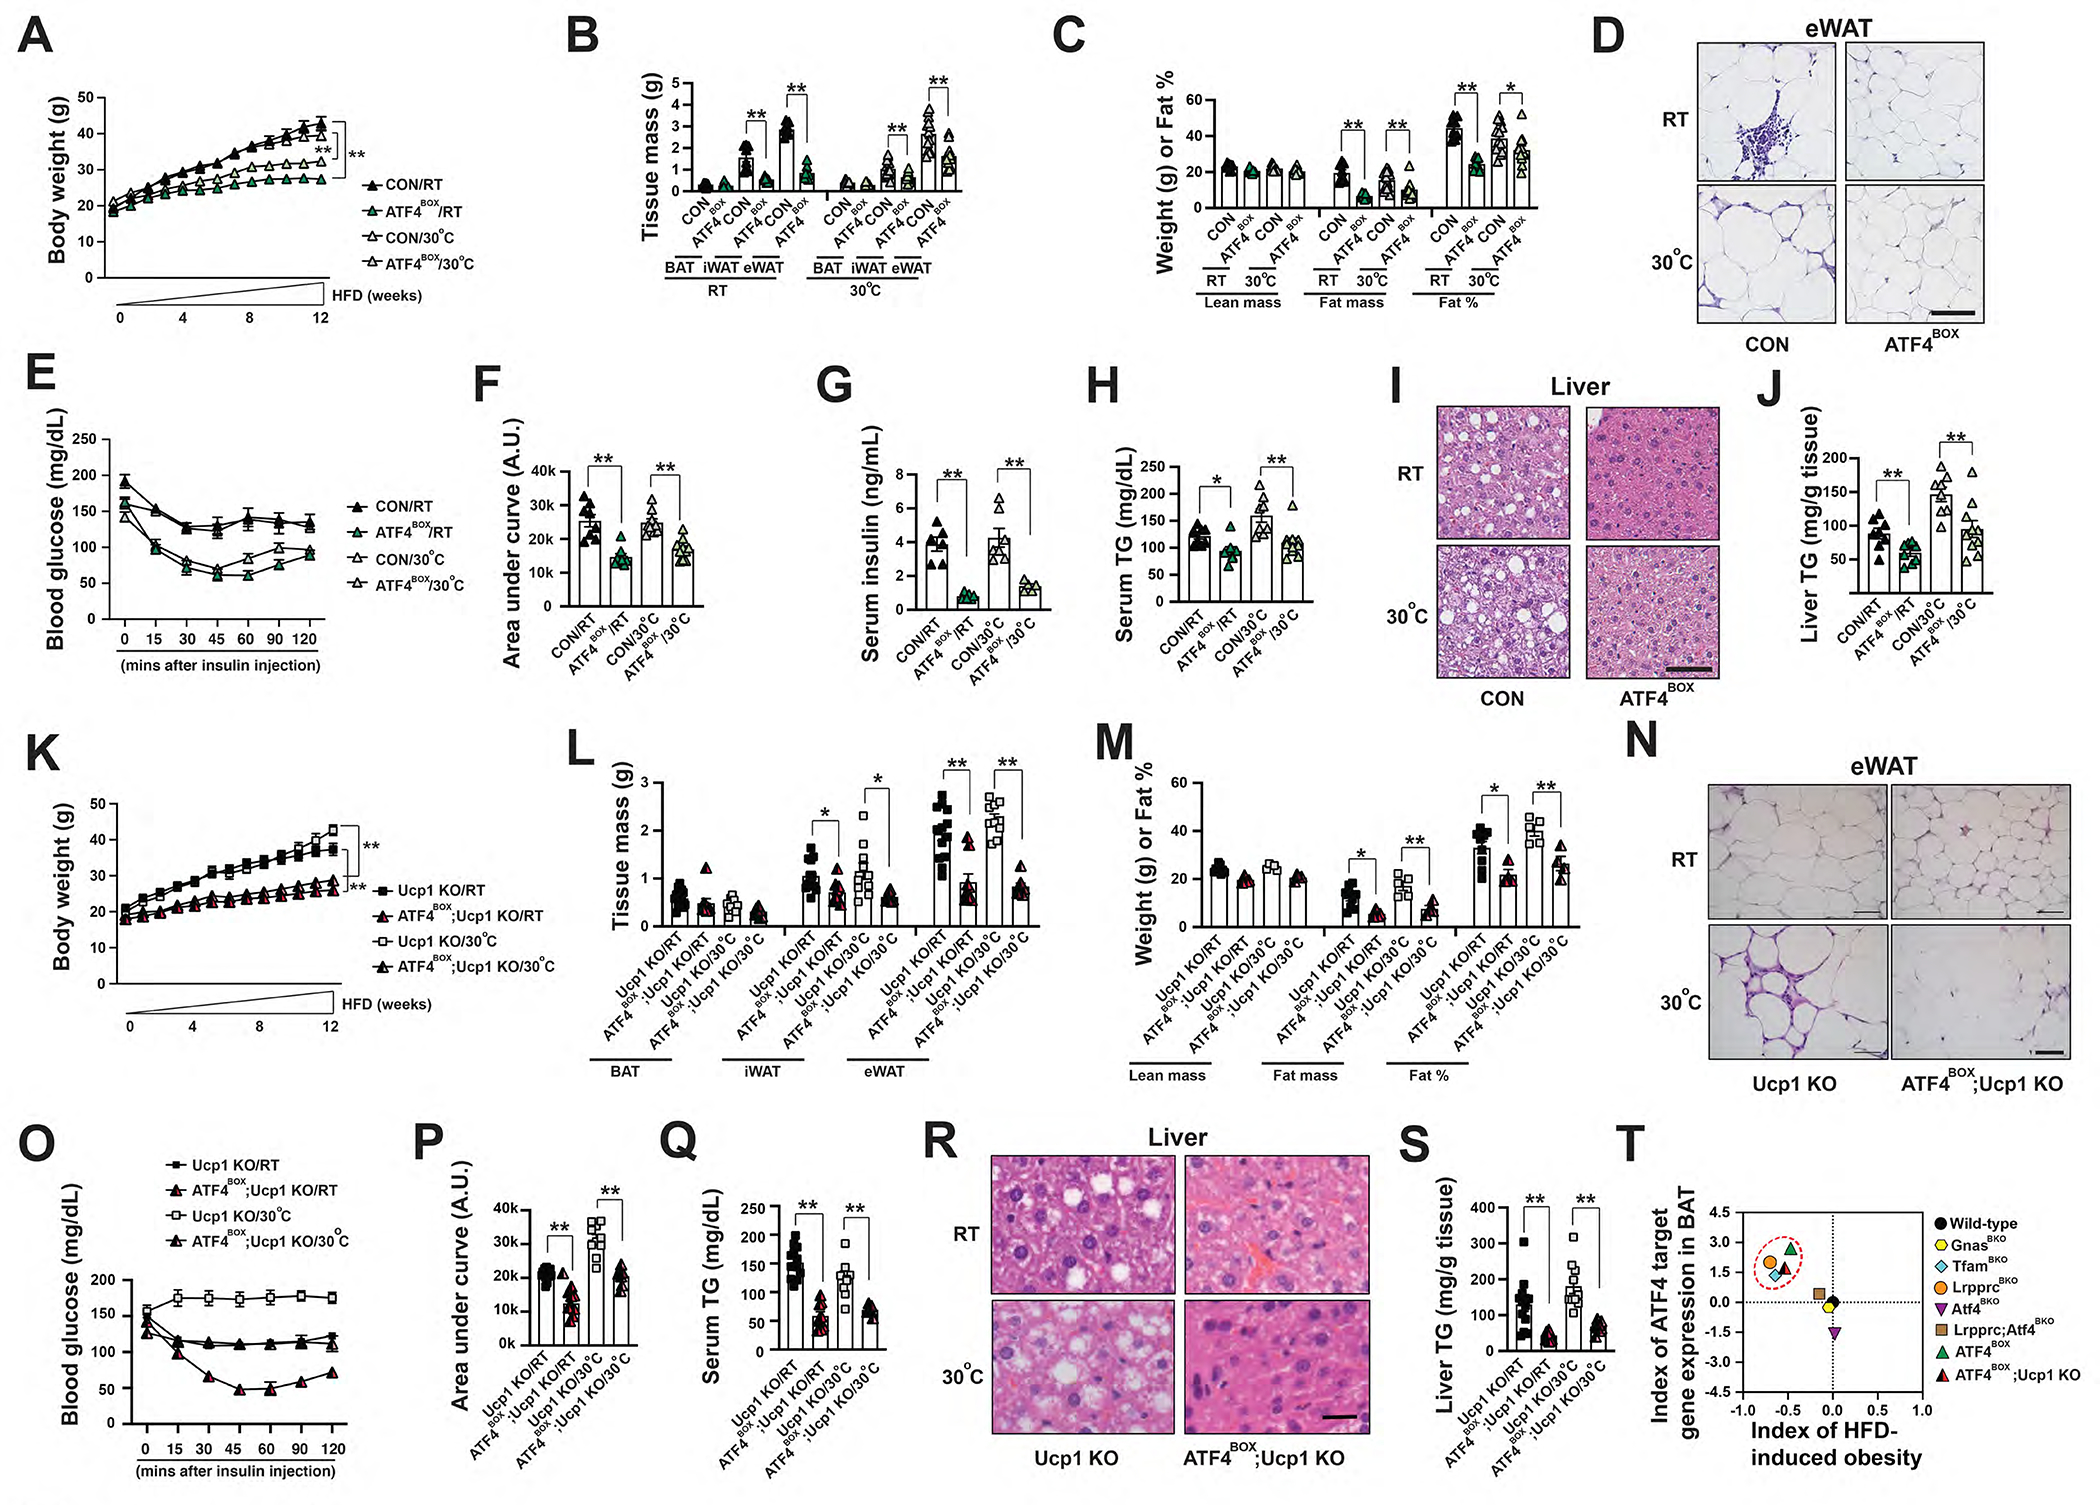
Cold-induced thermogenesis in endotherms demands adaptive thermogenesis fueled by mitochondrial respiration and Ucp1-mediated uncoupling in multilocular brown adipocytes (BAs). However, dietary regulation of thermogenesis in BAs isn't fully understood. Here, we describe that the deficiency of Leucine-rich pentatricopeptide repeat containing-protein (Lrpprc) in BAs reduces mtDNA-encoded ETC gene expression, causes ETC proteome imbalance, and abolishes the mitochondria-fueled thermogenesis. BA-specific Lrpprc knockout mice are cold resistant in a 4°C cold-tolerance test in the presence of food, which is accompanied by the activation of transcription factor 4 (ATF4) and proteome turnover in BAs. ATF4 activation genetically by BA-specific ATF4 overexpression or physiologically by a low-protein diet feeding can improve cold tolerance in wild-type and Ucp1 knockout mice. Furthermore, ATF4 activation in BAs improves systemic metabolism in obesogenic environment regardless of Ucp1's action. Therefore, our study reveals a diet-dependent but Ucp1-independent thermogenic mechanism in BAs that is relevant to systemic thermoregulation and energy homeostasis.

Keywords: ATF4; brown adipocyte; thermogenesis.


Conflict of interest statement

Declaration of interests The authors declare no competing interests.

Figures

Figure 1.
Figure 1.. Lrpprc deficiency in the brown adipocytes triggers a dietary protein (or amino acid)-dependent thermogenic process.
(A) Q-PCR analysis of mRNA levels of mtDNA-encoded and nuclear-encoded ETC gene in the BAT from ~8-week-old male CON and LrpprcBKO mice at RT. Sample size: CON/RT (n=4) and LrpprcBKO/RT (n=4). (B) Q-PCR analysis of mRNA levels of mtDNA-encoded and nuclear-encoded ETC gene in the BAT from ~10-week-old male CON and LrpprcBKO mice at 30°C. Sample size: CON/30°C (n=10) and LrpprcBKO/30°C (n=11). (C) Left: Mitochondrial cocktail immunoblot showing amounts of representative protein abundance of each ETC complex, Ndufb8 (complex I), Sdhb (complex II), Uqcrc2 (complex III), mt-Co1 (complex IV) and Atp5a (complex V), in isolated BAT mitochondria from ~8–12-week-old male CON and LrpprcBKO mice housed at RT and 30°C. Right: Relative protein abundance (to Hsp60) shown. Significance between genotypes indicated. (D) Left: Immunoblots of complex IV subunits (mt-Co1, mt-Co2, Cox4, Cox5b, Cox6b) and Hsp60 in isolated mitochondria from above mice. Right: Relative protein abundance (to Hsp60) shown. Significance between genotypes indicated. (E) Log2 fold change values of each ETC proteome from BAT of LrpprcBKO mice. (F) Relative in vitro enzyme activities of Complex I to IV and citrate synthase (CS) in BAT of ~8–12-week-old male CON and LrpprcBKO mice housed at RT and 30°C. Sample size: CON/RT (n=4), LrpprcBKO/RT (n=4), CON/30°C (n=4) and LrpprcBKO/30°C (n=6). (G) Seahorse experiments measuring oxygen consumption rates (OCRs) of isolated mitochondria from BAT of ~8–12-week-old male and female CON and LrpprcBKO mice housed at RT and 30°C, upon addition of ADP, Oligo, FCCP and A&R. (H) State 3, ATP turnover and maximum OCRs in Seahorse measurements. Values are normalized as per mitochondrial protein. Sample size: CON/RT (n=4), LrpprcBKO/RT (n=5), CON/30°C (n=4) and LrpprcBKO/30°C (n=6). (I) Left: Recordings of oxygen consumption (VO2) in ~8–12-week-old male CON and LrpprcBKO mice for three days at RT and 30°C. Red arrowhead: time of CL injection. Right: Average hourly CL-induced VO2 in the aforementioned mice. (J) Left: Recordings of energy expenditure (EE) in ~8–12-week-old male CON and LrpprcBKO mice for three days at RT and 30°C. Red arrowhead: time of CL injection. Right: Average hourly CL-induced EE in the aforementioned mice. Sample size: CON/RT (n=6), LrpprcBKO/RT (n=6), CON/30°C (n=6) and LrpprcBKO/30°C (n=7). (K) Left: 4°C Cold tolerance test (CTT) of ~8–12-week-old male and female LrpprcBKO, TfamBKO, GnasBKO and their relative control mice housed at RT with food. Note: data from GnasBKO and relative control was from our previous publication (Paulo et al., 2018b). Sample size: Lrpprcf/f (CON) (n=6), LrpprcBKO (n=9), Tfamf/f (CON) (n=4), TfamBKO (n=4), Gnasf/f (CON) (n=12), and GnasBKO (n=9). Right: CTT of ~8–12-week-old male and female LrpprcBKO, TfamBKO, GnasBKO and their relative control mice housed at RT without food. Sample size: Lrpprcf/f (CON) (n=7), LrpprcBKO (n=6), Tfamf/f (CON) (n=7), TfamBKO (n=9), Gnasf/f (CON) (n=4) and GnasBKO (n=5). (L) The Temp (Neck-Back), the difference of the surface temperatures between neck (overlaying BAT) and dorsal back (not overlay BAT) by infrared (IR) thermal imaging, of ~12-week-old male and female CON and LrpprcBKO mice 2 hours after injections of 10 mg kg−1 Propranolol or 10 mg kg−1 Sotagliflozin or 25 mg kg−1 Orlistat or 50mg kg−1 2-amino-2-norbornane-carboxylic acid (BCH) 100mg kg−1 α-methyl-dl-tryptophan (αMT) or their vehicles at thermoneutrality. Sample size: CON (n=6) and LrpprcBKO (n=11). Data were presented as average ± SEM. Unpaired t-test. n.s.: not significant, *: p<0.05 and **: p<0.01.
Figure 2.
Figure 2.. ATF4 activation in brown adipocytes is necessary for thermogenic phenotypes in the LrpprcBKO mice.
(A) List of enriched Transcript factors (TF) in commonly up-regulated DEGs in the BAT of CON and LrpprcBKO mice at RT and 30°C. Name, motif sequence and number of targets of each TF shown. (B) ATF4 signaling network. GO terms of ATF4 targets shown. (C) Scatter plots showing the correlation of log2 fold changes (Log2 FC)) of mRNA and protein levels of mitochondria-localized proteins from BAT of LrpprcBKO mice housed at RT and 30°C. mtDNA-encoded ETC, nuclear-encoded ETC, and ATF4 targets circled. (D) Left: Immunoblots showing amounts of Lrpprc, p-eIF2α, total eIF2α, Atf4 and Hsp90 in the BAT of ~8–12-week-old male CON and LrpprcBKO mice at normal chow at both RT and 30°C. Right: Relative protein abundance (to Hsp90) or phosphorylation (to total protein) shown. Significance between genotypes indicated. (E) Clustering analysis of log2 fold changes of known ATF4 target genes in the BAT of mouse models with defective mitochondrial function in BAs (LrpprcBKO, TfamBKO, GnasBKO and betaless mice, ~8–12-week-old male) at normal chow at both RT and 30°C. Sample size: n=5 for each genotype/condition. (F) Representative H&E staining of BAT from ~8–10-week-old male CON, LrpprcBKO, Atf4BKO, and Lrpprc;Atf4BKO mice housed at RT. Scale bar: 50 μm. (G) Violin plot of log2 fold change (FC) of 8 mtDNA-encoded ETC (mt ETC, listed in Fig.1A), 15 nuclear-encoded ETC (nuclear ETC, listed in Fig.1A) and 22 ATF4 targets (listed in Fig.2E) in the BAT of ~8–12-week old male LrpprcBKO and Lrpprc;Atf4BKO mice to their relative controls (Lrpprcf/f and Lrpprc;Atf4f/f) housed at RT. Red and black bars: median and quartiles. Hourly CL-induced VO2 (H) and EE (I) in ~10-week old male CON, LrpprcBKO and Lrpprc;Atf4BKO mice at RT and 30°C. Sample size: CON/RT(n=8), LrpprcBKO/RT (n=3), Lrpprc;Atf4BKO/RT(n=6), CON/30°C(n=13), LrpprcBKO/30°C (n=6) and Lrpprc;Atf4BKO/30°C (n=7). (J) The Temp (Neck-Back) of ~12-week-old male and female CON, LrpprcBKO, Atf4BKO, and Lrpprc;Atf4BKO mice at thermoneutrality. Sample size: CON (n=15), LrpprcBKO (n=9), Atf4BKO (n=3) and Lrpprc;Atf4BKO (n=10). (K) CTT of ~8–12-week old male and female CON, LrpprcBKO, Atf4BKO, and Lrpprc;Atf4BKO mice housed at RT. Sample size: CON (n=6), LrpprcBKO (n=9), Atf4BKO (n=4), and Lrpprc;Atf4BKO (n=8). Data were presented as average ± SEM. Unpaired t-test. n.s.: non-significant; *: p<0.05 and **: p<0.01.
Figure 3.
Figure 3.. ATF4 activation in brown adipocytes induces Ucp1-independent thermogenesis in mice.
(A) Cross scheme to generate BA-specific ATF4 overexpression (ATF4BOX) and its control (CON). (B) Left: Immunoblots of total ATF4 (endogenous and exogenous), Flag-ATF4 (exogenous) and Hsp90 in the BAT from ~8-week-old male CON and ATF4BOX mice at RT and 30°C. Right: Relative abundance of total ATF4 protein (to Hsp90) amounts. Significance between genotypes indicated. (C) Representative H&E staining of BAT from ~8–10-week-old male CON, and ATF4BOX mice housed at RT and 30°C. Scale bar: 50 μm. (D) Left: Immunoblots of Ucp1 and Hsp90 form BAT lysates of ~8–10-week-old male CON and ATF4BOX mice at RT and 30°C. Right: Relative abundance of Ucp1 protein (to Hsp90) amounts. (E) State 3, ATP turnover and maximum OCRs in Seahorse experiments measuring oxygen consumption rates (OCRs) of isolated mitochondria from BAT of ~8–12-week-old male and female CON and ATF4BOX mice housed at 30°C, upon addition of ADP, Oligo, FCCP and A&R. Values are normalized as per mitochondrial protein. Sample size: CON (n=6), ATF4BOX (n=7). (F) Left: Mitochondrial cocktail immunoblot showing amounts of representative protein abundance of each ETC complex, Ndufb8 (complex I), Sdhb (complex II), Uqcrc2 (complex III), mt-Co1 (complex IV) and Atp5a (complex V), in isolated BAT mitochondria from ~8–10-week-old male CON and ATF4BOX mice housed at RT and 30°C. Right: Relative abundance (to Hsp60) amounts. (G) Left: Immunoblots of mt-Co1, mt-Co2, Cox4, Cox5b, Cox6b and Hsp60 in isolated BAT mitochondria from ~8–10-week-old male CON and ATF4BOX mice housed at RT and 30°C. Right: Relative abundance (to Hsp60) amounts. (H) Violin plot of log2 FC of mt ETC, nuclear ETC and ATF4 target in the BAT of ~8–12-week-old male ATF4BOX mice to their relative controls (ROSA-LSL-ATF4) housed at RT and 30°C. Red and black bars: median and quartiles. (I) The Temp (Neck-Back) of ~12-week-old male and female CON and ATF4BOX mice 2 hours after injections of Propranolol or Sotagliflozin or Orlistat or BCH or their vehicles at thermoneutrality. Sample size: CON (n=7) and ATF4BOX (n=8). (J) CTT of ~8–12-week-old male and female CON and ATF4BOX mice housed at RT and 30°C. Sample size: CON/RT (n=5), ATF4BOX/RT (n=5), CON/30°C (n=6) and ATF4BOX/30°C (n=7). (K) Representative H&E staining of BAT of ~8-week-old male Ucp1 KO and ATF4BOX;Ucp1 KO mice at RT. Scale bar: 100 μm. (L) Left: Mitochondrial cocktail immunoblot showing amounts of representative protein abundance of each ETC complex, Ndufb8 (complex I), Sdhb (complex II), Uqcrc2 (complex III), mt-Co1 (complex IV) and Atp5a (complex V), in isolated BAT mitochondria from ~8–10-week-old male CON, ATF4BOX, Ucp1 KO and ATF4BOX;Ucp1 KO mice at RT. Right: Relative abundance (to Hsp60) amounts. (M) Left: Immunoblots of mt-Co1, mt-Co2, Cox4, Cox5b, Cox6b and Hsp60 in isolated BAT mitochondria from ~8–10-week-old male CON, ATF4BOX, Ucp1 KO and ATF4BOX;Ucp1 KO mice at RT. Right: Relative abundance (to Hsp60) amounts. (N) Violin plot of log2 FC of mt ETC, nuclear ETC and ATF4 target in the BAT of ~8–12-week old male Ucp1 knockout (Ucp1 KO) and BA-specific ATF4 overexpression mice in Ucp1 KO background (ATF4BOX;Ucp1 KO) to their relative controls (ROSA-LSL-ATF4;Ucp1 KO or Ucp1-Cre;Ucp1 KO) housed at RT. Red and black bars: median and quartiles. (O) The Temp (Neck-Back) of ~12-week-old male and female Ucp1 KO and ATF4BOX;Ucp1 KO mice 30 minutes after injections of Propranolol or Sotagliflozin or Orlistat or BCH or their vehicles at thermoneutrality. Sample size: Ucp1 KO (n=6) and ATF4BOX;Ucp1 KO (n=9). (P) CTT of ~8–12-week old male and female Ucp1 KO and ATF4BOX;Ucp1 KO mice housed at RT. Sample size: Ucp1 KO/RT (n=14) and ATF4BOX;Ucp1 KO (n=7). Data were presented as average ± SEM. Unpaired t-test. n.s.: non-significant; *: p<0.05 and **: p<0.01.
Figure 4.
Figure 4.. ATF4 activation induced cellular protein turnover in brown adipocytes.
3D rendering (A) and average values of 18F-Fluciclovine uptake (B) in ~10–12-week-old male CON and LrpprcBKO mice. White cycle: BAT. Sample size: CON (n=9) and LrpprcBKO (n=8). (C) Left: Immunoblots of p-S6, total S6, p-4Ebp1, total 4Ebp1, puromycylated protein, ubiquitinated protein and Hsp90 in the BAT of ~10-week-old male CON and ATF4BOX mice at ad libitum feeding at RT and 30°C. Right: Relative abundance (to Hsp90) or phosphorylation (to total protein) shown. Significance between genotypes indicated. (D) Core temperature drop of ~10-week-old male and female LrpprcBKO mice and their relative controls with pretreatment of DMSO, or 4mg kg−1 rapamycin (RAPA), or 0.625mg kg−1 bortezomib (BORT), or 50mg kg−1 BCH after 8 hours 4°C CTT from RT. Sample size: CON/RT/DMSO (n=9), LrpprcBKO/RT/DMSO (n=10), CON/RT/RAPA (n=6), LrpprcBKO/RT/RAPA (n=7), CON/RT/BORT (n=4), LrpprcBKO/RT/BORT (n=4), CON/RT/BCH (n=8) and LrpprcBKO/RT/BCH (n=5). (E) Core temperature drop of ~10-week-old male and female CON and ATF4BOX mice with pretreatment of DMSO or RAPA or BORT or BCH after 3 hours 4°C CTT from 30°C. Sample size: CON/30°C/DMSO (n=14), ATF4BOX/30°C/DMSO (n=14), CON/30°C/RAPA (n=5), ATF4BOX/30°C/RAPA (n=8), CON/30°C/BORT (n=5), ATF4BOX/30°C/BORT (n=7), CON/30°C/BCH (n=4) and ATF4BOX/30°C/BCH (n=9). (F) Core temperature drop of ~10-week-old male and female Ucp1 KO and ATF4BOX;Ucp1 KO mice with pretreatment of DMSO or RAPA or BORT or BCH after 3 hours 4°C CTT from RT. Sample size: Ucp1 KO/RT/DMSO (n=5), ATF4BOX;Ucp1 KO/RT/DMSO (n=3), Ucp1 KO/RT/RAPA (n=10), ATF4BOX;Ucp1 KO/RT/RAPA (n=5), Ucp1 KO/RT/BORT (n=4), ATF4BOX;Ucp1 KO/RT/BORT (n=4), Ucp1 KO/RT/BCH (n=5) and ATF4BOX;Ucp1 KO/RT/BCH (n=5). (G) The Temp (Neck-Back) of ~12-week-old male and female CON and LrpprcBKO mice 2 hours after injections of RAPA or BORT or DMSO at thermoneutrality. Sample size: CON (n=6) and LrpprcBKO (n=11). (H) The Temp (Neck-Back) of ~12-week-old male and female CON and ATF4BOX mice 2 hours after injections of RAPA or BORT or DMSO at thermoneutrality. Sample size: CON (n=7) and ATF4BOX (n=8). (I) The Temp (Neck-Back) of ~12-week-old male and female Ucp1 KO and ATF4BOX;Ucp1 KO mice 2 hours after injections of RAPA or BORT or DMSO at thermoneutrality. Sample size: Ucp1 KO (n=6) and ATF4BOX;Ucp1 KO (n=9). (J) Experimental setup of pSILAC in ATF4-expressing differentiated BAs. BAT SVF cells from ROSA-LSL-ATF4 or ROSA-LSL-ATF4;Ucp1 KO mice were cultured and differentiated in vitro. Four days after differentiation, GFP or Cre adenovirus were added at 100 MOI for two days. Cells were cultured in light medium from day 0 to 8, then transferred to heavy medium up to one day. Cells were collected at indicated time points for expression and mass spectrometry analyses. (K) Left: Immunoblots of Ucp1, Flag-ATF4, p-S6, total S6, p-4Ebp1, total 4Ebp1, puromycylated protein, ubiquitinated protein and Hsp90 in GFP or Cre-treated wild-type or Ucp1 KO BAs. Right: Relative abundance (to Hsp90) or phosphorylation (to total protein) shown. Significance between genotypes indicated. (L) Left: Immunoblots of Flag-ATF4, total ATF4, p-S6, total S6, p-4Ebp1, total 4Ebp1, puromycylated protein, ubiquitinated protein and Hsp90 in GFP or Cre-treated wild-type BAs after 4-hour treatment of 10 mM BCH or DMSO. Right: Relative abundance (to Hsp90) or phosphorylation (to total protein) shown. Significance between genotypes and treatment indicated. Data were presented as average ± SEM. Unpaired t-test. n.s.: non-significant; *: p<0.05 and **: p<0.01. (M) Box plot showing the fraction of heavy labeled over total protein in the GFP- or Cre-infected BAs in either wild-type (WT) or Ucp1 KO background at 6, 12, 24 hours post heavy medium switch. Welch’s 2-sided t-test performed. (N) Volcano plots showing the changes of H/L ratio between Cre- and GFP-infected BAs (X axis) and −log10 p value (Y axis) at 24-hour timepoint in WT and Ucp1 KO background. Grey box: proteins with higher turnover after ATF4-overexpression.
Figure 5.
Figure 5.. A low-protein diet feeding activates ATF4 in brown adipocytes.
(A) Diagram of experimental design showing low-protein (LP) feeding of C57bl/6j mice at 30°C. (B) Representative H&E staining of BAT of ~12-week-old male C57bl/6J mice after 4-week CP or LP feeding at 30°C. Scale bar: 100 μm. (C) The Temp (Neck-Back) of ~12-week-old male C57bl/6J mice after 4-week CP or LP feeding at 30°C. Sample size: CP (n=4) and LP (n=6). (D) CTT of ~12-week-old male and female wild-type (C57bl/6J) mice between low-protein (LP) and control protein (CP) feeding. Sample size: C57bl/6J-CP (n=5) and C57bl/6J-LP (n=5). Q-PCR analysis of Ucp1 (E) and ATF4 target genes (F) in the BAT of ~12-week-old male C57bl/6J mice at ad libitum CP or LP feeding at 30°C. Sample size: CP (n=5) and LP (n=5). (G) Left: Immunoblots of p-eIF2α, total eIF2α, Atf4, Ucp1 and Hsp90 in the BAT of ~12-week-old male C57bl/6J mice after 4-week CP or LP feeding at 30°C. Right: Relative abundance (to Hsp90) or phosphorylation (to total protein) shown. Significance between diets indicated. (H) Left: Immunoblots of p-S6, total S6, p-4Ebp1, total 4Ebp1, puromycylated protein, ubiquitinated protein and Hsp90 in the BAT of C57bl/6J mice at ad libitum CP or LP feeding at 30°C. Right: Relative abundance (to Hsp90) or phosphorylation (to total protein) shown. Significance between diets indicated. (I) Left: Immunoblots of p-S6, total S6, p-4Ebp1, total 4Ebp1, puromycylated protein, ubiquitinated protein and Hsp90in the BAT of C57bl/6J mice at ad libitum feeding CP or LP feeding with DMSO or BCH injection at 30°C. Right: Relative abundance (to Hsp90) or phosphorylation (to total protein) shown. Significance between diets indicated. (J) CTT of ~12-week-old male and female C57bl/6J mice after CP or LP feeding at 30°C. DMSO or BCH was injected 1 hour prior to CTT. Sample size: C57bl/6J-CP/DMSO (n=3), C57bl/6J-CP/BCH (n=4), C57bl/6J-LP/DMSO (n=7) and C57bl/6J-LP/BCH (n=9). (K) Diagram of experimental design showing LP feeding of Ucp1 KO mice at RT. (L) Representative H&E staining of BAT of ~12-week-old male Ucp1 KO mice after 4-week CP or LP feeding at RT. Scale bar: 100 μm. (M) The Temp (Neck-Back) of ~12-week-old male and female Ucp1 KO mice under 4-week CP or LP feeding. (N) The Temp (Neck-Back) of ~12-week-old male and female Ucp1 KO mice with or without BCH injection under 4-week CP or LP feeding. (O) The Temp (Neck-Back) of ~12-week-old male and female Ucp1 KO mice with or without propranolol injection under 4-week CP or LP feeding. Sample size: CP (n=8) and LP (n=8). (P) CTT of ~12-week-old male and female Ucp1 KO mice after CP or LP feeding at RT. Sample size: Ucp1 KO-CP (n=5) and Ucp1 KO-LP (n=7). (Q) Core temperature drop of ~12-week-old male and female Ucp1 KO mice fed with CP or LP after 4-hour CTT from RT. DMSO or BCH was injected 1 hour prior to CTT. Sample size: Ucp1 KO-CP/DMSO (n=4), Ucp1 KO-CP/BCH (n=4), Ucp1 KO-LP/DMSO (n=6) and Ucp1 KO-LP/BCH (n=5). (R) Q-PCR analysis of ATF4 target genes in the BAT of ~12-week-old male and female Ucp1 KO mice after 4-week CP or LP feeding at RT. Sample size: Ucp1 KO-CP (n=4) and Ucp1 KO-LP (n=4). (S) Left: Immunoblots of p-S6, total S6, p-4Ebp1, total 4Ebp1, puromycylated protein, ubiquitinated protein and Hsp90 in the BAT of ~12-week-old Ucp1 KO mice at ad libitum CP or LP feeding at RT. Right: Relative abundance (to Hsp90) or phosphorylation (to total protein) shown. Significance between diets indicated. (T) Representative H&E staining of BAT of ~12-week-old male CON and Atf4BKO mice after 4-week CP or LP feeding at 30°C. Scale bar: 100 μm. Q-PCR analysis of Ucp1 (U) and ATF4 target genes (V) in the BAT of the aforementioned mice. Sample size: CON-CP (n=6), CON-LP (n=6), Atf4BKO-CP (n=5) and Atf4BKO-LP (n=5). (W) Left: Immunoblots of p-S6, total S6, p-4Ebp1, total 4Ebp1, puromycylated protein, ubiquitinated protein and Hsp90 in the BAT of CON and Atf4BKO mice at ad libitum CP or LP feeding at 30°C. Right: Relative abundance (to Hsp90) or phosphorylation (to total protein) shown. Significance between diets indicated. (X) CTT of ~12-week-old male and female CON and Atf4BKO mice after CP or LP feeding at 30°C. Sample size: CON-CP (n=5), CON-LP (n=12), Atf4BKO-CP (n=3) and Atf4BKO-LP (n=11). Data were presented as average ± SEM. Unpaired t-test. n.s.: non-significant; *: p<0.05 and **: p<0.01.
Figure 6.
Figure 6.. LrpprcBKO mice exhibit improved systemic metabolism due to ATF4 activation in brown adipocytes.
(A) Body weight of male CON and LrpprcBKO mice under 12-week HFD at RT and 30°C. Sample size: CON/RT (n=12), LrpprcBKO/RT (n=11), CON/30°C (n=7) and LrpprcBKO/30°C (n=15). (B) Representative images of dissected iWAT, eWAT and BAT from male CON and LrpprcBKO mice after 12-week HFD. Serum glucose levels during ITT in male CON and LrpprcBKO mice after 4-week and 12-week HFD at RT (C) and 30°C (D). Sample size: CON/4w-HFD/RT (n=8), LrpprcBKO/4w-HFD/RT (n=7), CON/12w-HFD/RT (n=5), LrpprcBKO/12w-HFD/RT (n=5), CON/4w-HFD/30°C (n=6), LrpprcBKO/4w-HFD/30°C (n=9), CON/12w-HFD/30°C (n=7) and LrpprcBKO/12w-HFD/30°C (n=15). (E) Area under the curve (AUC) values of glucose levels in ITTs showed. (F) Serum insulin levels in male CON and LrpprcBKO mice after 12-week HFD. Sample size: CON/RT (n=5), LrpprcBKO/RT (n=4), CON/30°C (n=4), LrpprcBKO/30°C (n=6). (G) Serum triglyceride contents of male CON and LrpprcBKO mice after HFD at RT. Sample size: Sample size: CON/NC/RT (n=6), LrpprcBKO/NC/RT (n=10), CON/4w-HFD/RT (n=8), LrpprcBKO/4w-HFD/RT (n=10), CON/12w-HFD/RT (n=5) and LrpprcBKO/12w-HFD/RT (n=5). (H) Serum triglyceride contents of male CON and LrpprcBKO mice after 12-week HFD at 30°C. Sample size: CON/12w-HFD/30°C (n=6) and LrpprcBKO/12w-HFD/30°C (n=13). (I) Representative H&E staining of liver from male CON and LrpprcBKO mice after 12-week HFD. Scale bar: 25 μm. (J) Liver triglyceride contents of male CON and LrpprcBKO mice after HFD at RT. Sample size: CON/NC/RT (n=6), LrpprcBKO/NC/RT (n=7), CON/4w-HFD/RT (n=7), LrpprcBKO/4w-HFD/RT (n=6), CON/12w-HFD/RT (n=5) and LrpprcBKO/12w-HFD/RT (n=5). (K) Liver triglyceride contents of male CON and LrpprcBKO mice after 12-week HFD at 30°C. Sample size: CON/12w-HFD/30°C (n=7) and LrpprcBKO/12w-HFD/30°C (n=14). (L) Body weight of male CON, LrpprcBKO and Lrpprc;Atf4BKO mice under 12-week HFD at RT. Sample size: CON/RT (n=13), LrpprcBKO/RT (n=6) and Lrpprc;Atf4BKO/RT (n=8). (M) Serum glucose levels during ITT in male CON, LrpprcBKO and Lrpprc;Atf4BKO mice after 12-week HFD at RT. (N) Area under the curve (AUC) values of glucose levels in ITTs showed. (O) Serum insulin levels of male CON, LrpprcBKO and Lrpprc;Atf4BKO mice after HFD at RT. (P) Representative H&E staining of liver from male CON, LrpprcBKO and Lrpprc;Atf4BKO mice after 12-week HFD at RT. Scale bar: 25 μm. Liver triglyceride contents (Q) and serum triglyceride contents (R) of male CON, LrpprcBKO and Lrpprc;Atf4BKO mice after HFD at RT. Sample size: CON (n=11), LrpprcBKO (n=5), and Lrpprc;Atf4BKO (n=6). (S) Body weight of male CON, LrpprcBKO and Lrpprc;Atf4BKO mice under 12-week HFD at 30°C. Sample size: CON/30°C (n=11), LrpprcBKO/30°C (n=7), and Lrpprc;Atf4BKO/30°C (n=6). (T) Serum glucose levels during ITT in male CON, LrpprcBKO and Lrpprc;Atf4BKO mice after 12-week HFD at 30°C. (U) Area under the curve (AUC) values of glucose levels in ITTs showed. (V) Serum insulin levels of male CON, LrpprcBKO and Lrpprc;Atf4BKO mice after HFD at 30°C. (W) Representative H&E staining of liver from male CON, LrpprcBKO and Lrpprc;Atf4BKO mice after 12-week HFD at 30°C. Scale bar: 25 μm. Liver triglyceride contents (X) and serum triglyceride contents (Y) of male CON, LrpprcBKO and Lrpprc;Atf4BKO mice after HFD at 30°C. Sample size: CON (n=9), LrpprcBKO (n=6), and Lrpprc;Atf4BKO (n=5). Data were presented as average ± SEM. Unpaired t-test. *: p<0.05 and **: p<0.01.
Figure 7.
Figure 7.. ATF4 activation in brown adipocytes is sufficient to improve systemic metabolism in wild-type and Ucp1 knockout mice.
(A) Body weight of male CON and ATF4BOX mice after 12-week HFD at RT and 30°C. Sample size: CON/RT (n=8), ATF4BOX/RT (n=8), CON/30°C (n=17) and ATF4BOX/30°C (n=18). (B) Tissue mass of eWAT, iWAT, and BAT of male CON and ATF4BOX mice after 12-week HFD. Sample size: male CON/RT (n=8), ATF4BOX/RT (n=8), CON/30°C (n=13) and ATF4BOX/30°C (n=13). (C) Lean mass, fat mass, and fat percentage of male CON and LrpprcBKO mice after 12-week HFD. Sample size: CON/RT (n=8), ATF4BOX/RT (n=8), CON/30°C (n=13) and ATF4BOX/30°C (n=13). (D) Representative H&E staining of eWAT from male CON and ATF4BOX mice after 12-week HFD. Scale bar: 50 μm. (E) Serum glucose levels during ITT in male CON and ATF4BOX mice after 12-week HFD at RT and 30°C. (F) Area under the curve (AUC) values of glucose levels in ITTs showed. Sample size: CON/RT (n=8), ATF4BOX/RT (n=8), CON/30°C (n=9) and ATF4BOX/30°C (n=10). (G) Serum insulin levels in male CON and ATF4BOX mice after 12-week HFD. Sample size: CON/RT (n=6), ATF4BOX/RT (n=6), CON/30°C (n=7), ATF4BOX/30°C (n=5). (H) Serum triglyceride contents of male CON and ATF4BOX mice after 12-week HFD. Sample size: CON/RT (n=8), ATF4BOX/RT (n=8), CON/30°C (n=8) and ATF4BOX/30°C (n=10). (I) Representative H&E staining of liver from male CON and ATF4BOX mice after 12-week HFD. Scale bar: 50 μm. (J) Liver triglyceride contents of male CON and ATF4BOX mice after 12-week HFD. Sample size: CON/RT (n=8), ATF4BOX/RT (n=8), CON/30°C (n=8) and ATF4BOX/30°C (n=10). (K) Body weight of male Ucp1 KO and ATF4BOX;Ucp1 KO mice under 12-week HFD at RT and 30°C. Sample size: Ucp1 KO/RT (n=9), ATF4BOX;Ucp1 KO/RT (n=4), Ucp1 KO/30°C (n=5), and ATF4BOX;Ucp1 KO/30°C (n=4). (L) Tissue mass of eWAT, iWAT, and BAT of male Ucp1 KO and ATF4BOX;Ucp1 KO mice after 12-week HFD at RT and 30°C. (M) Lean mass, fat mass, and fat percentage of male Ucp1 KO and ATF4BOX;Ucp1 KO mice after 12-week HFD at RT and 30°C. Sample size: Ucp1 KO/RT (n=9), ATF4BOX;Ucp1 KO/RT (n=4), Ucp1 KO/30°C (n=5), and ATF4BOX;Ucp1 KO/30°C (n=4). (N) Representative H&E staining of eWAT from male CON and ATF4BOX mice after 12-week HFD. Scale bar: 50 μm. (O) Serum glucose levels during ITT in male Ucp1 KO and ATF4BOX;Ucp1 KO mice after 12-week HFD at RT and 30°C. (P) Area under the curve (AUC) values of glucose levels in ITTs showed. Sample size: Ucp1 KO/RT (n=9), ATF4BOX;Ucp1 KO/RT (n=4), Ucp1 KO/30°C (n=5), and ATF4BOX;Ucp1 KO/30°C (n=4). (Q) Serum triglyceride contents of male Ucp1 KO and ATF4BOX;Ucp1 KO mice after 12-week HFD at RT and 30°C. Sample size: Ucp1 KO/RT (n=9), ATF4BOX;Ucp1 KO/RT (n=4), Ucp1 KO/30°C (n=5), and ATF4BOX;Ucp1 KO/30°C (n=4). (R) Representative H&E staining of liver from male CON and ATF4BOX mice after 12-week HFD. Scale bar: 25 μm. (S) Liver triglyceride contents of male Ucp1 KO and ATF4BOX;Ucp1 KO mice after 12-week HFD at RT and 30°C. Sample size: Ucp1 KO/RT (n=9), ATF4BOX;Ucp1 KO/RT (n=4), Ucp1 KO/30°C (n=5), and ATF4BOX;Ucp1 KO/30°C (n=4). Data were presented as average ± SEM. Unpaired t-test. *: p<0.05 and **: p<0.01. (T) Scatter plots showing index of HFD-induced obesity (the Log2 fold-change values of body weight after HFD) as the function of ATF4 activation in BAs (the average Log2 fold-change of ATF4 target genes in BAT). Dashed red cycle: LrpprcBKO, TfamBKO, ATF4BOX and ATF4BOX;Ucp1 KO mice that exhibited enhanced cellular proteome turnover and reduced HFD-induced obesity.

References

    1. Aksnes AK, Brundin T, Hjeltnes N, and Wahren J (1995). Metabolic, thermal and circulatory effects of intravenous infusion of amino acids in tetraplegic patients. Clin Physiol 15, 377–396. - PubMed
    1. Anunciado-Koza R, Ukropec J, Koza RA, and Kozak LP (2008). Inactivation of UCP1 and the glycerol phosphate cycle synergistically increases energy expenditure to resist diet-induced obesity. The Journal of biological chemistry 283, 27688–27697. - PMC - PubMed
    1. Bachman ES, Dhillon H, Zhang CY, Cinti S, Bianco AC, Kobilka BK, and Lowell BB (2002). betaAR signaling required for diet-induced thermogenesis and obesity resistance. Science 297, 843–845. - PubMed
    1. Ballinger A, and Peikin SR (2002). Orlistat: its current status as an anti-obesity drug. European journal of pharmacology 440, 109–117. - PubMed
    1. Bao XR, Ong SE, Goldberger O, Peng J, Sharma R, Thompson DA, Vafai SB, Cox AG, Marutani E, Ichinose F, et al. (2016). Mitochondrial dysfunction remodels one-carbon metabolism in human cells. eLife 5. - PMC - PubMed

Publication types

MeSH terms