. 2021 Sep 22;22(1):687.
doi: 10.1186/s12864-021-07981-9.

Transcriptional profiling reveals changes in gene regulation and signaling transduction pathways during temperature stress in wucai (Brassica campestris L.)

Affiliations

Transcriptional profiling reveals changes in gene regulation and signaling transduction pathways during temperature stress in wucai (Brassica campestris L.)

Lingyun Yuan et al. BMC Genomics. .

Abstract

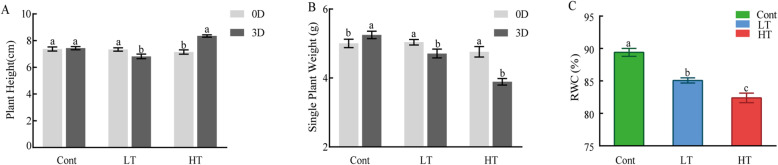
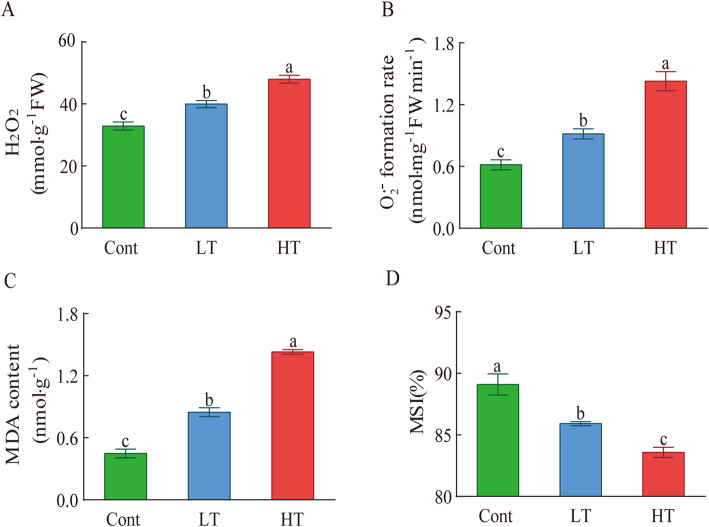
Background: Wucai (Brassica campestris L. ssp. chinensis var. rosularis Tsen) is a cold-tolerant plant that is vulnerable to high temperature. This study explored the response mechanism of wucai to low temperature. In this study, wucai seedlings were treated with different temperatures, including low temperature (LT), high temperature (HT), and a control.

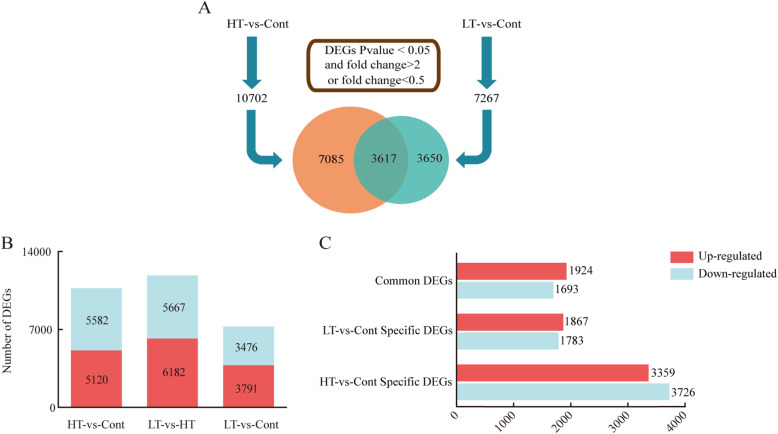
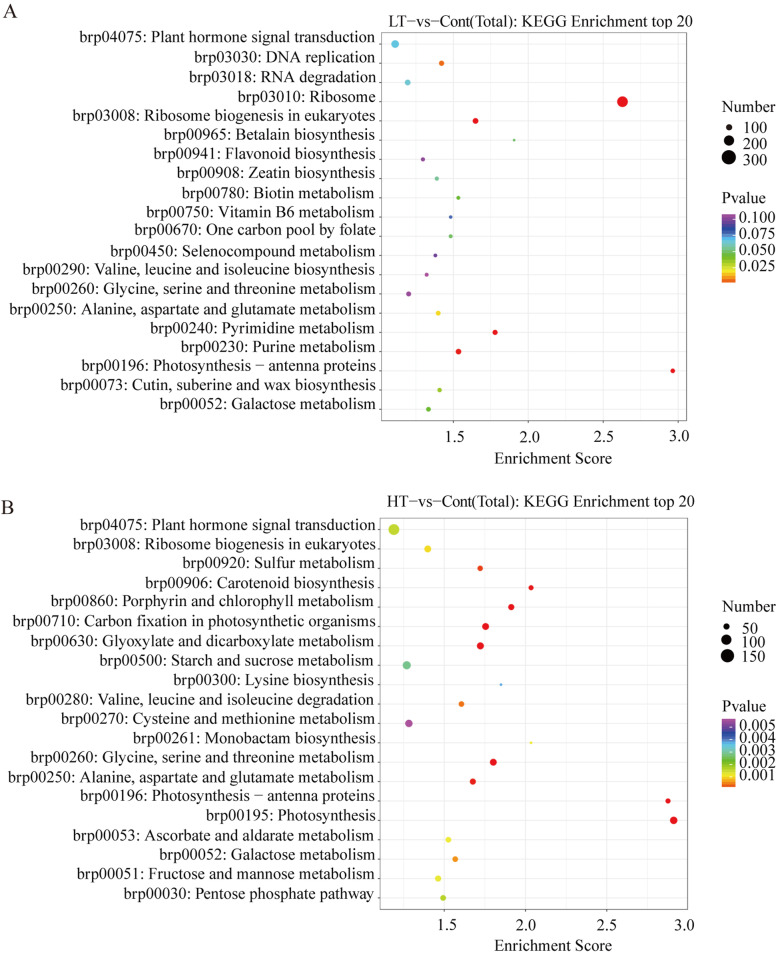
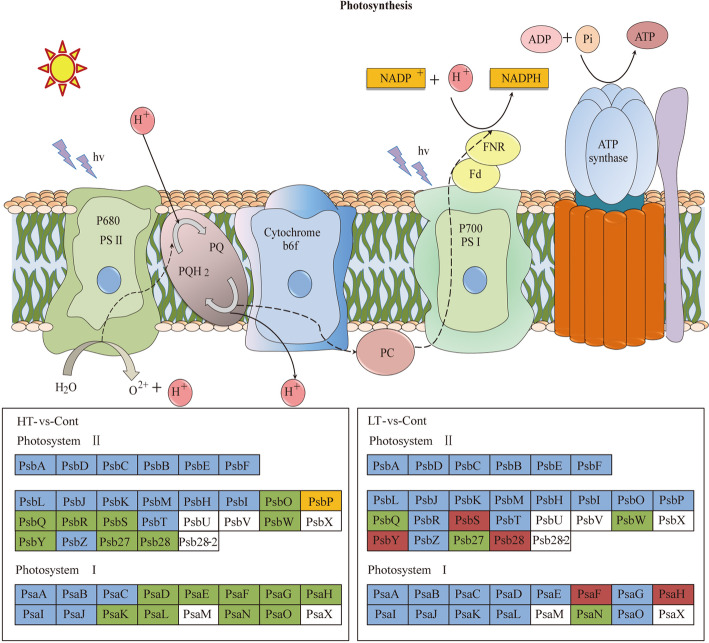
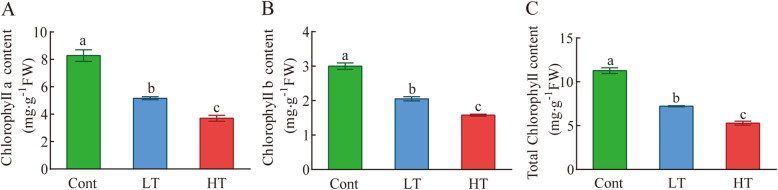
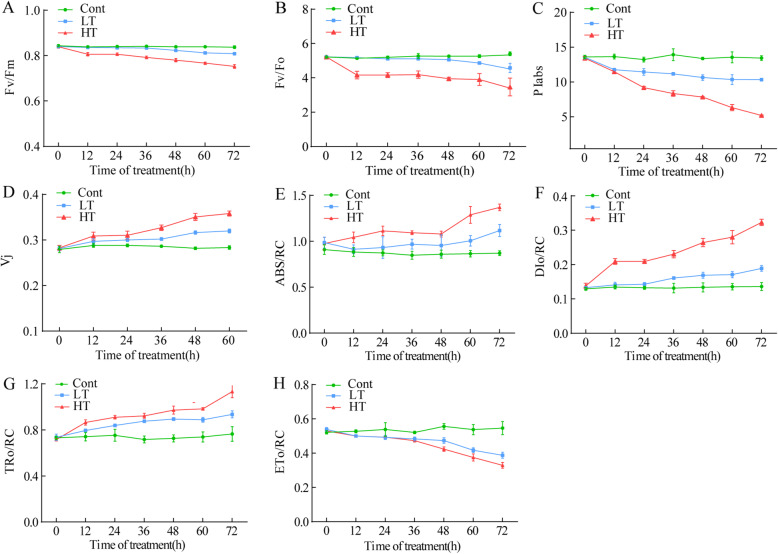
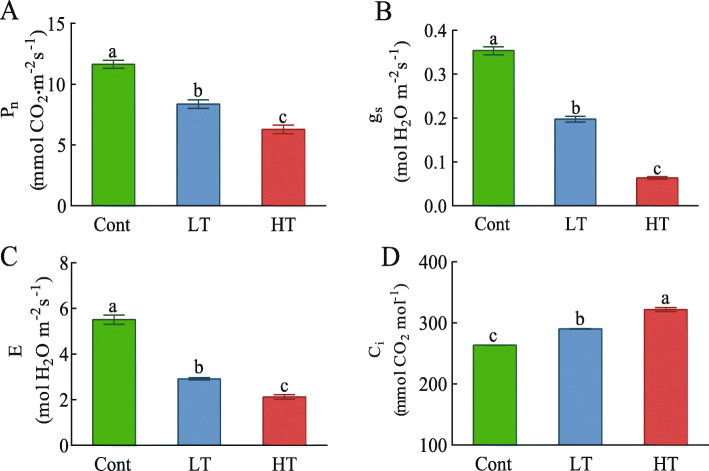
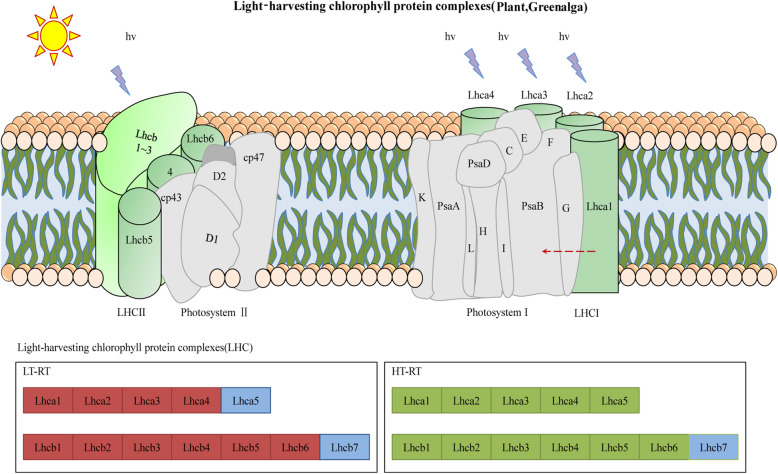
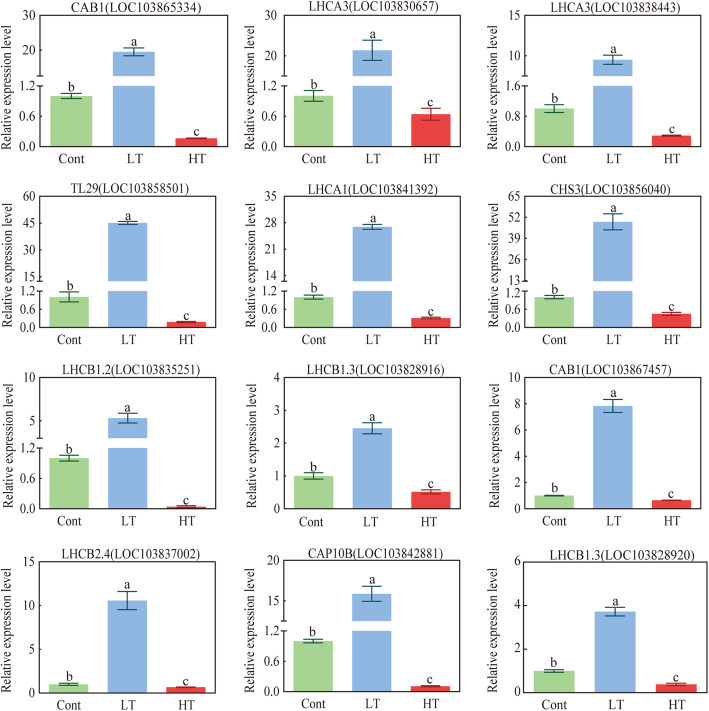
Results: According to transcriptomics analysis, the number of differentially expressed genes (DEGs) in HT and LT was 10,702 and 7267, respectively, compared with the control. The key genes associated with the physiological response of wucai to the treatments were analyzed. The Kyoto Encyclopedia of Genes and Genomes and Gene Ontology annotations indicated the importance of the photosynthesis and photosynthetic-antenna protein pathways. We found that a high-temperature environment greatly inhibited the expression of important genes in the photosynthetic pathway (BrLhc superfamily members, PsaD, PsaE, PsaD, PsaD, PsbO, PsbP, PsbQ, PsbR, PsbS, PsbW, PsbY, Psb27, and Psb28), whereas low temperature resulted in the expression of certain key genes (BrLhc superfamily members, Psa F, Psa H, Psb S, Psb H, Psb 28). In addition, the wucai seedlings exhibited better photosynthetic performance under low-temperature conditions than high-temperature conditions.

Conclusions: Based on the above results, we speculate that upon exposure to low temperature, the plants developed higher cold tolerance by upregulating the expression of genes related to photosynthesis. Conversely, high-temperature stress inhibited the expression of pivotal genes and weakened the self-regulating ability of the plants.

Keywords: BrLhc superfamily; Differentially expressed genes; Photosynthesis; RNA-Seq; Temperature stress; Wucai.


Conflict of interest statement

The authors declare that they have no competing interests.

Figures

Fig. 1
Fig. 1
The effects of different temperature stresses on the plant height (a), single plant weight (b), and relative water content (RWC, c) of the leaves of wucai. Values represent the mean ± SE (n = 3). Letters indicate significant differences at P < 0.05 according to Duncan’s multiple range tests. Representative data from five independent experiments are shown
Fig. 2
Fig. 2
The effects of different temperature stresses on the H2O2 content (a), O2•- formation rate (b), MDA content (c), MSI (d), Values represent the mean ± SE (n = 3). Letters indicate significant differences at P < 0.05 according to Duncan’s multiple range tests
Fig. 3
Fig. 3
Differential gene expression in response to temperature stress under low temperature (LT) and high temperature (HT) treatments. a The number of DEGs in the leaves of wucai under LT-vs-Cont and HT-vs-Cont. The value shared by the two ellipses indicates the number of genes that are co-regulated. b Expression of DEGs in HT-vs-Cont, LT-vs-HT, LT-vs-Cont. c Common DEG for both LT-vs-Cont and HT-vs-Cont, including the distribution of DEGs specifically regulated by each. P value < 0.05 and foldChange > 2 or foldChange < 0.5 was set as the threshold for significantly differential expression
Fig. 4
Fig. 4
KEGG enrichment analysis results, with the 20 most enriched KEGG terms shown. High and low P-values are represented by blue and red, respectively. KEGG pathway enrichment analyses of the DEGs in the LT-vs-Cont (a). KEGG pathway enrichment analyses of the DEGs in the HT-vs-Cont (b)
Fig. 5
Fig. 5
Photosynthesis-related gene expression in wucai leaves under LT and HT based on the KEGG pathway analysis. Red, green, and blue represent upregulated, downregulated, and nonregulated genes
Fig. 6
Fig. 6
Effects of photosynthetic pigment contents in wucai leaves under temperature stress. A–C Quantification of the Chl a content (a), Chl b content (b), total Chl content (c). The data are presented as the mean ± SE. Bars with different letters above the columns indicate significant differences (P < 0.05, Duncan’s range test) on a given day of treatment
Fig. 7
Fig. 7
The influence of different temperature stresses on Fv/Fm (a), Fv/Fo (b), PIabs (c), Vj (d), ABS/RC(e), DIO/RC(f), TRO/RC(g), and ETO/RC(h). The data are presented as the mean ± SE. Representative data from five independent experiments are shown
Fig. 8
Fig. 8
The influence of different temperature stresses on the photosynthetic rate (PN, A), stomatal conductance (gs, B), transpiration rate (E, C), and intercellular CO2 concentration (Ci, D). The data are presented as the mean ± SE. Bars with different letters above the columns indicate significant differences (P < 0.05, Duncan’s range test) on a given day of treatment
Fig. 9
Fig. 9
Photosynthesis-antenna proteins-related gene expression in wucai leaves influenced by LT and HT based on the KEGG pathway analysis. Red, green, and blue represent the upregulated, downregulated, and nonregulated genes
Fig. 10
Fig. 10
Cis-acting elements of the BrLhc superfamily. Colored rectangles represent different cis-acting elements
Fig. 11
Fig. 11
The effects of different temperature stress on photosynthesis-related genes in the leaves of wucai. The data are presented as the mean ± SE. Bars with different letters above the columns indicate significant differences (P < 0.05, Duncan’s range test) on a given day of treatment

References

    1. Wahid A, Gelani S, Ashraf M, Foolad MR. Heat tolerance in plants: an overview. Environ Exp Bot. 2007;61(3):199–223. doi: 10.1016/j.envexpbot.2007.05.011. - DOI
    1. Huang GT, Ma SL, Bai LP, Zhang L, Ma H, Jia P, Liu J, Zhong M, Guo ZF. Signal transduction during cold, salt, and drought stresses in plants. Mol Biol Rep. 2012;39(2):969–987. doi: 10.1007/s11033-011-0823-1. - DOI - PubMed
    1. Kim YS, Lee M, Lee JH, Lee HJ, Park CM. The unified ICE–CBF pathway provides a transcriptional feedback control of freezing tolerance during cold acclimation in Arabidopsis. Plant Mol Biol. 2015;89(1–2):187–201. doi: 10.1007/s11103-015-0365-3. - DOI - PubMed
    1. Corpas FJ, Leterrier M, Valderrama R, Airaki M, Chaki M, Palma JM, Barroso JB. Nitric oxide imbalance provokes a nitrosative response in plants under abiotic stress. Plant Sci. 2011;181(5):604–611. doi: 10.1016/j.plantsci.2011.04.005. - DOI - PubMed
    1. Baudouin E. The language of nitric oxide signalling. Plant Biol. 2011;13(2):233–242. doi: 10.1111/j.1438-8677.2010.00403.x. - DOI - PubMed