. 2021 Sep 22;12(1):5579.
doi: 10.1038/s41467-021-25761-7.

Liquid condensation of reprogramming factor KLF4 with DNA provides a mechanism for chromatin organization

Affiliations

Liquid condensation of reprogramming factor KLF4 with DNA provides a mechanism for chromatin organization

Rajesh Sharma et al. Nat Commun. .

Abstract

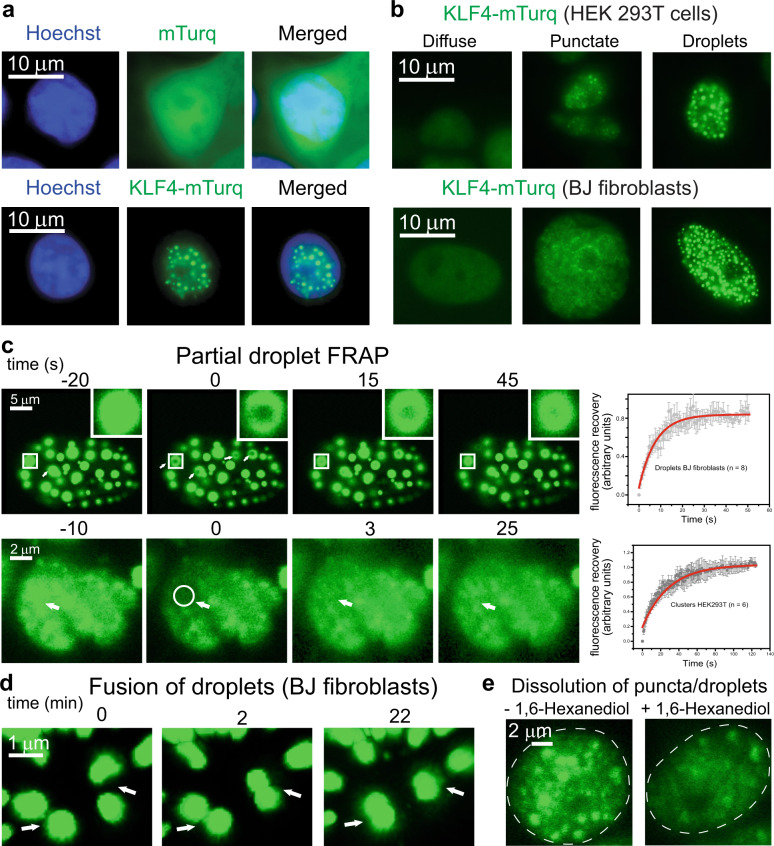
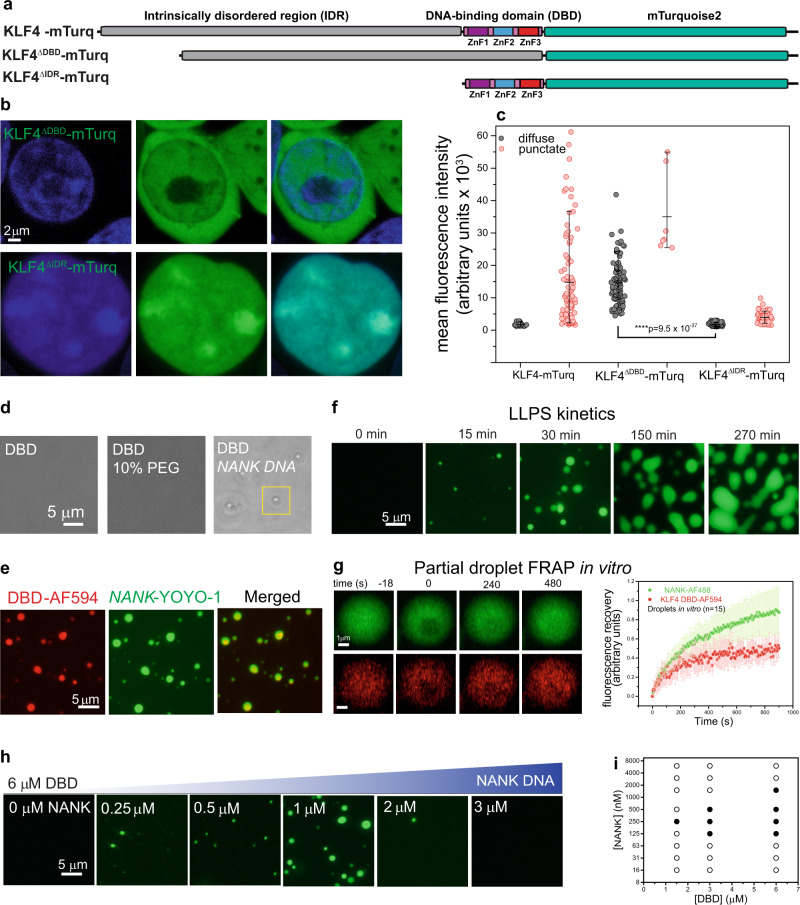
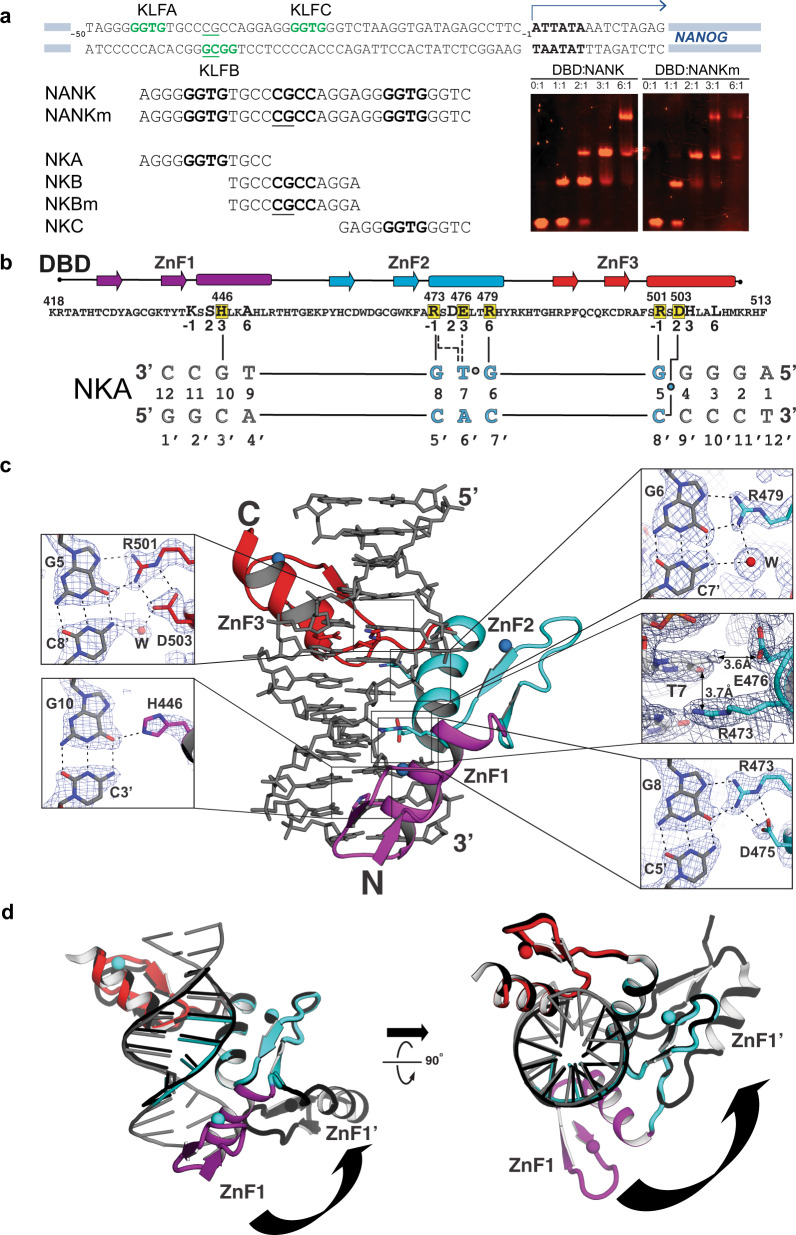
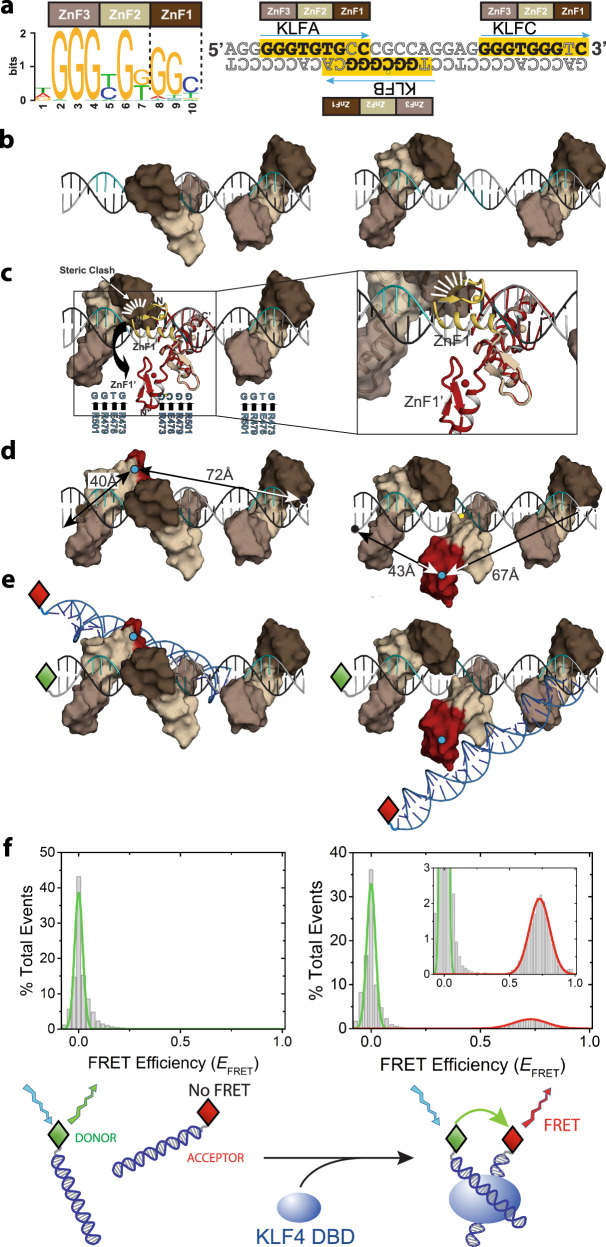
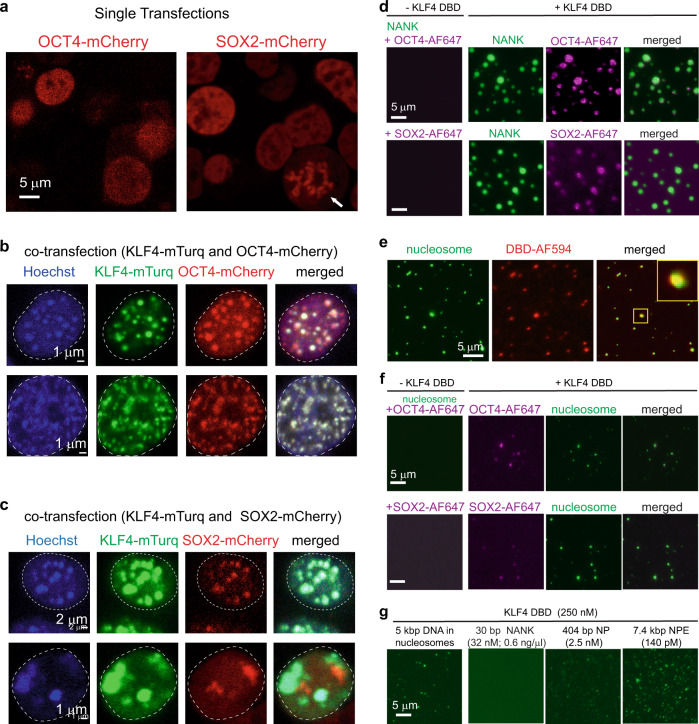
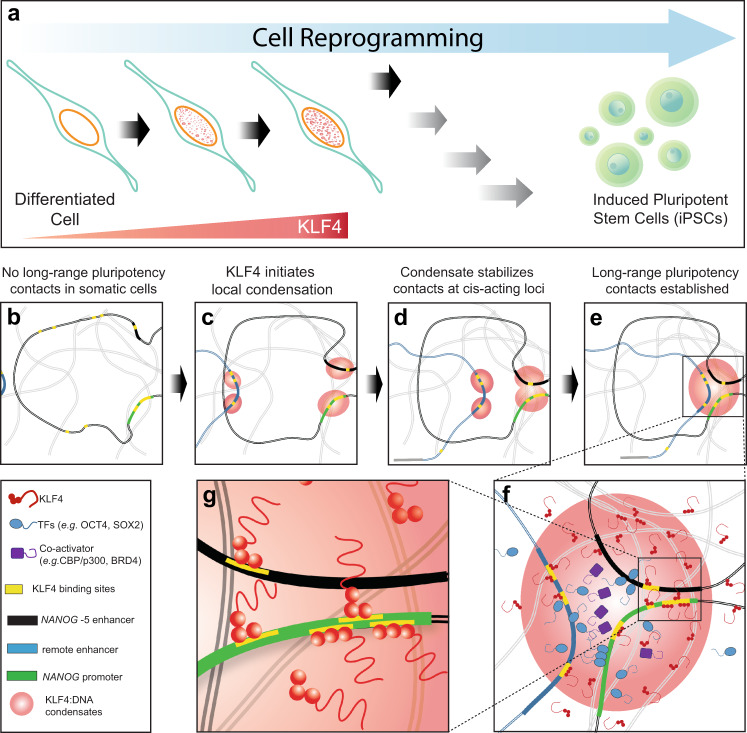
Expression of a few master transcription factors can reprogram the epigenetic landscape and three-dimensional chromatin topology of differentiated cells and achieve pluripotency. During reprogramming, thousands of long-range chromatin contacts are altered, and changes in promoter association with enhancers dramatically influence transcription. Molecular participants at these sites have been identified, but how this re-organization might be orchestrated is not known. Biomolecular condensation is implicated in subcellular organization, including the recruitment of RNA polymerase in transcriptional activation. Here, we show that reprogramming factor KLF4 undergoes biomolecular condensation even in the absence of its intrinsically disordered region. Liquid-liquid condensation of the isolated KLF4 DNA binding domain with a DNA fragment from the NANOG proximal promoter is enhanced by CpG methylation of a KLF4 cognate binding site. We propose KLF4-mediated condensation as one mechanism for selectively organizing and re-organizing the genome based on the local sequence and epigenetic state.


Conflict of interest statement

The authors declare no competing interests.

Figures

Fig. 1
Fig. 1. KLF4 forms a condensed liquid phase in HEK 293T cells and BJ fibroblasts.
a Fluorescence microscopy images of DNA (Hoechst), mTurq fluorescent tag (top), and KLF4-mTurq (bottom) in HEK 293T cells. Nuclear mTurq distribution is diffuse whereas KLF4-mTurq forms biomolecular condensates. Similar results were obtained for >5 biological replicates. b HEK 293T cells (top) and BJ fibroblasts (bottom) expressing KLF4-mTurq exhibit diffuse distribution (left), irregular puncta (middle), or droplets (right; circularity > 0.8). Similar results were obtained for 3 biological replicates. c Fluorescence recovery after photobleaching (FRAP) of KLF4-mTurq droplets in BJ fibroblasts (top row) bleached at positions indicated by white arrows; right panel is a recovery curve (n = 8 droplets) and enlarged insets track one droplet (white square). FRAP of KLF4-mTurq puncta in HEK 293T cells (bottom row) bleached at positions indicated by white arrows and circle; right panel is a recovery curve (n = 6 punctate fields). Data are presented as mean values ± SD. d Fluorescence image time course of droplet fusion (at white arrows) in BJ fibroblasts. Fusion was verified with 3D z-stack images. e Fluorescence microscopy image of KLF4-mTurq puncta and droplets in HEK 293T cells before (left) and after (right) 1,6-hexanediol treatment. Nucleus outline in white dashes. Similar results were obtained for 2 biological replicates.
Fig. 2
Fig. 2. The KLF4 intrinsically disordered region is dispensable for biomolecular condensation.
a Domain organization of KLF4-mTurq constructs. b Fluorescence microscopy of mTurq fusions and DNA (Hoechst) in HEK 293T cells. KLF4ΔDBD-mTurq (top) is found throughout cells and is diffuse in the nucleus; KLF4ΔIDR-mTurq (bottom) localizes to the nucleus and forms condensates. Similar results were obtained results for 2 biological replicates. c HEK 293T cells expressing KLF4-mTurq variants classified as diffuse (gray) or punctate (red) are plotted by their mean fluorescence intensity; the long horizontal bars mark the median, and the top and bottom bars on the vertical lines denote the 90-10 percentiles. Diffuse cells expressing deletion constructs show very different fluorescence levels (statistical tests were performed using a two-sided Student’s paired t-test; P value shown; n = 105 cells each). KLF4ΔIDR-mTurq expresses poorly and 48% of cells are punctate (n = 97); KLF4ΔDBD-mTurq expresses well and 6% of cells are punctate (n = 7). Similar results were obtained for 2 biological replicates. d Bright field microscopy of 6 µM KLF4 DBD (left), with 10% PEG-8K (center) or 1 µM NANK (right) in TS buffer (12.5 mM Tris, 70 mM NaCl, pH 7.4). e Fluorescence microscopy of 6 µM DBD in TS buffer (with 50 nM DBD-AF594; red) and 1 µM NANK (with 100 nM YOYO-1; green); yellow droplets in merge indicate colocalization. Similar results were obtained for 2 replicates. f Fluorescence microscopy of DBD:NANK droplet time course taken at a focal plane close to the surface. Droplets form, grow, fuse and wet the surface. Similar results were obtained for >10 replicates. g FRAP of droplets monitoring NANK-AF488 (green; top row) or KLF4 DBD-AF594 (red; bottom row). Curves (at right) show mean and standard deviation for 15 droplets. h DNA concentration dependence of DBD:DNA liquid–liquid phase separation (LLPS). Fluorescence microscopy images of 6 µM DBD with NANK DNA (0–3 µM) in TS buffer with 100 nM YOYO-1 (green) after 30 min incubation. i LLPS measurements at various DBD and NANK concentrations; solid/open circles indicate LLPS/no LLPS. Images are scored as LLPS if the coefficient of variation (CV, standard deviation/mean pixel intensity) is >0.2 and the mean fluorescent intensity is >0.4 arbitrary units. Values were determined using ImageJ for 2–3 independent replicates.
Fig. 3
Fig. 3. Structural determinants of DBD:NANK interactions.
a Schematic of the NANOG promoter (top) and studied DNA duplexes (bottom left) with GG(T/C)G sites in bold and mCpG sites underlined. Electrophoretic mobility shift assays (bottom right) with 0–6 µM DBD and 1 µM DNA (NANK or NANKm) were stained with EtBr (red) for two independent replicates. b DBD contacts with the NKA dodecamer. (Top) DBD sequence and secondary structure for ZnF1 (magenta), ZnF2 (cyan) and ZnF3 (red). (Bottom) NKA sequence numbered 5′-to-3’; GGTG motif in cyan. DBD residues that contact DNA bases are highlighted in yellow; numerals −1, 2, 3, or 6 refer to the canonical C2H2 recognition code. Solid (or dotted) vertical lines indicate hydrogen bonds (or van der Waals contacts). c Crystal structure of DBD bound to the NKA dodecamer (middle) and close-up views (sides) with 2Fo–Fc electron density maps contoured at 1.0 σ. Three ZnFs, colored as in (b), wrap around the DNA (gray) with zinc ions as blue spheres, residues and bases colored by atom type (carbon, black; nitrogen, blue; oxygen, red), hydrogen bonds as black dotted lines, and van der Waals contact distances marked with black arrows. d Superposition of DBD:NKA complex (same colors as above) and a previous DBD:DNA complex (PDB ID: 2wbs, black) shown in two views related by a 90° rotation. ZnF1 in 2wbs is rotated away from the DNA axis compared to our complex (arrow).
Fig. 4
Fig. 4. Models and solution data for DBD interactions with NANK.
a Consensus KLF4 binding site from JASPAR and schematic DBD contacts (left); mapping these sites and contacts onto the NANK sequence (right); in each 9 bp site (yellow), bases that match the consensus are in bold. b Posing DBD:NKA at cognate sites KLFB/KLFC (left) or KLFA/KLFC (right) on B-DNA NANK model generates no clashes. c B-DNA NANK model with canonical DBDs at KLFA and KLFC shown as surfaces and two poses for DBD at KLFB in cartoons. ZnF1 of DBD:NKA (yellow) clashes with DBD modeled at KLFA (top right) but an alternate ZnF1 pose (2wbs, red) does not. Positions of key residue:base contacts indicated in cyan. d Distances between modeled NANK 5′ ends and H446 Cα of ZnF1 sterically excluded from KLFA (left) or KLFB (right) favor 5′ labeling the coding strand. e Superimposing a second duplex on the excluded ZnFs suggests that 5′ labels could be used to detect DBD-mediated DNA bridging in solution by smFRET. f FRET efficiency (EFRET) histograms of mixtures of 100 pM Alexa 488-labeled NANK and 500 pM Alexa 594-labeled NANK in the absence (left) or presence (right) of 1 μM KLF4 DBD were fit to Gaussian functions (donor emission, green; acceptor/FRET emission, red). Bottom schematic emphasizes that the atomic details of DNA:DBD:DNA bridging are not defined experimentally.
Fig. 5
Fig. 5. DNA affinity influences KLF4-mediated liquid condensation.
a Fluorescence microscopy images of 3 µM duplex DNA in TS buffer and 100 nM YOYO-1 with (bottom) or without (top) 10 µM DBD. Similar results were obtained for 2 replicates. b Fluorescence microscopy images of DBD:DNA mixtures at 3:1 and 3:1.5 ratios show that adding cognate DNA can reverse LLPS. Similar results were obtained for 2 replicates. c Mixing DBD and DNAs at different concentrations produces condensates (black circles) or homogeneous solutions (open circles) that define LLPS phase diagrams. Images were scored as condensate if the coefficient of variation was >0.2 and the mean fluorescent intensity was >0.4 arbitrary units. Values were determined using ImageJ from 2–3 independent replicates. Fluorescence images at right are taken at 3 µM DBD and 250 nM DNA, conditions boxed in red in the phase diagrams. d LLPS phase diagrams determined as in (c) but for double mutant DBDE476D/R501A with DNAs. e Fluorescence images of HEK 293T cells expressing KLF4-mTurq (left), KLF4R501A-mTurq (middle) and KLF4E476D/R501A-mTurq (right). Bottom row shows close-ups of single cells with the same mean fluorescence (~5000 AU). Similar results were obtained for 2 biological replicates. f HEK 293T cells expressing KLF4-mTurq variants classified as diffuse (gray, left) or punctate (red) are plotted by mean fluorescence intensity; the long horizontal bars mark the median, and the top and bottom bars on the vertical lines denote the 90-10 percentiles. Wildtype “diffuse” cells show lower fluorescence than those cells expressing KLF4R501A-mTurq or KLF4E476D/R501A-mTurq (n = 112 diffuse cells for each fusion across 2 biological replicates). Cells with at least 5 distinct puncta (0.5 µm spots with intensity center >1500 arbitrary units, determined using Imaris software) were classified as punctate. Statistical tests were performed using a two-sided Student’s paired t-test. Y-axis limit was set to 30,000 for visualization purposes. Fields that yielded 112 diffuse cells also gave punctate cell counts of 209 (WT), 39 (KLF4R501A-mTurq) and 64 (KLF4E476D/R501A-mTurq) across 2 biological replicates.
Fig. 6
Fig. 6. KLF4 condensates recruit TFs and form at low concentrations with long DNAs.
a Fluorescence microscopy images of HEK 293T cells expressing OCT4-mCherry (left) or SOX2-mCherry (right). Some SOX2-mCherry distributions suggest mitotic bookmarking (white arrow). b Fluorescence microscopy images of HEK 293T cells. Screening ~1000 cells from 2 transfection replicates identified 73 cells that co-express OCT4-mCherry and KLF4-mTurq; all 73 show tags colocalized to droplets (examples top and bottom). c Fluorescence microscopy images of HEK 293T cells. Screening ~1000 cells from 2 transfection replicates identified 39 cells that co-express SOX2-mCherry and KLF4-mTurq; 29 cells show tags colocalized to droplets (example, top row) and 10 cells do not (example, bottom row). d Fluorescence microscopy images of 1.5 µM NANK DNA with 100 nM YOYO-1 and 50 nM OCT4-AF647 (top) or 70 nM SOX2-AF647 (bottom) without (left column) or with (right three columns) 9 µM DBD. Similar results were obtained for 2 replicates. e Fluorescence microscopy images of polynucleosomes (green; 20 ng DNA/µl, Active Motif, Inc., visualized with 100 nM YOYO-1) with 10 µM DBD (red; trace labeled 1:100 with DBD-AF594). Similar results were obtained for 2 replicates. f Fluorescence microscopy images of polynucleosomes (green; 11 ng DNA/µl, visualized with 100 nM YOYO-1) with OCT4-AF647 (50 nM; purple, top row) or SOX2-AF647 (70 nM; purple, bottom row) alone (left) or with 1 µM DBD (three right panels). Similar results were obtained for 2 replicates. g Longer DNAs undergo LLPS with DBD at low concentrations. Fluorescence images of DBD with 30 bp NANK, 404 bp NP (NANOG promoter), 7.4 kbp NPE (NANOG promoter enhancer) and 5 kbp plasmid DNA in nucleosomes (left to right panels, respectively). Conditions: DBD (250 nM) mixed with different DNA (mass equivalent of 0.6 ng/µl; 32 nM NANK or 2.5 nM NP or 140 pM NPE or 210 pM plasmid DNA concentration in nucleosomes) in TS buffer with 100 nM YOYO-1. Similar results were obtained for 2 replicates.
Fig. 7
Fig. 7. KLF4:DNA condensation as an organizer of chromatin.
a KLF4 levels rise early in reprogramming, leading to KLF4 biomolecular condensation. bg Proposed roles for KLF4:DNA condensates in chromatin reorganization during reprogramming. b Pluripotency-related sites in closed chromatin of somatic cells lack KLF4. c Sites will recruit KLF4 and form local KLF4:DNA condensates as expression levels rise. d Random diffusive encounters of cis-acting elements leads to fusion of their condensates and persistent colocalization. e Loci on different chromosomes can also be co-localized in KLF4:DNA condensates. f, g Within the condensate, KLF4 makes DNA bridging contacts at cognate 9 bp KLF4 sites (yellow), especially where such sites overlap, but perhaps also at 6 bp partial sites or non-cognate sites. The KLF4:DNA condensate enriches TFs relative to solution, helping to saturate binding sites for TFs OCT4 and SOX2 and to recruit co-activators such as CBP/p300 to activate NANOG expression and gain access to pluripotency.

References

    1. Takahashi K, et al. Induction of pluripotent stem cells from adult human fibroblasts by defined factors. Cell. 2007;131:861–872. doi: 10.1016/j.cell.2007.11.019. - DOI - PubMed
    1. Takahashi K, Yamanaka S. Induction of pluripotent stem cells from mouse embryonic and adult fibroblast cultures by defined factors. Cell. 2006;126:663–676. doi: 10.1016/j.cell.2006.07.024. - DOI - PubMed
    1. Schmidt R, Plath K. The roles of the reprogramming factors Oct4, Sox2 and Klf4 in resetting the somatic cell epigenome during induced pluripotent stem cell generation. Genome Biol. 2012;13:251. doi: 10.1186/gb-2012-13-10-251. - DOI - PMC - PubMed
    1. Beers J, et al. A cost-effective and efficient reprogramming platform for large-scale production of integration-free human induced pluripotent stem cells in chemically defined culture. Sci. Rep. 2015;5:11319. doi: 10.1038/srep11319. - DOI - PMC - PubMed
    1. Chronis C, et al. Cooperative binding of transcription factors orchestrates reprogramming. Cell. 2017;168:442–459 e420. doi: 10.1016/j.cell.2016.12.016. - DOI - PMC - PubMed

Publication types

MeSH terms