. 2021 Sep 22;12(1):5469.
doi: 10.1038/s41467-021-25480-z.

A potent SARS-CoV-2 neutralising nanobody shows therapeutic efficacy in the Syrian golden hamster model of COVID-19

Affiliations

A potent SARS-CoV-2 neutralising nanobody shows therapeutic efficacy in the Syrian golden hamster model of COVID-19

Jiandong Huo et al. Nat Commun. .

Abstract

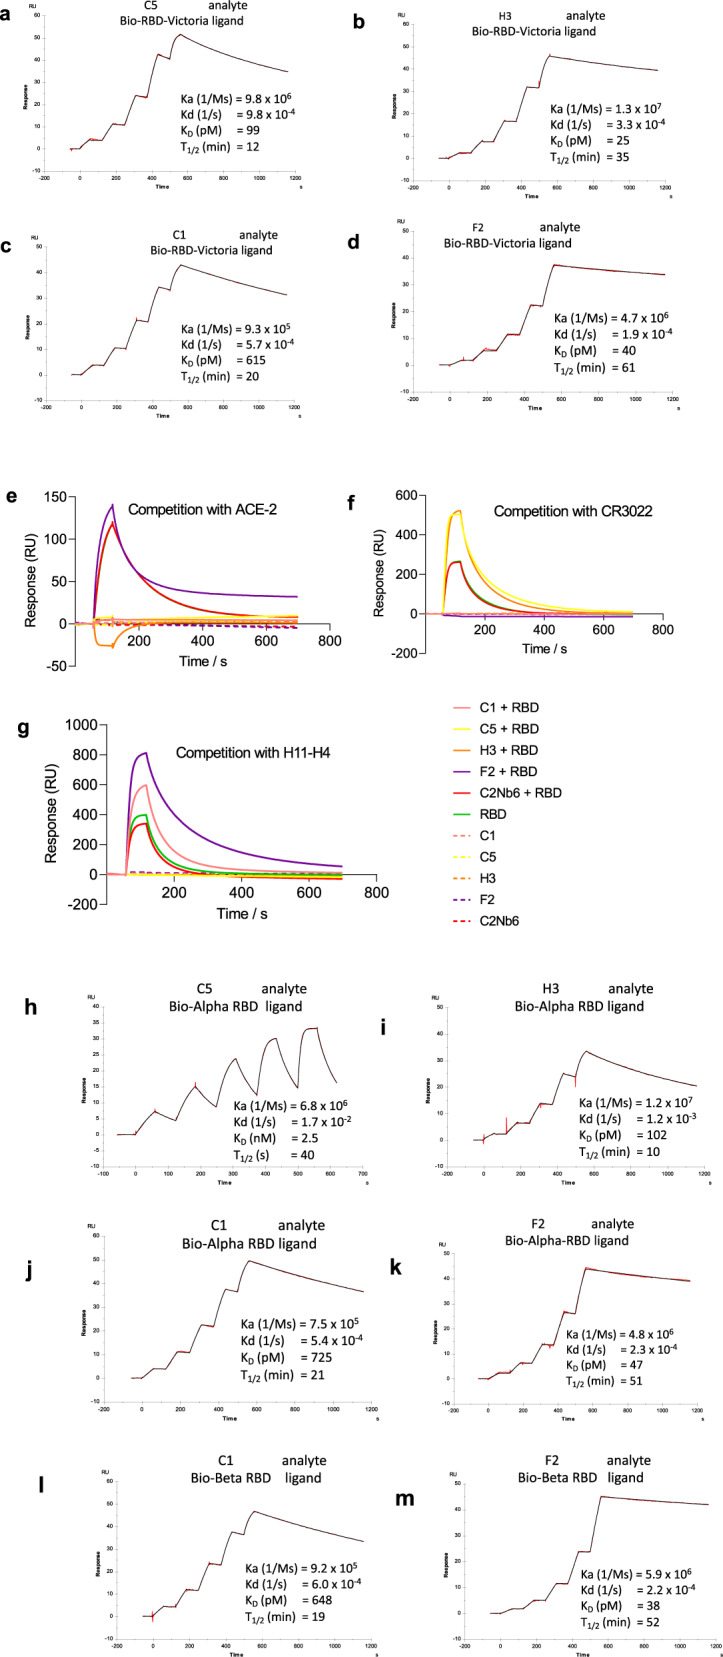
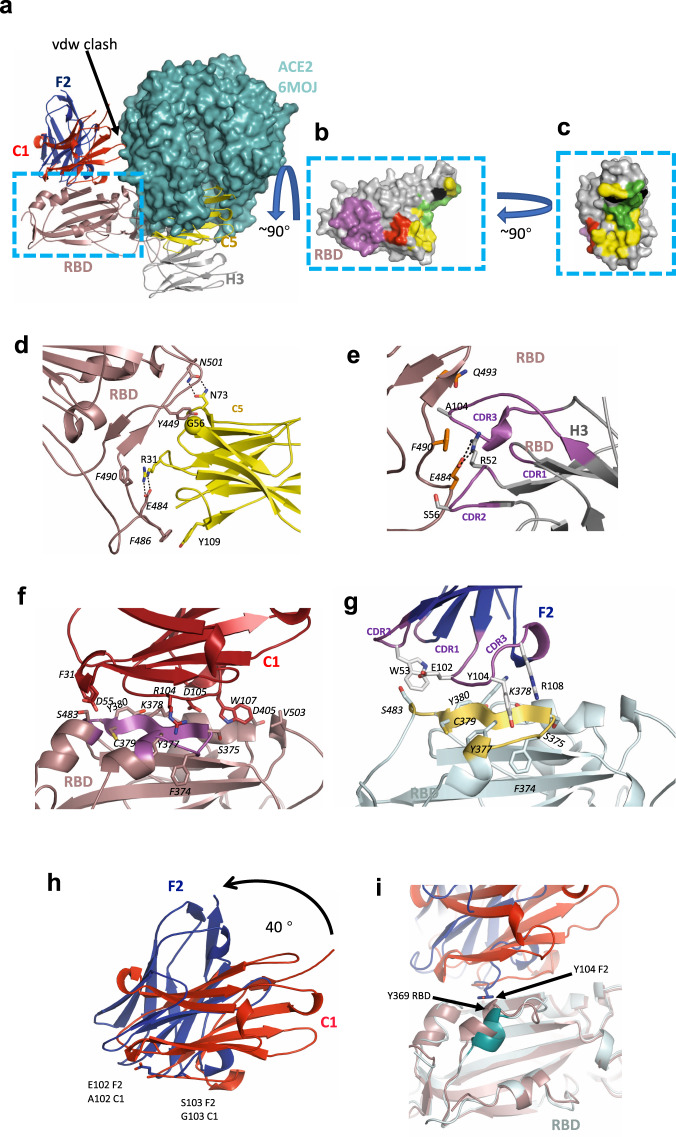
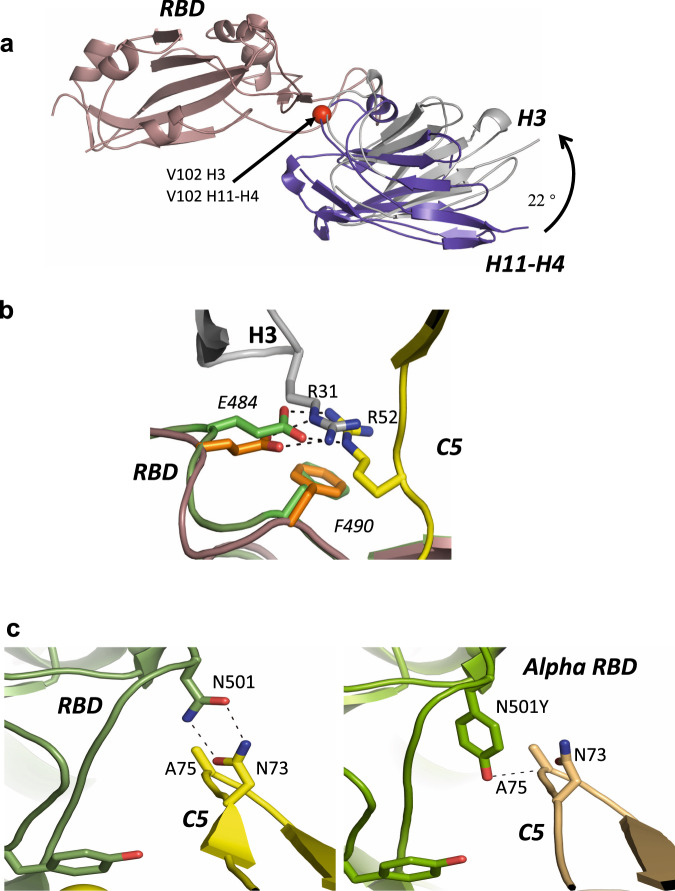
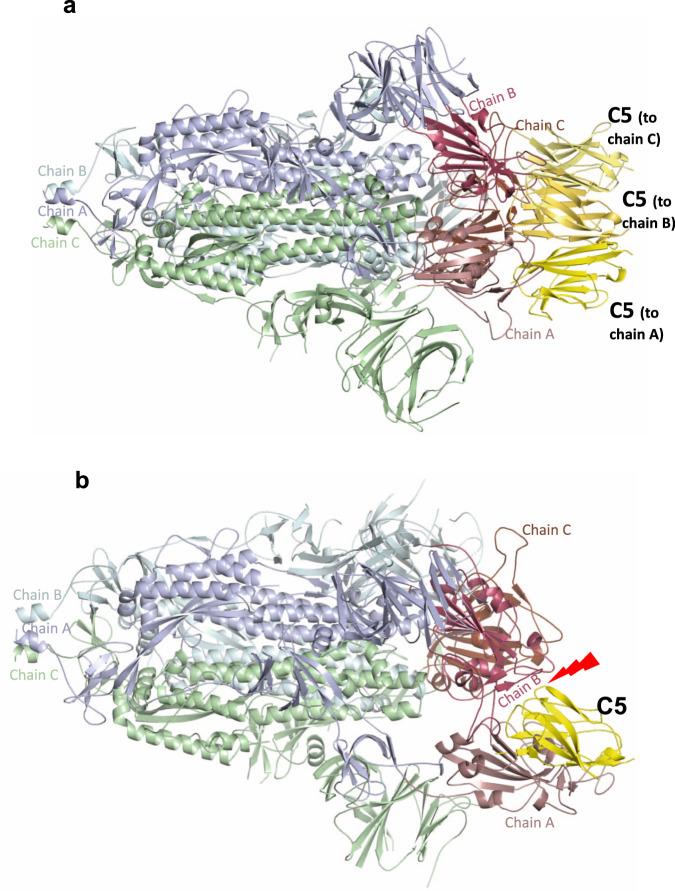
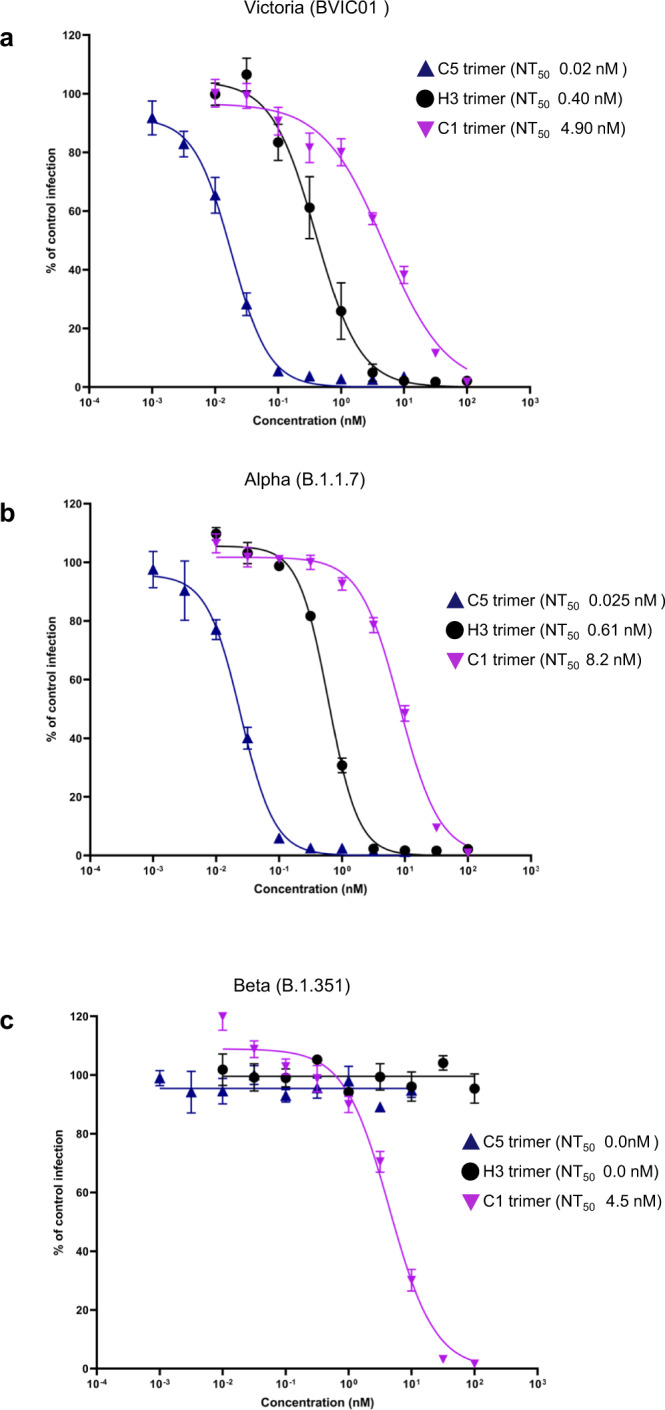
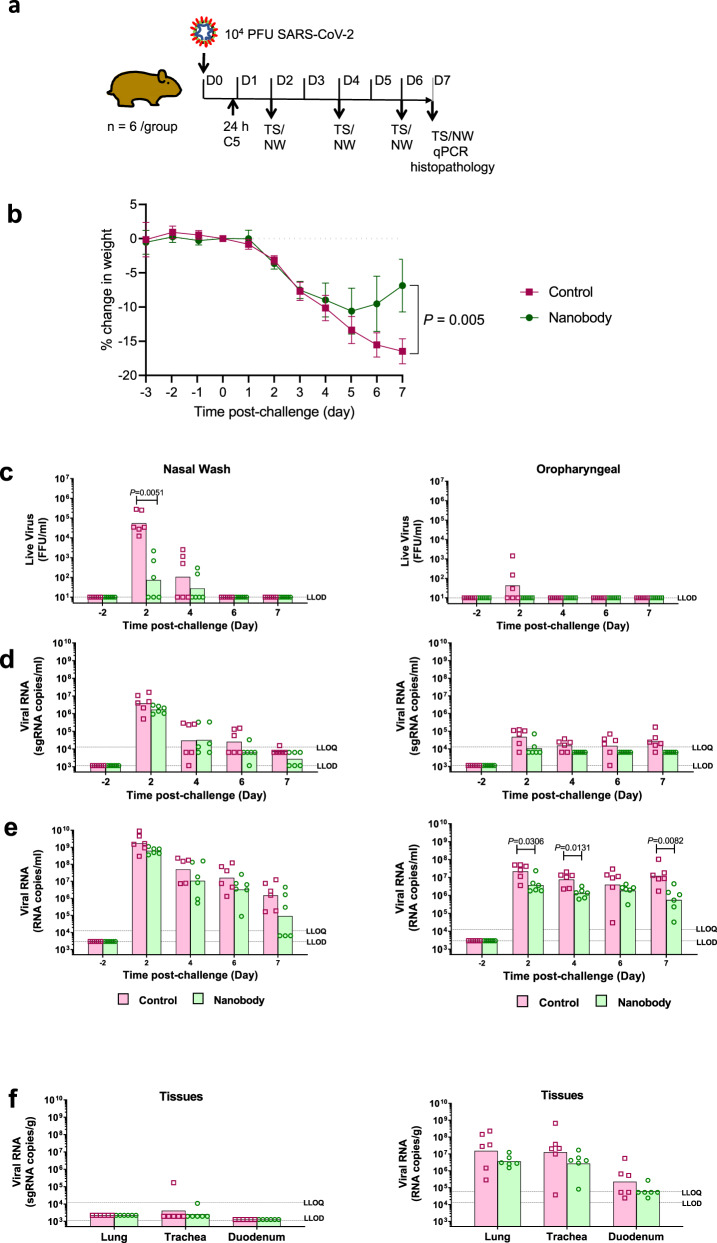
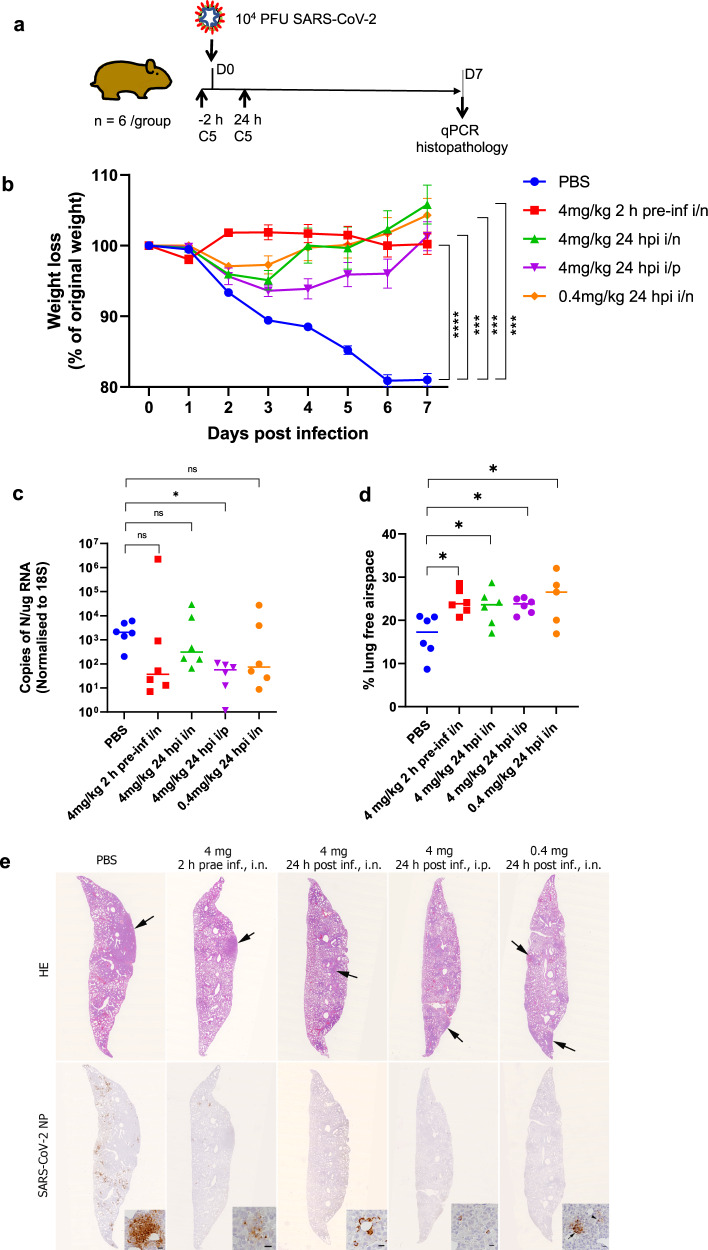
SARS-CoV-2 remains a global threat to human health particularly as escape mutants emerge. There is an unmet need for effective treatments against COVID-19 for which neutralizing single domain antibodies (nanobodies) have significant potential. Their small size and stability mean that nanobodies are compatible with respiratory administration. We report four nanobodies (C5, H3, C1, F2) engineered as homotrimers with pmolar affinity for the receptor binding domain (RBD) of the SARS-CoV-2 spike protein. Crystal structures show C5 and H3 overlap the ACE2 epitope, whilst C1 and F2 bind to a different epitope. Cryo Electron Microscopy shows C5 binding results in an all down arrangement of the Spike protein. C1, H3 and C5 all neutralize the Victoria strain, and the highly transmissible Alpha (B.1.1.7 first identified in Kent, UK) strain and C1 also neutralizes the Beta (B.1.35, first identified in South Africa). Administration of C5-trimer via the respiratory route showed potent therapeutic efficacy in the Syrian hamster model of COVID-19 and separately, effective prophylaxis. The molecule was similarly potent by intraperitoneal injection.


Conflict of interest statement

The Rosalind Franklin Institute has filed a patent that includes the four nanobodies described here, R.J.O., J.H. and J.H.N. are named as inventors. The other authors declare no competing interests.

Figures

Fig. 1
Fig. 1. Nanobody binding kinetics.
ad SPR sensorgrams showing binding kinetics of nanobody C5, H3, C1 and F2 for RBD Victoria (immobilised as biotinylated RBD on the chip), eg SPR sensorgrams of competition assays between RBD and C5, H3, C1, F2 for binding to e ACE-2, f CR3022 and g H11-H4, with all ligands immobilised as Fc fusion proteins and C2Nb6 (an anti-Caspr2 nanobody) used as a negative control, hk binding kinetics of nanobody C5, H3, C1 and F2 to Alpha RBD (l, m) C1 and F2 binding to Beta RBD (immobilised as biotinylated RBD on the chip).
Fig. 2
Fig. 2. Crystal structures of nanobody-RBD complexes.
a The four nanobodies of this study are shown in cartoon and labelled. The figure was generated by superimposing the RBD protein from each crystal structure, only one RBD monomer is shown. Also shown is ACE2 (cyan surface) from the RBD ACE2 complex (PDB 6M0J), positioned by superposition of the RBD. Nanobodies C5 and H3 compete with ACE2 for binding to RBD. F2 and C1 bind to a different epitope, although a loop of C1 (G42) would clash with ACE2 (arrow). b RBD is shown as a surface, the RBD molecule has been rotated by 90° relative to a. The surface is coloured magenta corresponds to the epitope engaged by both C1 and F2, in red is the additional region recognised by C1 only. In yellow is the epitope recognised by C3 only, in black by H3 only and in green by both C5 and H3. c The same molecule and colour scheme as b but rotated by 90° to more clearly show the H3 and C5 epitopes. The key molecular interactions between d C5, e H3, f C1, and g F2 and RBD are identified and labelled. RBD is in approximately in the same orientation as a. In f and g coloured in magenta and gold respectively is the portion of RBD that is also recognised by both C1 and F2. h C1 and F2 bind to RBD in different orientations and overlap at residues 102 and 103. Their spatial relationship can be described as an approximate 40° rotation around the main chain at 102 and 103. i In the F2 (blue) RBD (cyan) complex, Y102 of F2 results in a displacement of the helix at Y369 of RDB relative to the C1 (red) and RBD (brown) complex. The orientation of the molecules are the same as shown in Fig. 2a. All structural figures were prepared using PyMOL (http://www.pymol.org/).
Fig. 3
Fig. 3. Comparison of nanobody-RBD complexes.
a Superimposition of H11-H4-RBD and H3-RBD complexes; V102 is shown by a red sphere. b Overlay showing the key salt bridge interaction between E484 in RBD and R31 in nanobody H3 and R52 in nanobody C5, respectively. c Close-up of the RBD-C5 interfaces for complexes with the Victoria strain of SARS-CoV-2 (N501: left hand side) and Alpha strain (N501Y: right hand side) showing the hydrogen bonding between N501 and Y501 of RBD (coloured green) with N73 of C5 in yellow and wheat respectively. Key residues are shown in stick representations.
Fig. 4
Fig. 4. Cryo-EM structure of C5-Spike complex.
a EM structure of spike (S1) trimer with each of three chains bound to one C5 nanobody coloured yellow. The other spike monomers are coloured pale cyan, green and purple wheat and throughout and show that all three RDBs are in the down conformation. b Superimposition of C5 onto the spike protein in the two down one up conformation shows that there would be significant clashes that would prevent this interaction.
Fig. 5
Fig. 5. Neutralisation of SARS-CoV-2 strains in vitro.
Neutralisation curves of the anti-RBD nanobody trimers for a Victoria (BVIC01), b Alpha, (B1.1.7) and c Beta, (B1.351) strains of SARS-CoV-2 measured in a microneutralisation assay. Data are shown as the mean (n = 4) ± 95% CI.
Fig. 6
Fig. 6. C5-Fc neutralisation of SARS-CoV-2 in the Syrian hamster model.
a Golden Syrian hamsters (n = 6 biologically independent animals per group) were challenged with SARS-CoV-2 (B Victoria 5 × 104 pfu) at day 0 and then treated with either C5-Fc (IP 4 mg/kg) or PBS, delivered by the intraperitoneal route 24 h post-challenge and Throat Swab (TS) and Nasal Wash (NS) samples collected on days 2, 4, 6 and 7 post virus challenge. b Body weight was recorded daily and the mean percentage weight change from baseline was plotted (mean ± 1 SE). Filled in square represents data from control animals (virus only) and filled in circles represents data from nanobody treated. Nasal washes (i–iii) and oropharyngeal swabs (iv–vi) were collected at days −2 to 2, 4, 6 and 7 pc for all virus challenged groups. Tissue samples (lung, trachea and duodenum) were collected at post-mortem (day 7 pc) (vii & viii). Open square represents data from control animals (virus only) and open circle represents data from nanobody-treated hamsters. Symbols show values for individual animals, columns represent the calculated group geometric means. c Quantitation of live virus in the nasal wash and oropharyngeal swabs using a micro-foci assay. d Number of copies of subgenomic (sg)viral RNA in the nasal wash and oropharyngeal swab. e Number of copies genomic viral RNA in the nasal wash oropharyngeal swab. f Number of copies of sgRNA and genomic RNA in tissues. The dashed horizontal lines show the lower limit of quantification (LLOQ) and the lower limit of detection (LLOD). The statistical test used was a Mann–Whitney’s U test, two-sided, using Minitab v 16.
Fig. 7
Fig. 7. Therapeutic efficacy of C5 Trimer in Syrian hamster model.
a Golden Syrian hamsters (n = 6 biologically independent animals per group) were infected intranasally with SARS-CoV-2 strain LIV (PANGO lineage B; 104 pfu). Individual cohorts were treated either 2 h pre-infection or 24 h post-infection (hpi) with 100 μl of C5 either intranasally (IN) or intraperitoneally (IP) as indicated or sham-infected with PBS. b Animals were monitored for weight loss at indicated time-points. Data are the mean value (n = 6) ± SEM. Comparisons were made using a repeated-measures two-way ANOVA with Geisser-Greenhouse’s correction and Šídák’s multiple comparisons test; at day 7: PBS vs. 4 mg/kg 2 h pre-inf i/n; ****P < 0.0001, PBS vs. 4 mg/kg 24 hpi i/n; ***P = 0.0005, PBS vs. 4 mg/kg 24 hpi i/p; ***P = 0.0002, PBS vs. 0.4 mg/kg 24 hpi i/n; ***P = 0.0003. c RNA extracted from lungs was analysed for SARS-CoV-2 viral load using qRT-PCR for the N gene levels by qRT-PCR. Assays were normalised relative to levels of 18S RNA. Data for individual animals are shown with the median value represented by a horizontal line. Data are mean value (n = 6) ±SEM and were analysed using a Kruskal–Wallis one-way ANOVA with Dunn’s multiple comparisons test; PBS vs. 4 mg/kg 2 h pre-inf i/n; P = 0.1682 (ns), PBS vs. 4 mg/kg 24 hpi i/n; P > 0.9999 (ns), PBS vs. 4 mg/kg 24 hpi i/p; *P = 0.0287, PBS vs. 0.4 mg/kg 24 hpi i/n; P = 0.4044 (ns). d Morphometric analysis of HE-stained sections scanned and analysed using the software programme Visiopharm to quantify the area of non-aerated parenchyma and aerated parenchyma in relation to the total area. Results are expressed as the mean free airspace in lung sections. Data are mean value (n = 6) ±SEM and were analysed using a one-way ANOVA with Dunnett’s multiple comparisons test; PBS vs. 4 mg/kg 2 h pre-inf i/n; *P = 0.0109, PBS vs. 4 mg/kg 24 hpi i/n; *P = 0.0406, PBS vs. 4 mg/kg 24 hpi i/p; *P = 0.0270, PBS vs. 0.4 mg/kg 24 hpi i/n; *P = 0.0110. e Lung sections of hamsters, infected intranasally with 104 PFU/100 μl SARS-CoV-2 and euthanized at day 7 post infection. Animals had been untreated prior to infection (PBS) or treated with 4 mg/kg C5 IN 2 h prae infection (h prae inf) or 24 h post infection (h post inf) or IP at 24 h post inf, or had received 0.4 mg/kg C5 IN at 24 h post inf. In the untreated animal (PBS) the lung parenchyma exhibits a large consolidated area (arrow) and multifocal patches with extensive viral antigen expression in particular by pneumocytes. In treated animals there are only a few small areas of consolidation (arrows). The animal treated with 4 mg/kg C5 intranasally at 2 h prae inf exhibits a few small patches with viral antigen expression mainly in degenerate cells, all other treated animals show viral antigen expression in occasional individual macrophages within small infiltrates or in pneumocytes in individual alveoli. Top: HE stain, bottom: immunohistology for SARS-CoV-2 N, hematoxylin counterstain. Bars = 20 µm (PBS) or 10 µm (all others). Images are representative n = 6 biologically independent samples.

References

    1. Dhama, K. et al. Coronavirus disease 2019-COVID-19. Clin. Microbiol. Rev.10.1128/CMR.00028-20 (2020). - PMC - PubMed
    1. Zost SJ, et al. Potently neutralizing and protective human antibodies against SARS-CoV-2. Nature. 2020;584:443–449. doi: 10.1038/s41586-020-2548-6. - DOI - PMC - PubMed
    1. Liu L, et al. Potent neutralizing antibodies against multiple epitopes on SARS-CoV-2 spike. Nature. 2020;584:450–456. doi: 10.1038/s41586-020-2571-7. - DOI - PubMed
    1. Ju B, et al. Human neutralizing antibodies elicited by SARS-CoV-2 infection. Nature. 2020;584:115–119. doi: 10.1038/s41586-020-2380-z. - DOI - PubMed
    1. Cao Y, et al. Potent neutralizing antibodies against SARS-CoV-2 identified by high-throughput single-cell sequencing of convalescent patients’ B cells. Cell. 2020;182:73–84 e16. doi: 10.1016/j.cell.2020.05.025. - DOI - PMC - PubMed

Publication types

MeSH terms