Randomized Controlled Trial
. 2021 Sep 22;11(1):18793.
doi: 10.1038/s41598-021-97890-4.

Probiotics maintain the gut microbiome homeostasis during Indian Antarctic expedition by ship

Affiliations
Randomized Controlled Trial

Probiotics maintain the gut microbiome homeostasis during Indian Antarctic expedition by ship

Ashish Kumar Srivastava et al. Sci Rep. .

Abstract

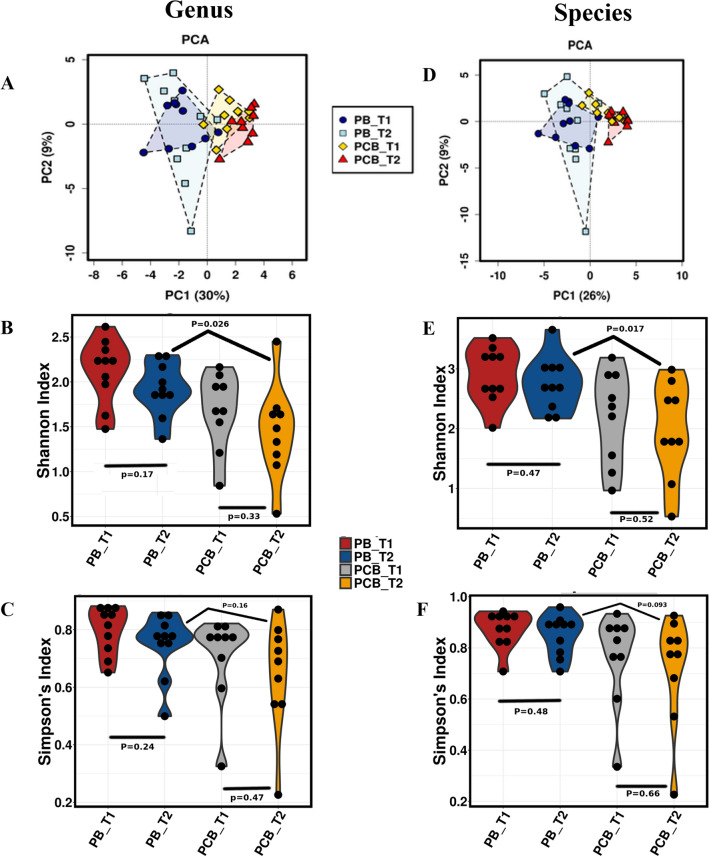
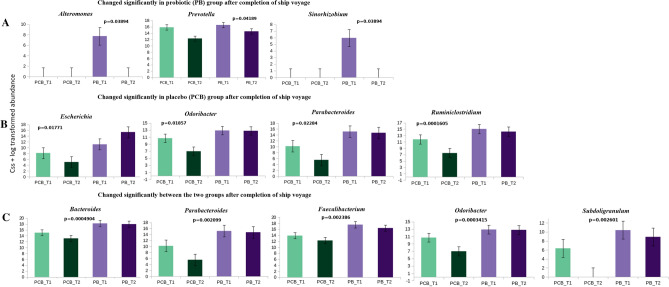
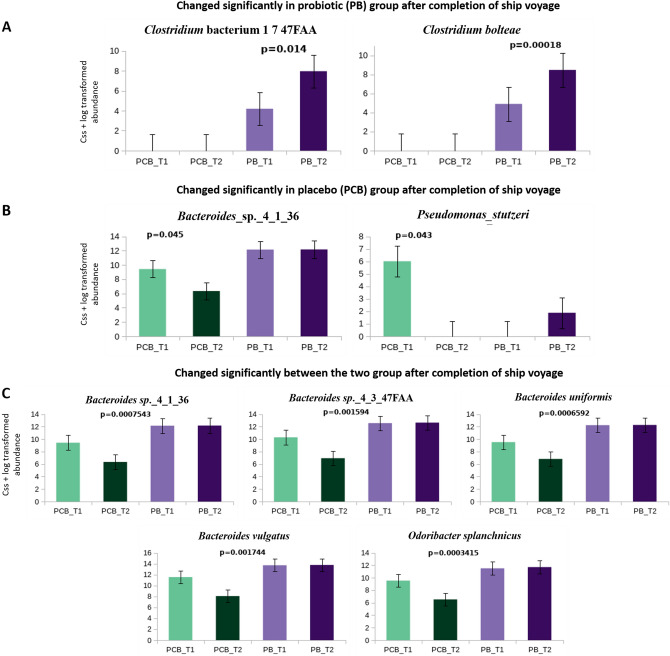
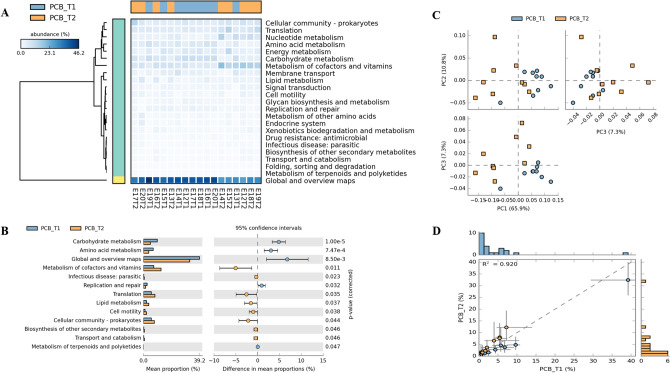
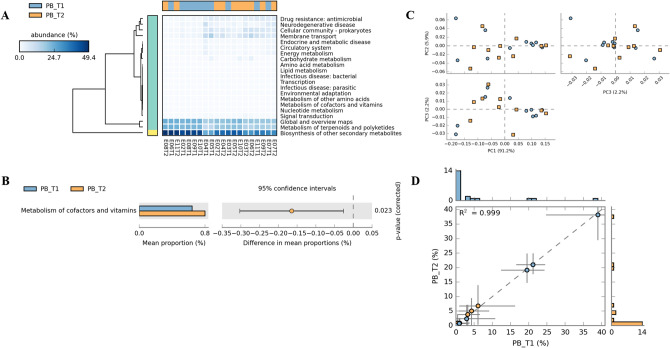
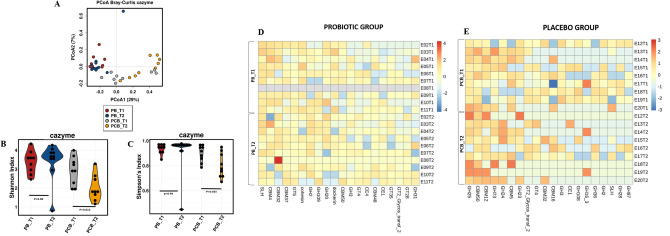
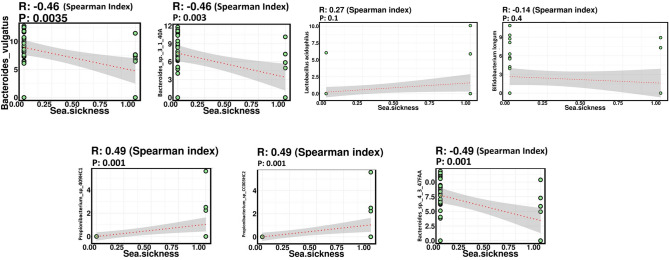
Ship voyage to Antarctica is a stressful journey for expedition members. The response of human gut microbiota to ship voyage and a feasible approach to maintain gut health, is still unexplored. The present findings describe a 24-day long longitudinal study involving 19 members from 38th Indian Antarctic Expedition, to investigate the impact of ship voyage and effect of probiotic intervention on gut microbiota. Fecal samples collected on day 0 as baseline and at the end of ship voyage (day 24), were analyzed using whole genome shotgun sequencing. Probiotic intervention reduced the sea sickness by 10% compared to 44% in placebo group. The gut microbiome in placebo group members on day 0 and day 24, indicated significant alteration compared to a marginal change in the microbial composition in probiotic group. Functional analysis revealed significant alterations in carbohydrate and amino acid metabolism. Carbohydrate-active enzymes analysis represented functional genes involved in glycoside hydrolases, glycosyltransferases and carbohydrate binding modules, for maintaining gut microbiome homeostasis. Suggesting thereby the possible mechanism of probiotic in stabilizing and restoring gut microflora during stressful ship journey. The present study is first of its kind, providing a feasible approach for protecting gut health during Antarctic expedition involving ship voyage.


Conflict of interest statement

The authors declare no competing interests.

Figures

Figure 1
Figure 1
The impacts of a stressful ship voyage on the gut microbiota of expedition members. A, D - PCA of the gut microbiome in the  PCB and PB group between baseline (day 0) and after the completion of ship voyage (day 24) at genus and species level. B, E - Shannon index represented microbial alpha diversity of gut microbiome, within the groups and between the groups after the completion of ship voyage. Significant p-value (p < 0.05) was observed between PCB_T2 and PB_T2 at both genus and species level.  C, F - Simpson’s index represented microbial alpha diversity of gut microbiome, within the groups and between the groups after the completion of ship voyage. p-value < 0.05 was considered statistically significant.
Figure 2
Figure 2
Taxonomic composition (css + log transformed) at genus level. A - At baseline, the genus did not have a significant difference between PCB and PB groups, but changed significantly in the PB group at the end of ship voyage. B - The genus changed significantly only in PCB group during the ship voyage. C - The genus abundance changed significantly between PCB and PB groups after completion of the ship voyage (PCB_T2 and PB_T2). p-value < 0.05 was considered to be statistically significant (Wilcoxon rank-sum tests) using in-house R-script. Error bar represent standard error mean (SEM).
Figure 3
Figure 3
Taxonomic composition (css + log transformed) at species level. A - At baseline, the species did not have a significant difference between PCB and PB groups, but changed significantly in PB group at the end of ship voyage. B - The species changed significantly only in PCB group during the ship voyage. C - The species abundance changed significantly between PCB and PB groups after completion of the ship voyage (PCB_T2 and PB_T2). p-value < 0.05 was considered to be statistically significant (Wilcoxon rank-sum tests) using in-house R-script. Error bar represents standard error mean (SEM).
Figure 4
Figure 4
Metagenomic profile comparisons of metabolic pathways associated with PCB group members determined using STAMP analysis (Level-2). A - Expression of all altered pathways. B - Positive differences between proportions denote greater abundances in the PCB_T1 timepoint (blue), whereas negative differences between proportions show greater abundances in the PCB_T2 timepoint (orange) for the given pathways. Corrected p-values were calculated based on two-sided Welch’s t-test no correction and Welch’s inverted CI method. Difference with a p-value of < 0.05 were considered to be significant. C - PCA plot determined from the proportion of reads assigned to each pathway within a sample. D - Profile scatter plot with histograms showing the proportion of genes and functional profile, relative to all assigned genes, within the PCB group at both the time points.
Figure 5
Figure 5
Metagenomic profile comparisons of metabolic pathways associated with PB group members determined using STAMP analysis (Level-2). A - Expression of all altered pathways. B - Positive differences between proportions denote greater abundances in the PB_T1 timepoint (blue), whereas negative differences between proportions show greater abundances in the PB_T2 timepoint (orange) for the given pathways. Corrected p-values were calculated based on two-sided Welch’s t-test no correction and Welch’s inverted CI method. Difference with a p-value of < 0.05 were considered to be significant. C - PCA plot determined from the proportion of reads assigned to each pathway within a sample.  D - Profile scatter plot with histograms showing the proportion of genes and functional profile, relative to all assigned genes, within the PB group at both the time points.
Figure 6
Figure 6
Alterations of the gut microbial CAZy genes during the stressful ship voyage. A - The Bray–Curtis distance-based gut microbial CAZy gene profile of members during the ship voyage. The points in different colors represent the intestinal microbial structure of the subjects in each group. B, C - The alpha diversity, including Shannon and Simpson indexes, of the gut microbial CAZy genes of expedition members both in PCB and PB groups at baseline and at the end of the ship voyage. Significant change was observed between PCB_T1 and PCB_T2 (p < 0.05).  D, E - The heatmap showing css + log transcformed abundance of top 20 abundant CAZy gene families, including glycoside hydrolases (GH) and carbohydrate binding moiety (CBM) in PCB group and PB group during the ship voyage. CAZy genes were filtered at E-value < 1e–18 and coverage > 0.35 for all bacteria using dbCAN HMMdb.
Figure 7
Figure 7
Spearman correlations indicate significant (positive and negative) relationships between microbial species and sea sickness. r: Spearman's correlation coefficient. Species of genus Propionibacterium (r = 0.49, p = 0.001) show strong positive correlation while that of genus Bacteroides (r = − 0.49 and − 0.46, p = 0.001 and 0.003) show negative correlation with sea-sickness. Lactobacillus acidophilus was positively correlated (r = 0.27, p = 0.1) and Bifidobacterium longum was negatively correlated (r = − 0.14, p = 0.4). p-value < 0.05 was considered statistically significant.

References

    1. Rydstedt LW, Lundh M. An ocean of stress? The relationship between psychosocial workload and mental strain among engine officers in the Swedish merchant fleet. Int. Marit. Health. 2010;62(3):168–175. - PubMed
    1. Ehara M, Muramatsu S, Sano Y, Takeda S, Hisamune S. The tendency of diseases among seamen during the last fifteen years in Japan. Ind. Health. 2006;44(1):155–160. doi: 10.2486/indhealth.44.155. - DOI - PubMed
    1. Oldenburg M, Harth V, Jensen HJ. Overview and prospect: food and nutrition of seafarers on merchant ships. Int. Marit. Health. 2013;64(4):191–194. doi: 10.5603/IMH.2013.0003. - DOI - PubMed
    1. Bhushan B, Yadav AP, Singh SB, Ganju L. Diversity and functional analysis of salivary microflora of Indian Antarctic expeditionaries. J. Oral Microbiol. 2019;11(1):1581513. doi: 10.1080/20002297.2019.1581513. - DOI - PMC - PubMed
    1. Pagel JI, Choukèr A. Effects of isolation and confinement on humans-implications for manned space explorations. J. Appl. Physiol. 2016;120:1449–1457. doi: 10.1152/japplphysiol.00928.2015. - DOI - PubMed

Publication types