. 2021 Sep;597(7878):693-697.
doi: 10.1038/s41586-021-03933-1. Epub 2021 Sep 22.

Genetic and epigenetic coordination of cortical interneuron development

Affiliations

Genetic and epigenetic coordination of cortical interneuron development

Kathryn C Allaway et al. Nature. 2021 Sep.

Abstract

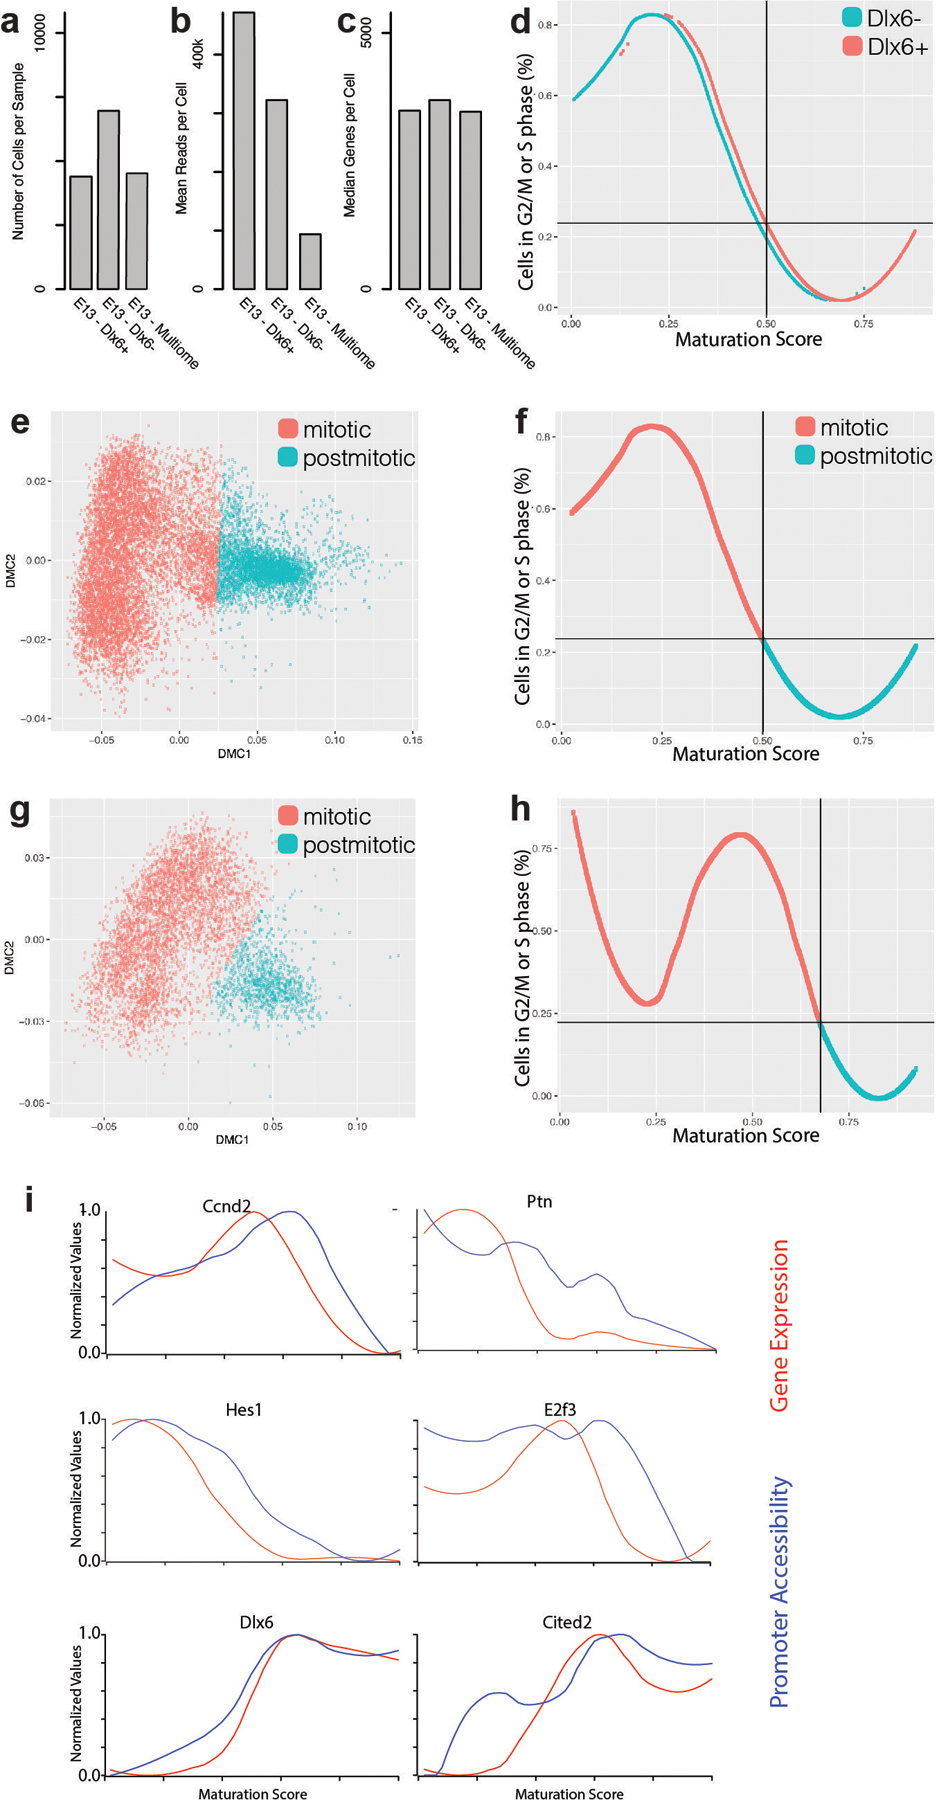
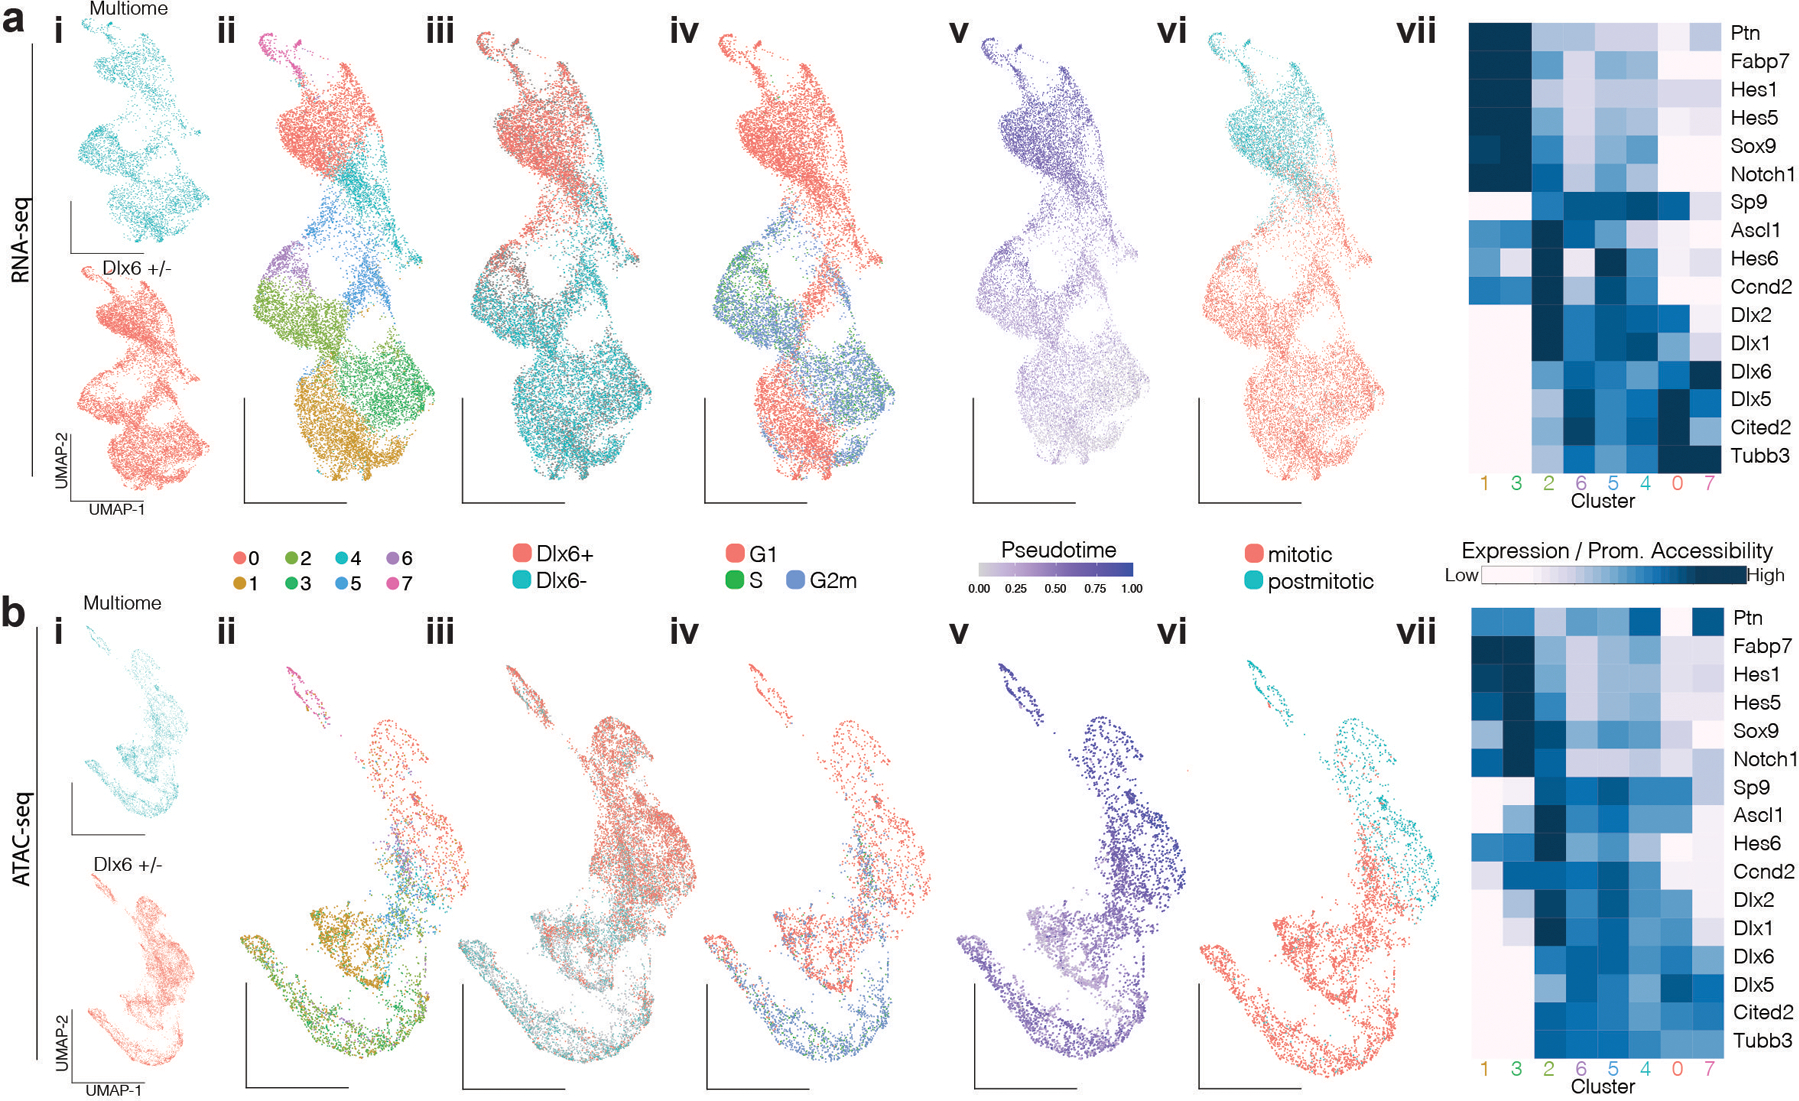
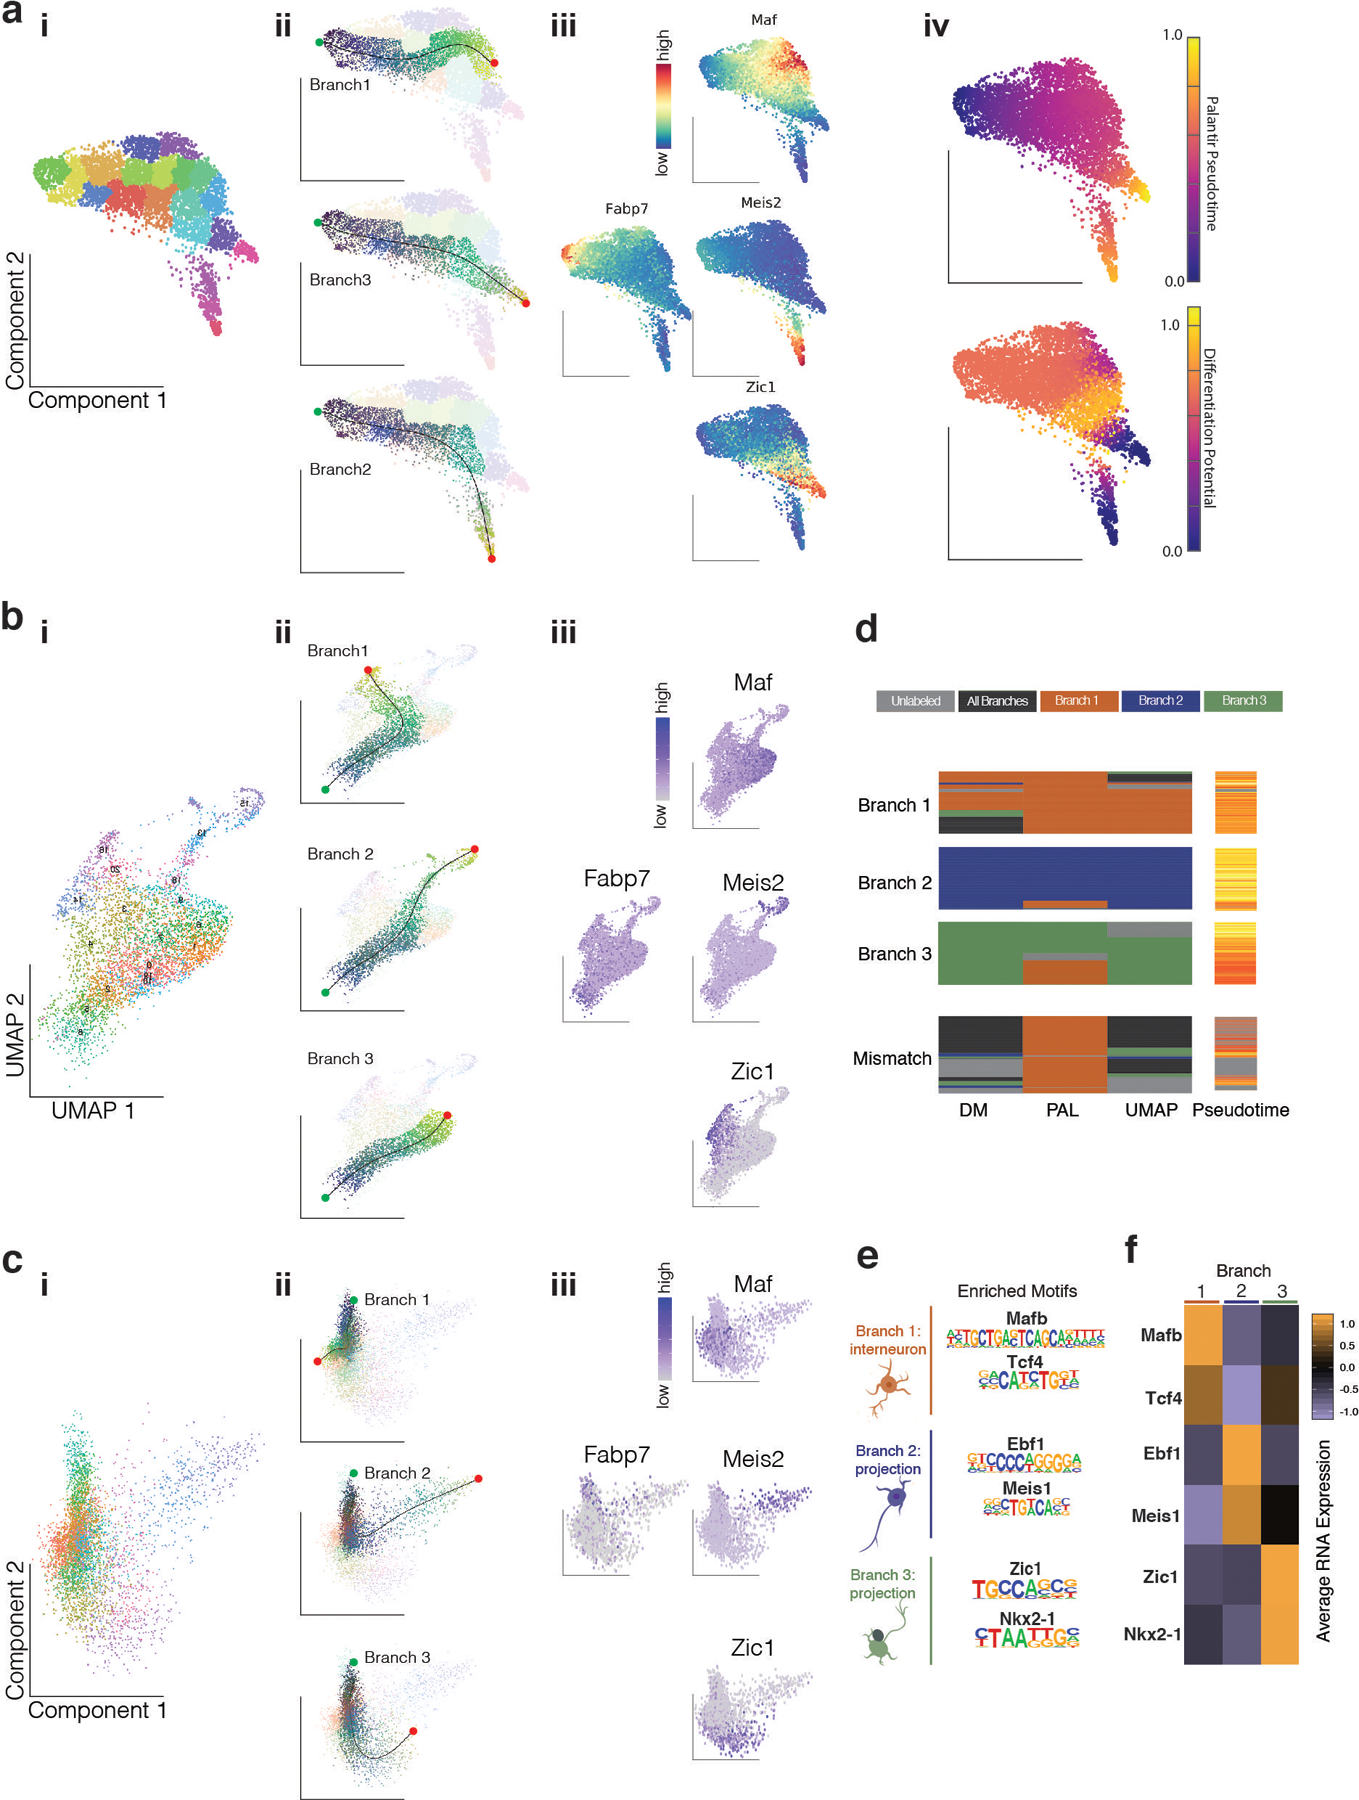
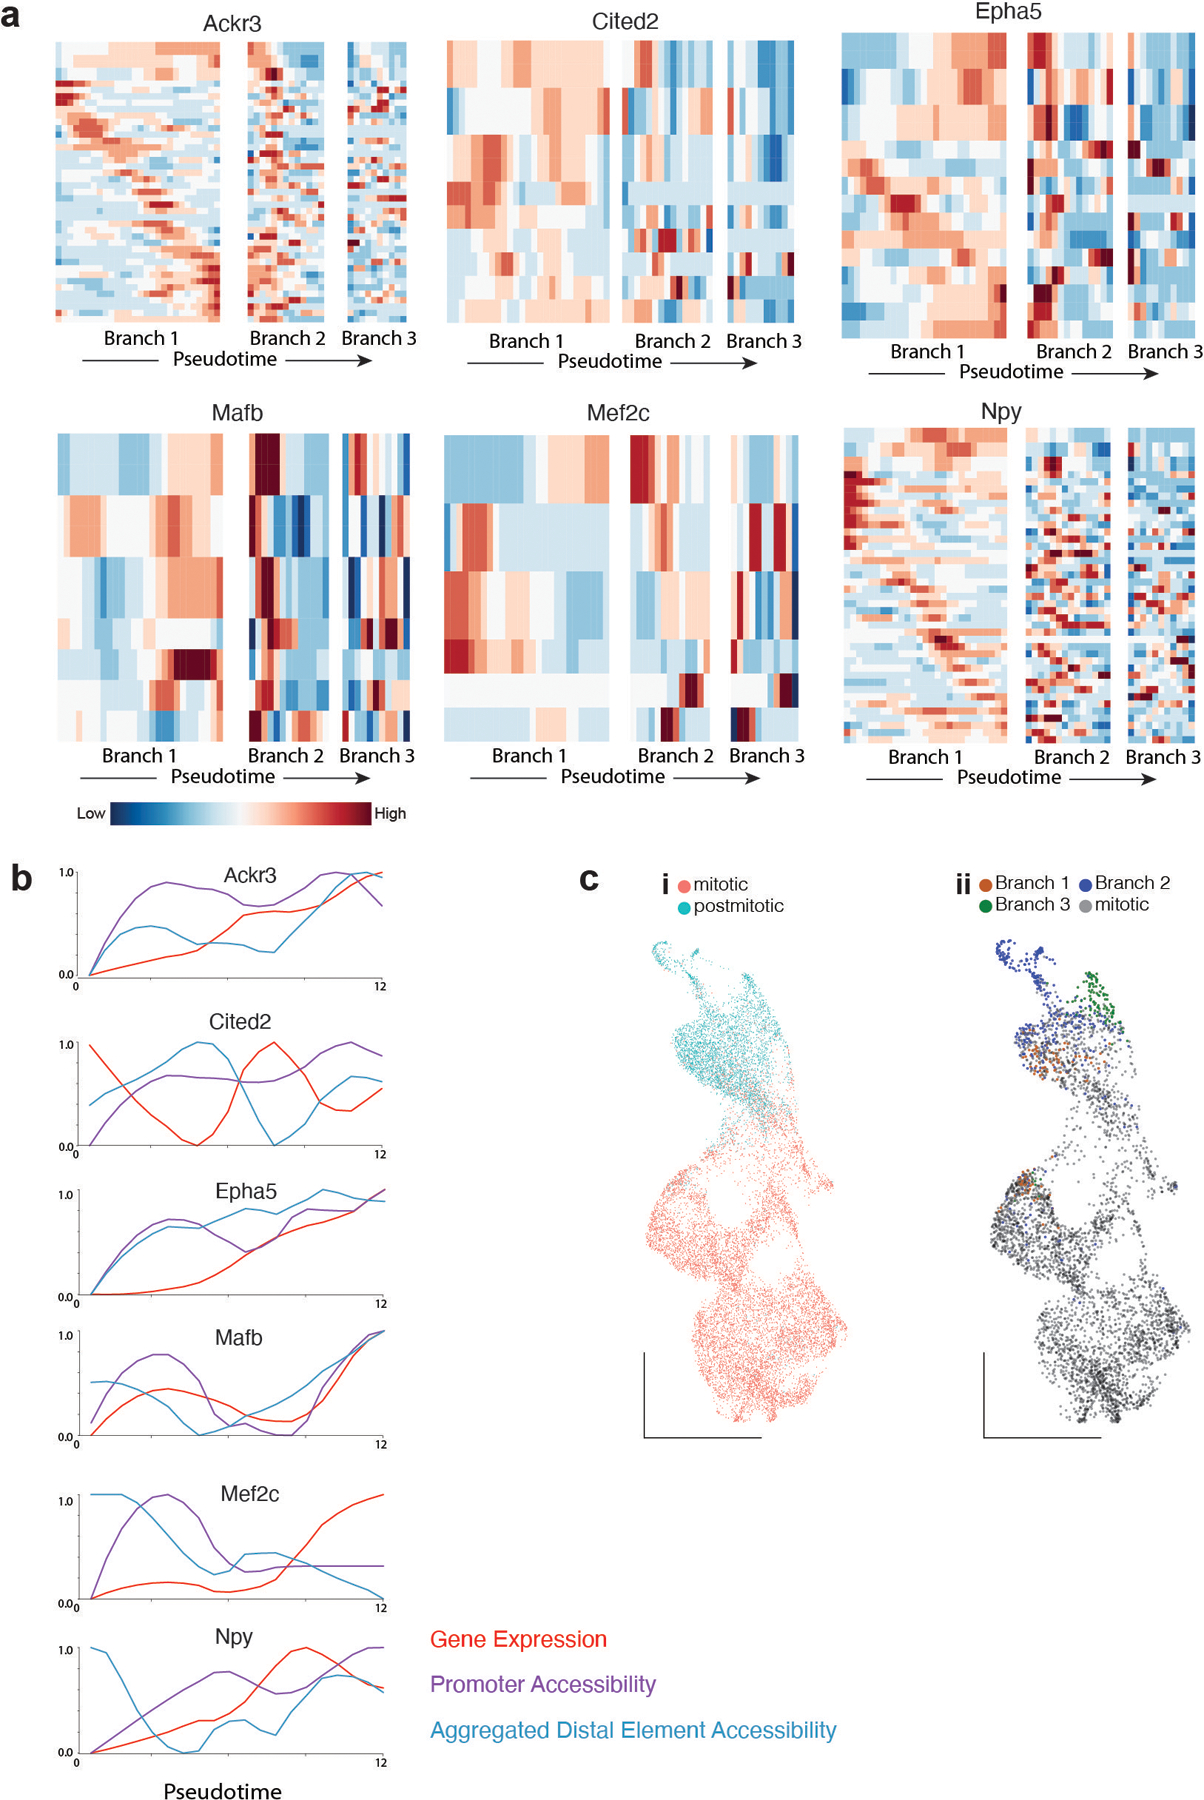
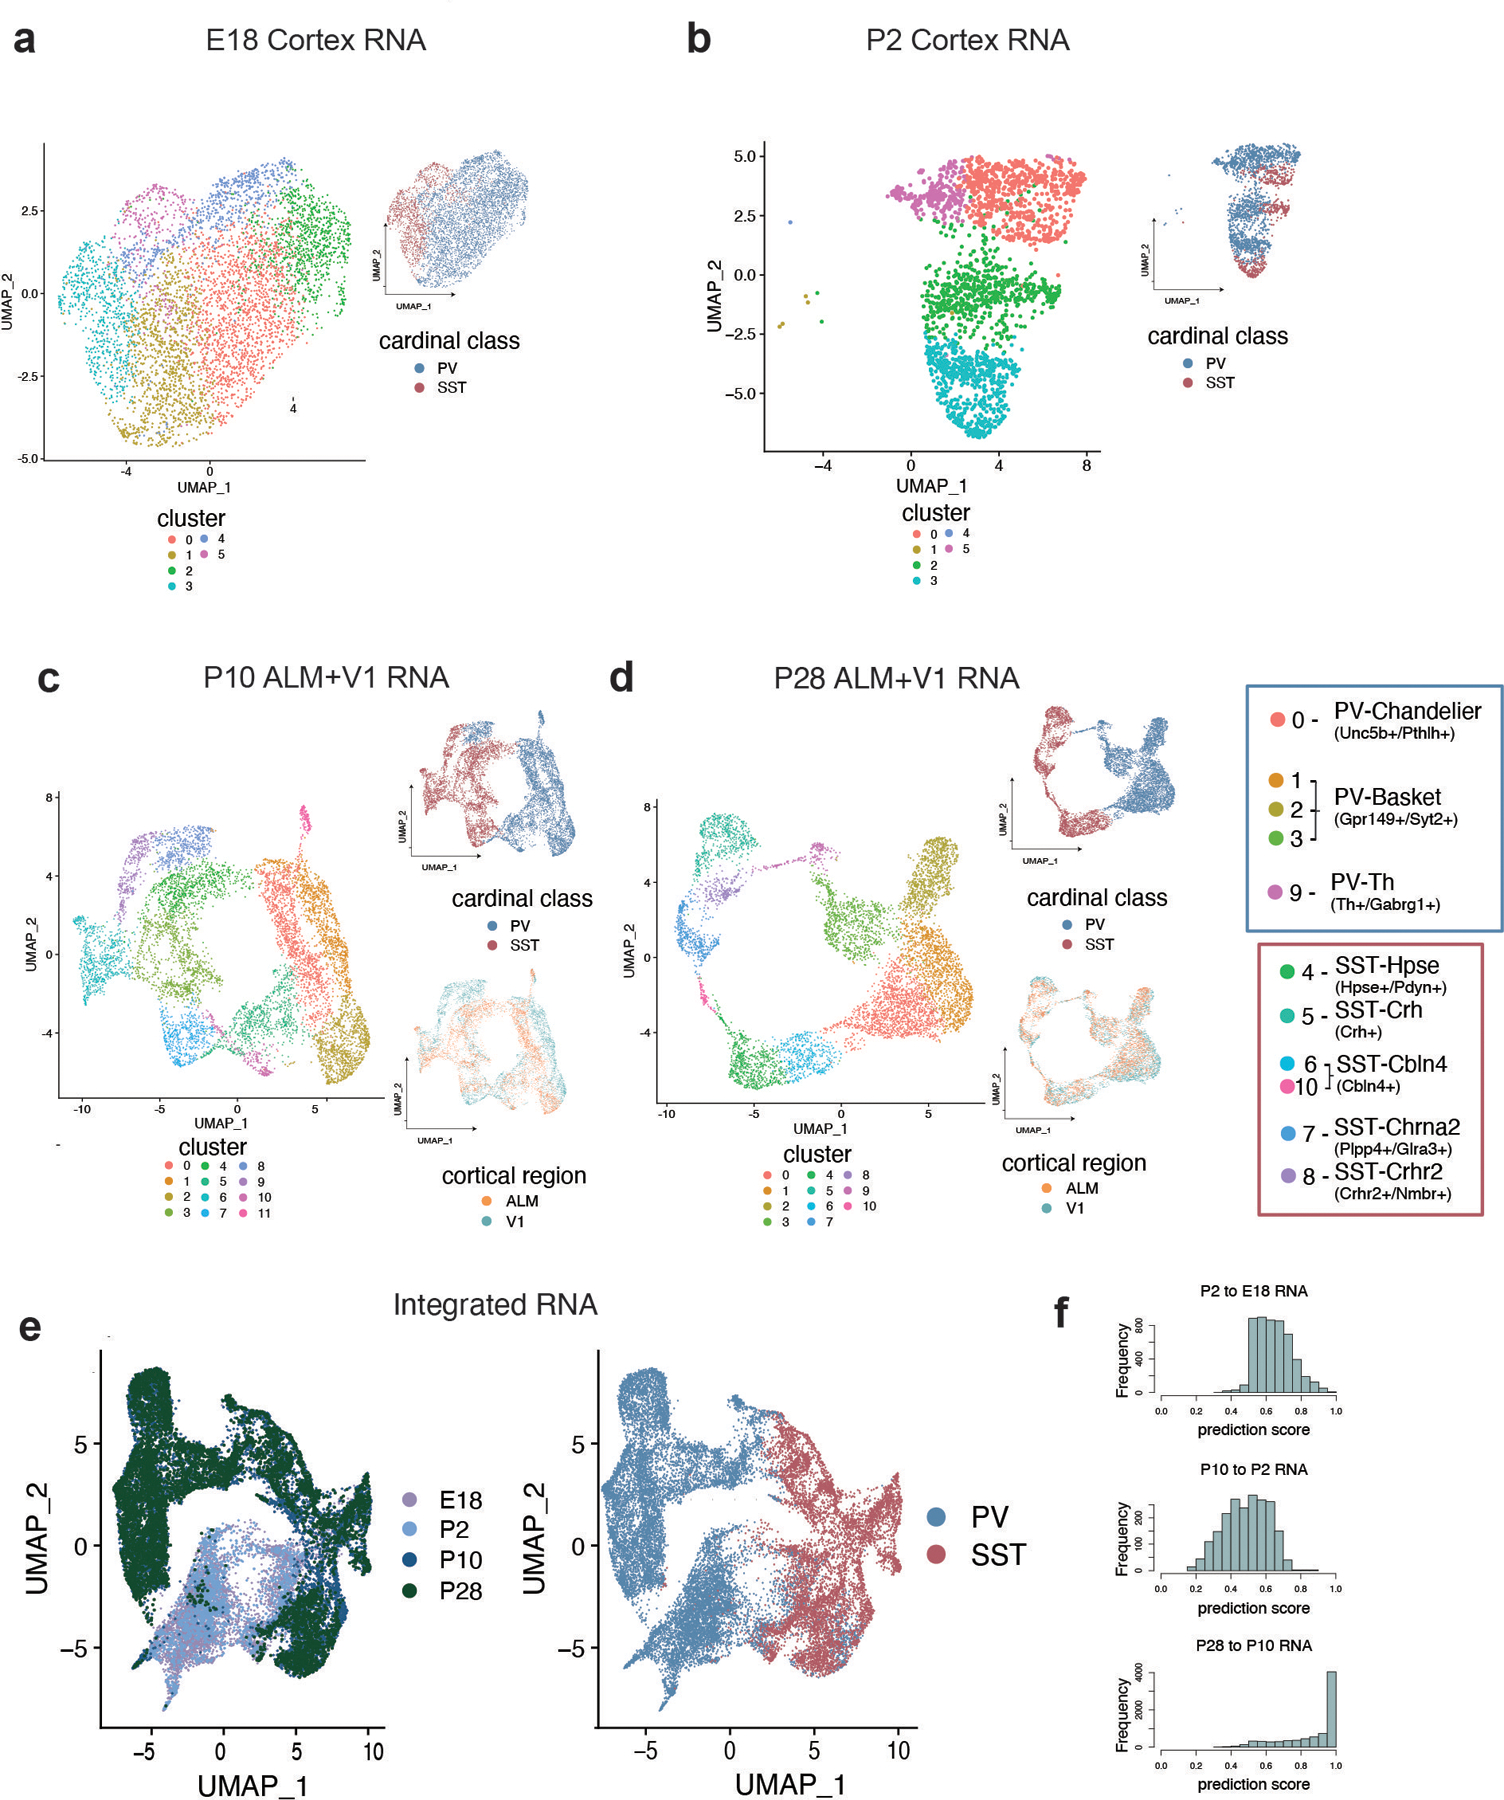
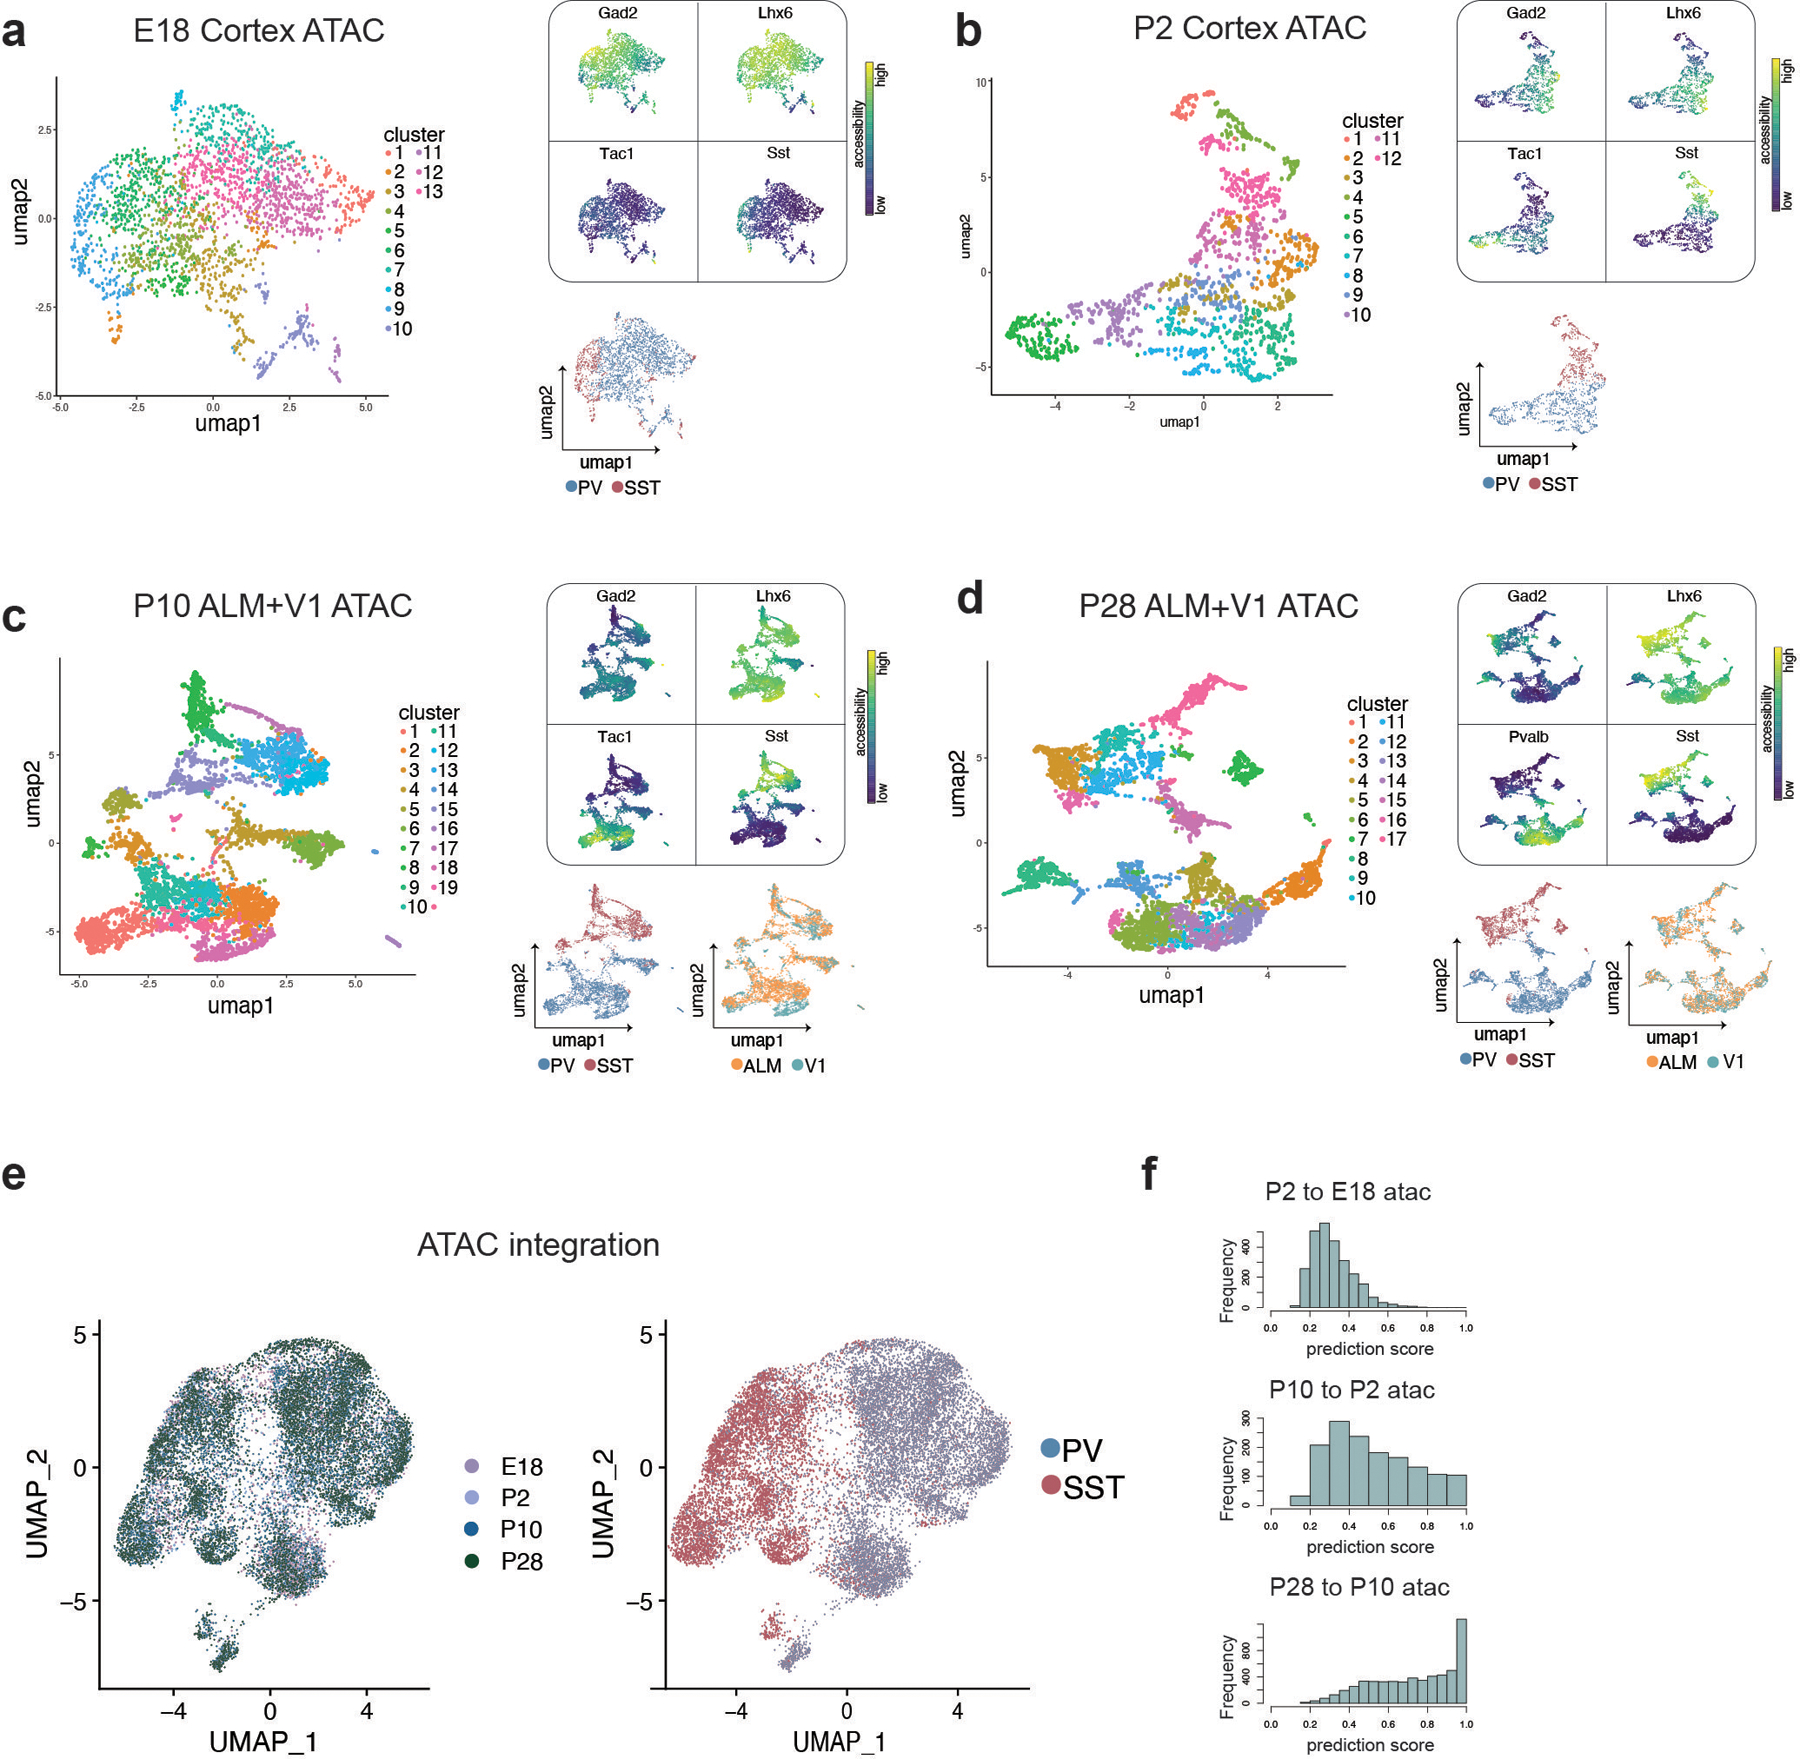
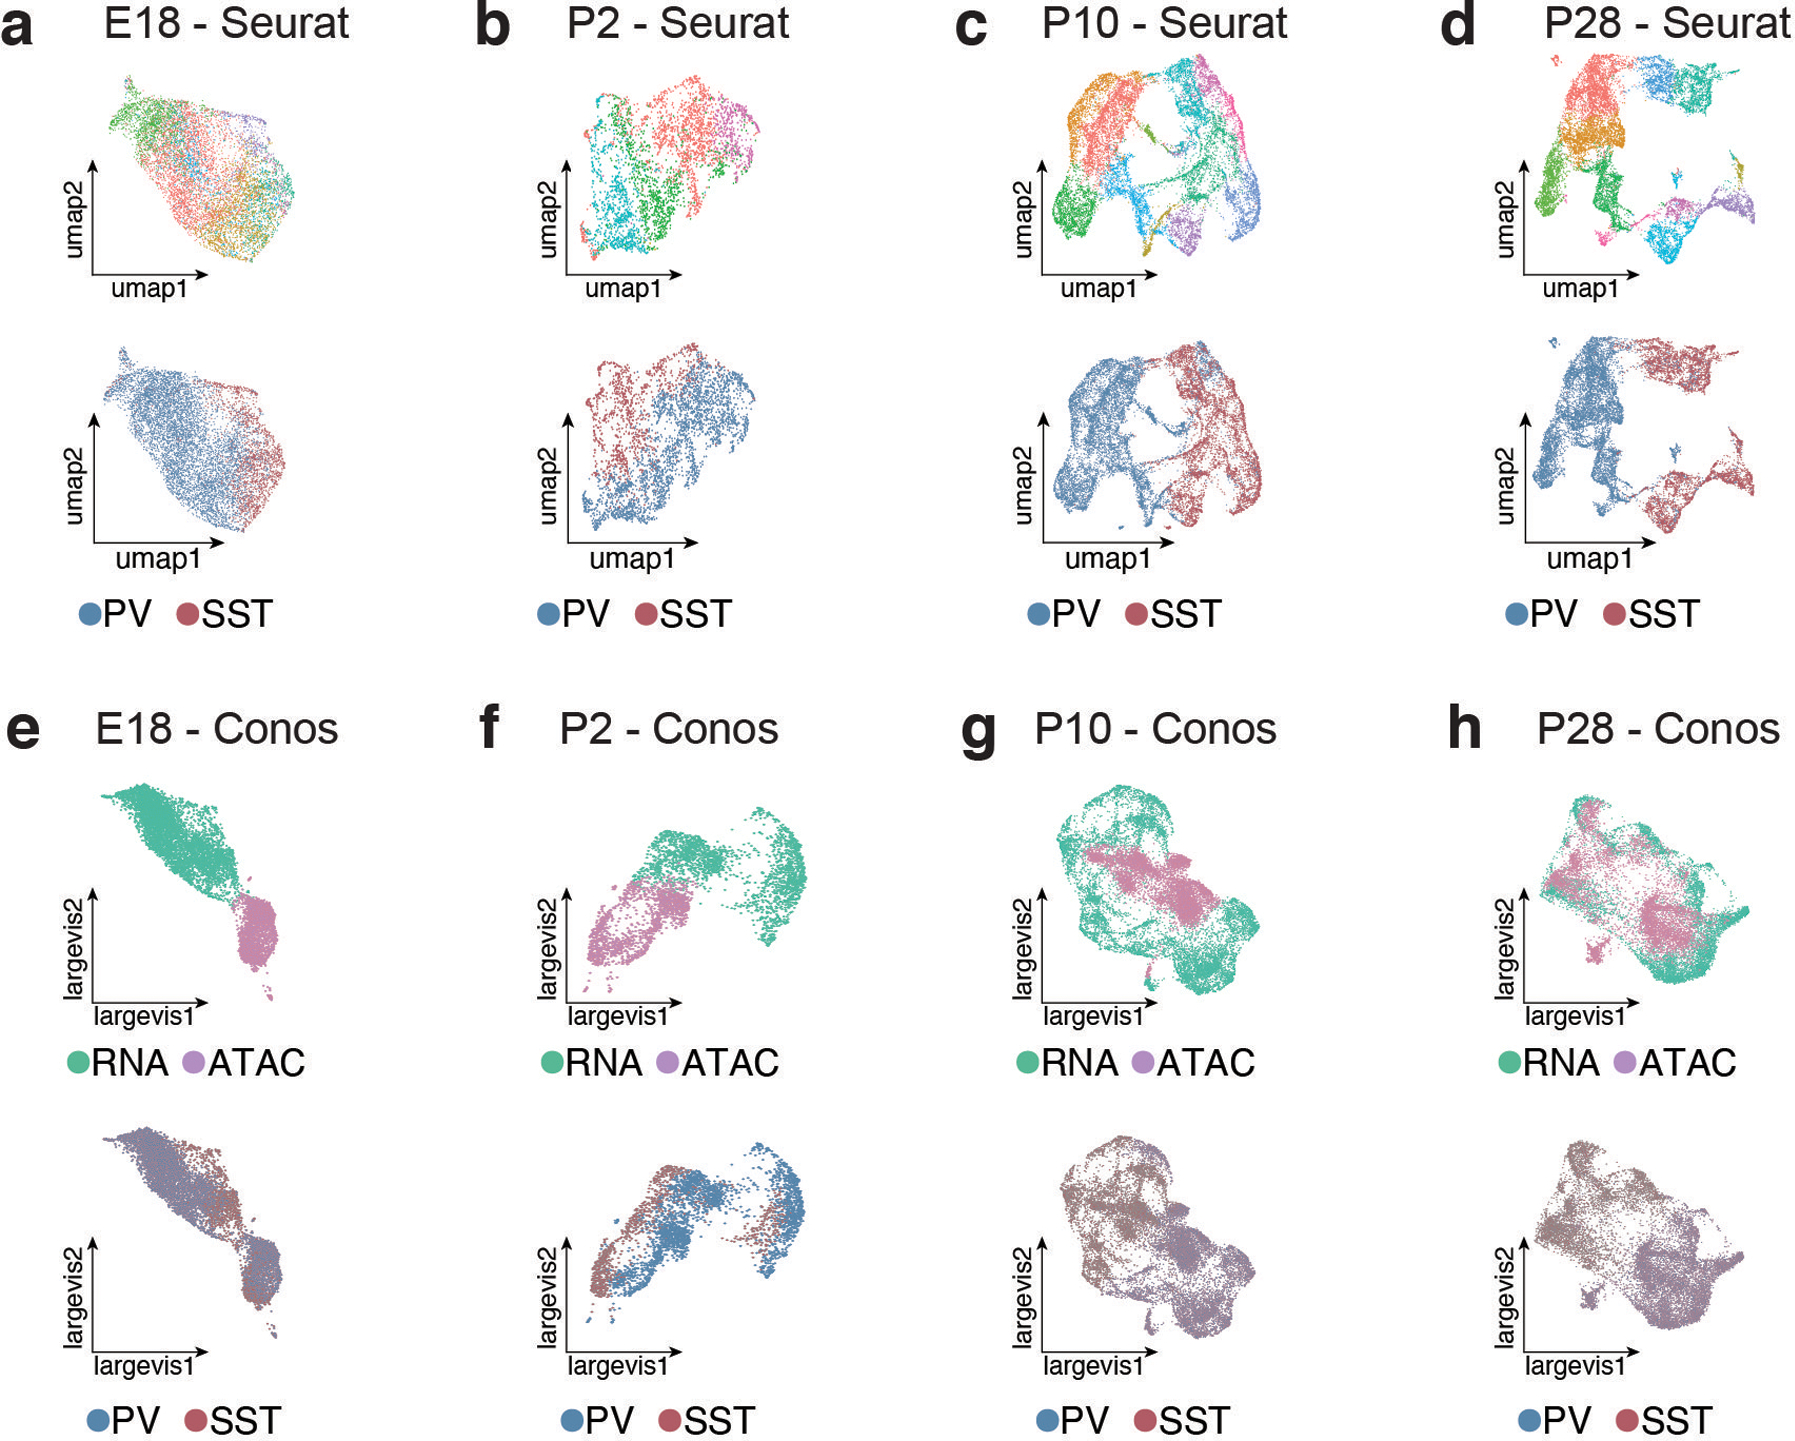
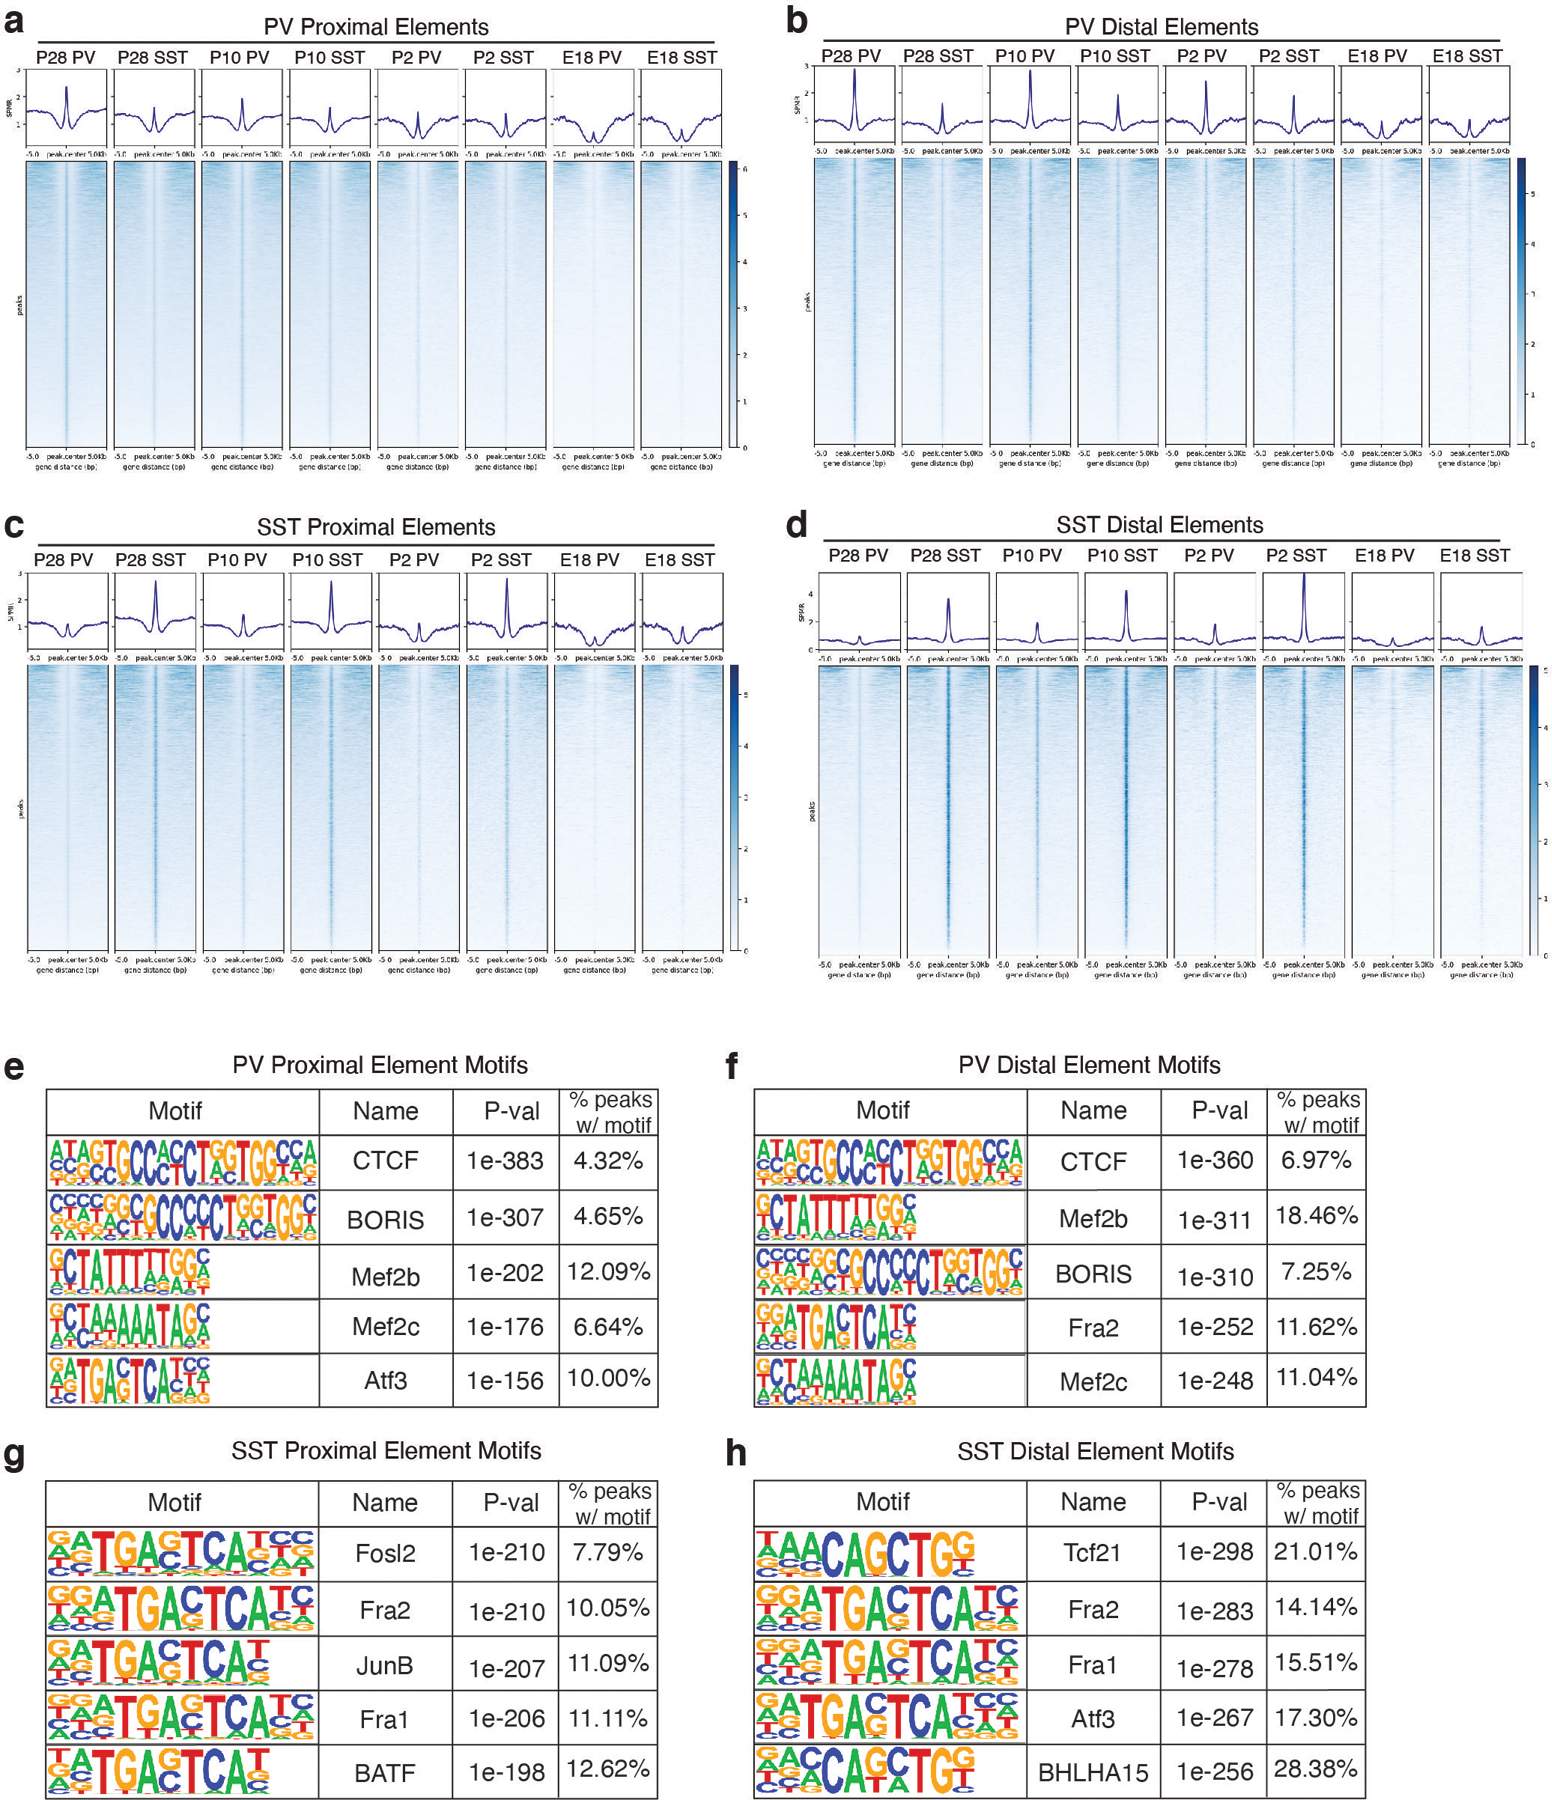
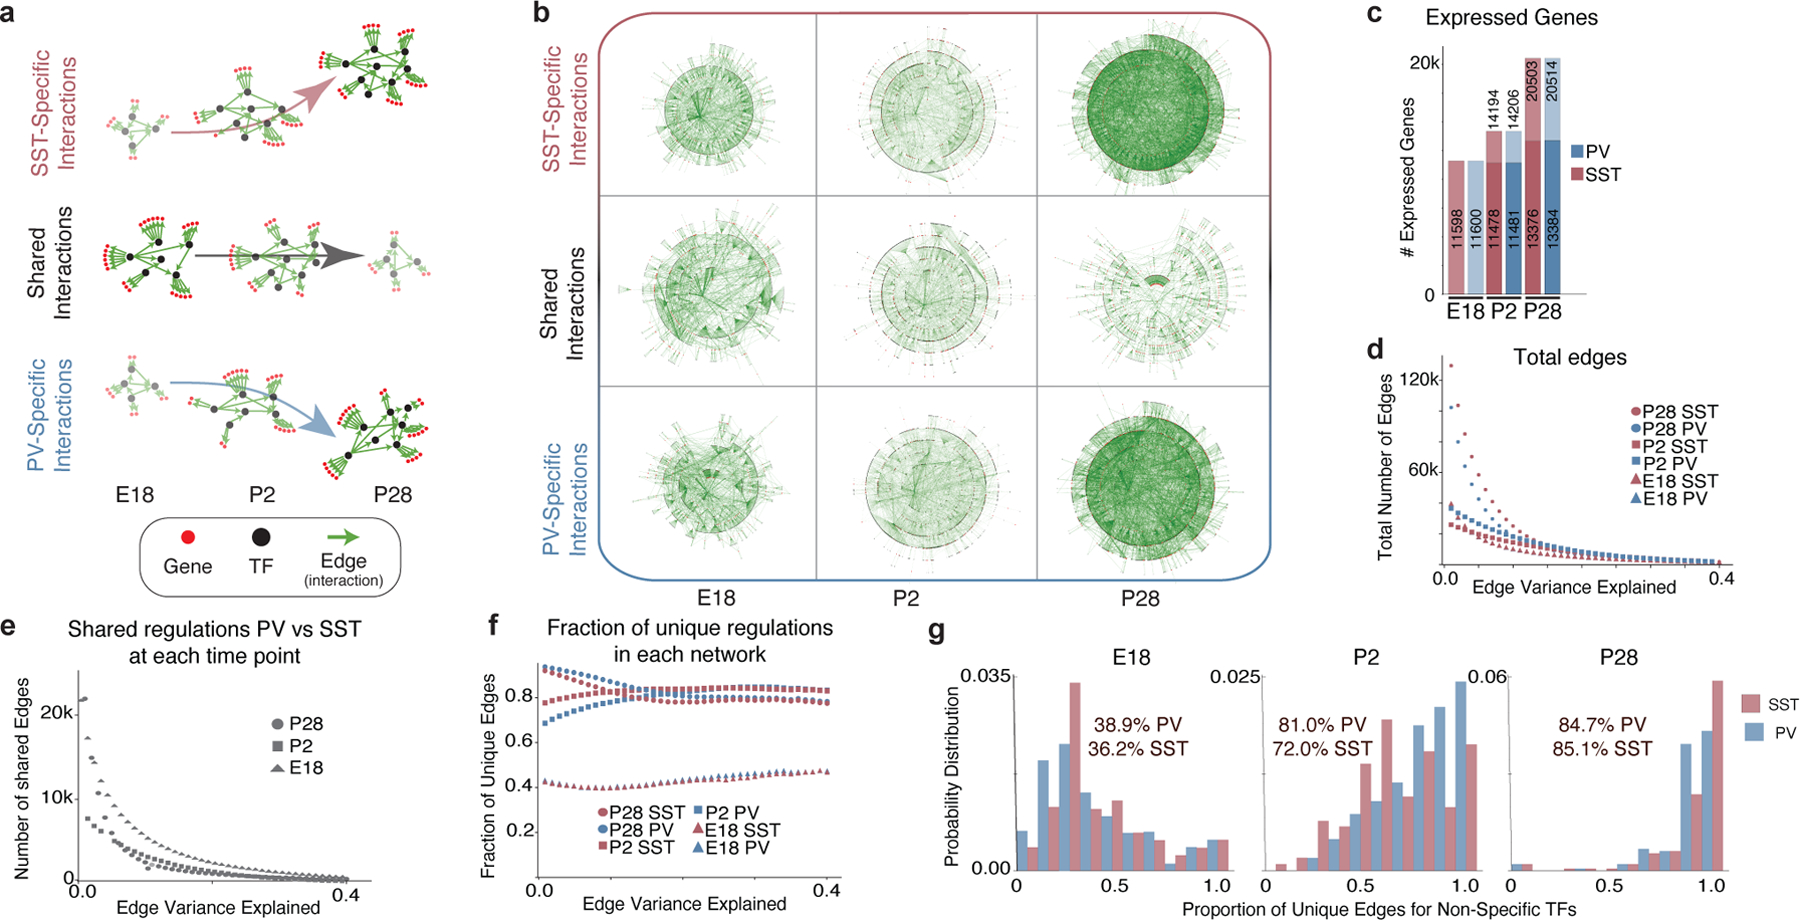
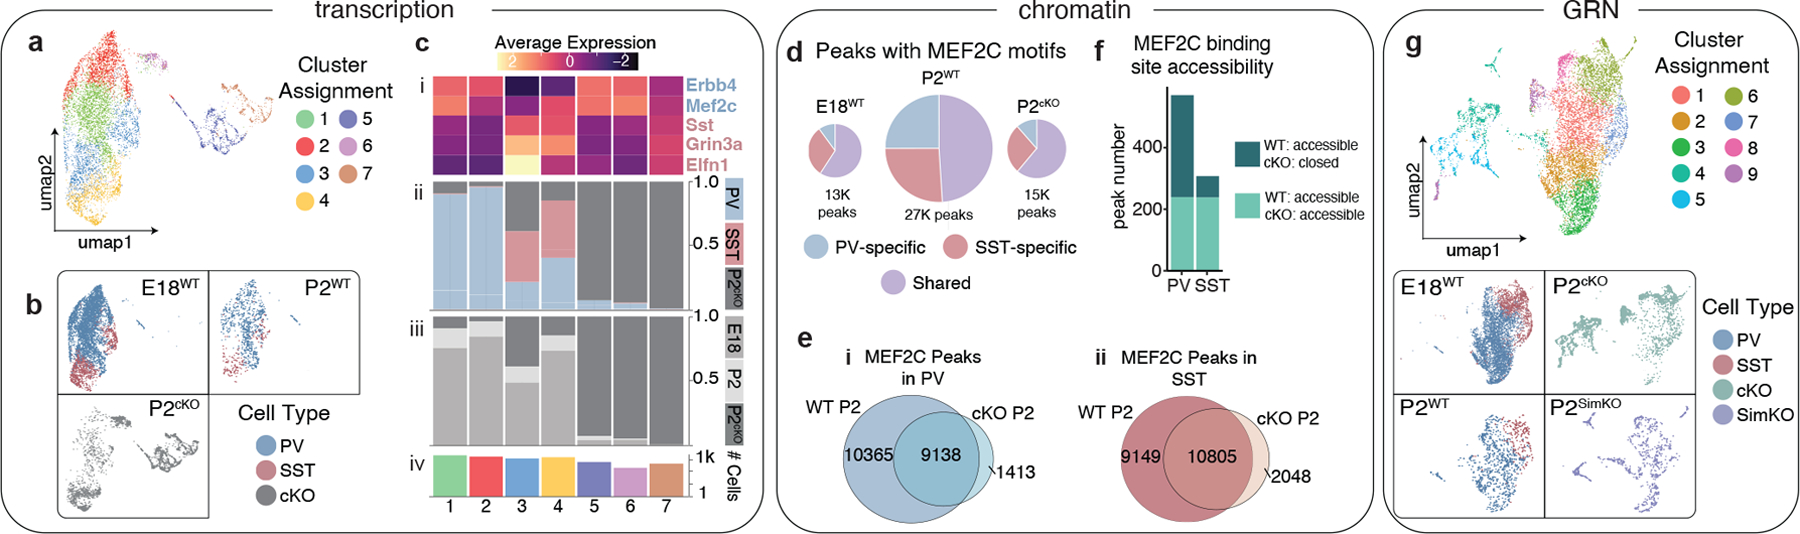
One of the hallmarks of the cerebral cortex is the extreme diversity of interneurons1-3. The two largest subtypes of cortical interneurons, parvalbumin- and somatostatin-positive cells, are morphologically and functionally distinct in adulthood but arise from common lineages within the medial ganglionic eminence4-11. This makes them an attractive model for studying the generation of cell diversity. Here we examine how developmental changes in transcription and chromatin structure enable these cells to acquire distinct identities in the mouse cortex. Generic interneuron features are first detected upon cell cycle exit through the opening of chromatin at distal elements. By constructing cell-type-specific gene regulatory networks, we observed that parvalbumin- and somatostatin-positive cells initiate distinct programs upon settling within the cortex. We used these networks to model the differential transcriptional requirement of a shared regulator, Mef2c, and confirmed the accuracy of our predictions through experimental loss-of-function experiments. We therefore reveal how a common molecular program diverges to enable these neuronal subtypes to acquire highly specialized properties by adulthood. Our methods provide a framework for examining the emergence of cellular diversity, as well as for quantifying and predicting the effect of candidate genes on cell-type-specific development.


Conflict of interest statement

Competing Interests

The authors declare no competing interests. Correspondence and requests for materials should be addressed to G.F. (gordon_fishell@hms.harvard.edu) or R.B. (rbonneau@flatironinstitute.org).

Figures

Extended Data Figure 1.
Extended Data Figure 1.. Quality control of embryonic scRNA-seq samples and mitotic versus postmitotic discrimination.
a, Number of cells in Dlx6a− and Dlx6a+ scRNA-seq datasets collected from E13 MGE in Dlx6a-Cre;Ai9 mice and multiome dataset in E13 MGE wild type mice. b, Mean reads per cell in Dlx6a−, Dlx6a+ and multiome scRNA-seq datasets. c, Median genes detected per cell in Dlx6a−, Dlx6a+ and multiome scRNA-seq datasets. d, Fraction of cells scored to be in G2/M or S phase of the cycle cycle at each maturation score. Blue line indicates cells from the Dlx6- dataset, red line indicates cells from the Dlx6+ dataset. e, Diffusion map of E13 Dlx6a− and Dlx6a+ MGE scRNA-seq data color-coded by assignment to a mitotic (red) or postmitotic (blue) state. f, Percentage of cycling cells as a function of the position along the maturation trajectory color-coded by assignment to a mitotic (red) or postmitotic (blue) state in E13 Dlx6a− and Dlx6a+ MGE scRNA-seq datasets. g, Diffusion map of E13 multiome MGE scRNA-seq data color-coded by assignment to a mitotic (red) or postmitotic (blue) state. h, Percentage of cycling cells as a function of the position along the maturation trajectory color-coded by assignment to a mitotic (red) or postmitotic (blue) state in E13 multiome MGE scRNA-seq dataset. i, Line plots indicating the promoter accessibility (blue) and gene expression (red) for six developmentally-regulated genes.
Extended Data Figure 2.
Extended Data Figure 2.. Developmental characterization of embryonic E13 MGE cells surveyed using scRNA-seq, scATAC-seq, and multiomic methods.
a, Analysis of Dlx6a−, Dlx6a+ and multiome scRNA-seq datasets collected from E13 MGE in Dlx6a-Cre;Ai9 mice and multiome dataset in E13 MGE wild type mice. b, Analysis of Dlx6a−, Dlx6a+ and multiome scATAC-seq datasets collected from E13 MGE in Dlx6a-Cre;Ai9 mice and multiome dataset in E13 MGE wild type mice. i, Dlx6+/− FAC-sorted and multiome cells. ii, Unbiased cluster annotation. iii, Dlx6+ and Dlx6- annotation. iv, Cell cycling phase annotation. v, Pseudotime annotation. vi, Mitotic and postmitotic cell annotation. In ii-vi, Annotations are performed on scRNA-seq datasets and transferred to scATAC-seq datasets through the multiome dataset. scRNA- and scATAC-seq low dimensional representation reflects UMAP embedding. vii, Average gene expression and promoter accessibility for unbiased clusters.
Extended Data Figure 3.
Extended Data Figure 3.. Orthogonal maturation trajectory methods reveal branching fates in postmitotic MGE cells at E13.
a, Palantir Analysis of Analysis of Dlx6a−, Dlx6a+ and multiome scRNA-seq postmitotic cells. b, UMAP Analysis of Analysis of Dlx6a−, Dlx6a+ and multiome scRNA-seq postmitotic cells. c, Diffusion Maps Analysis of Analysis of Dlx6a−, Dlx6a+ and multiome scRNA-seq postmitotic cells. For a, b, c: i, Unbiased clustering annotation. ii, Branch trajectories color-coded by slingshot pseudotime. iii, Gene expression for mitotic marker (Fabp7) and branch-specific marker (Zic1, Meis2, Maf). iv, For Palantir, cells are color coded by Palatir Pseudotime or Differentiation Potential. d, Confusion matrix reveals agreement of branch labels between different trajectory methods. e, TFs with binding motif highly enriched in a branch specific manner. f, Average gene expression across branches for TFs in e.
Extended Data Figure 4.
Extended Data Figure 4.. Chromatin accessibility precedes gene expression in branch 1- specific genes.
a, Heatmap depicting gene expression, Promoter and distal elements accessibility throughout branch 1 pseudotime for loci +/− 500kb around six branch 1 - specific genes. Distal elements are selected based on the relevance for classifying branch 1 cells. For each gene, row 1 shows gene expression, row 2 promoter accessibility, row 3 aggregated accessibility and the remaining rows are distal branch 1 classifying elements. Each trace has been smoothed using the lowess function in R. b, Gene expression, Promoter and Aggregated accessibility throughout branch 1 pseudotime for 10 branch 1 - specific genes. c, Only postmitotic cells are classified as branch neurons by supervised classification methods. c-i) Classification of E13 cells into mitotic or postmitotic cells based on cell cycle RNA score. c-ii) Classification of E13 cells into mitotic or branch 1,2,3 lineages based on chromatin accessibility.
Extended Data Figure 5:
Extended Data Figure 5:. Analysis of MGE-derived cortical interneuron scRNA-seq datasets from E18 through P28.
a-d, UMAP showing individual scRNA-seq datasets from Dlx6a+ labeled cortical neurons, subsetted for PV+ and SST+ interneurons, collected at E18 (a), P2 (b), P10 (c), and P28 (d). Left UMAP in each panel is color-coded by cluster identity (individually determined for each dataset). Right UMAP in each panel is color-coded by cardinal class. Bottom right UMAP in (c) and (d) is color-coded by cortical region of origin (anterior lateral motor cortex - ALM, primary visual cortex - V1). In (d), the right-most boxes show each cluster linked to its subtype identity, determined by expression of marker genes. e, Integration of E18, P2, P10, and P28 scRNA-seq datasets using Seurat CCA. Left UMAP is color-coded by timepoint, right is color-coded by cardinal class. f, Prediction score indicating the confidence of label transfer between each timepoint. Cluster labels were transferred from P2 to E18 (top), from P10 to P2 (middle) and from P28 and P10 (bottom). Label transfer prediction scores were lowest between P10 and P2 timepoints.
Extended Data Figure 6:
Extended Data Figure 6:. Analysis of MGE-derived interneuron scATAC-seq datasets from E18 through P28.
a-d, UMAP showing individual scATAC-seq datasets from Dlx6a+ labeled cortical neurons, subsetted for PV+ and SST+ interneurons, collected at E18 (a), P2 (b), P10 (c), and P28 (d). Left UMAP in each panel is color-coded by cluster identity (individually determined for each dataset). Top right of each panel shows gene body accessibility of Gad2 (interneuron marker gene), Lhx6 (MGE-derived interneuron marker gene), Tac1 or PV (PV cIN marker gene), and Sst (SST cIN marker gene). Bottom right UMAP in each panel is color-coded by cardinal class, determined by accessibility of cardinal-class specific loci (identified at P28) and confirmed by marker gene accessibility. See methods for more information on cardinal class assignment in ATAC-seq data. Additional bottom right UMAP in (c) and (d) is color-coded by cortical region of origin (anterior lateral motor cortex - ALM, primary visual cortex - V1). e, Integration of E18, P2, P10, and P28 scATAC-seq datasets using Seurat CCA. Left UMAP is color-coded by timepoint, right is color-coded by cardinal class. f, Prediction score indicating the confidence of label transfer between each timepoint. Cluster labels were transferred from P2 to E18 (top), from P10 to P2 (middle) and from P28 and P10 (bottom). Label transfer prediction scores progressively increased over developmental time.
Extended Data Figure 7:
Extended Data Figure 7:. Integration of MGE-derived interneuron scRNA-and scATAC-seq datasets.
a-d, UMAPs showing scRNA- and scATAC-seq datasets integrated using Seurat CCA at E18 (a), P2 (b), P10 (c), and P28 (d). Top panel shows UMAP color-coded by RNA-seq cluster identity - i.e., the labels used for label transfer and calculation of prediction scores in Figure 2a–d. Bottom panel UMAP is color-coded by cardinal class identity. e-h, UMAPs showing scRNA- and scATAC-seq datasets integrated using CONOS E18 (e), P2 (f), P10 (g), and P28 (h). Top panel shows UMAP color-coded by dataset of origin (RNA or ATAC). Bottom panel UMAP is color-coded by cardinal class identity. Cells from RNA and ATAC datasets integrated relatively well at later developmental timepoints, but were mostly segregated at earlier timepoints (E18, P2).
Extended Data Figure 8:
Extended Data Figure 8:. Distally located loci open in specific cardinal classes earlier in development than proximal elements.
a, Average signal (top) and signal at each locus (bottom) for peaks specifically called for PV cells at P28 that are within promoters or gene bodies (i.e., proximal elements). Promoter regions were defined as TSS+2 kb upstream. Signal within PV and SST cells at P28, P10, P2, and E18 are shown over a window 5 kb up- and down-stream of peak center (compare to Figure 2f, which zooms in to a 1 kb +/− window). b, Average signal (top) and signal at each locus (bottom) for peaks specifically called for PV cells at P28 that are distally located at each timepoint. c, Average signal (top) and signal at each locus (bottom) for peaks specifically called for SST cells at P28 that are within promoters or gene bodies (proximal) at each timepoint. d, Average signal (top) and signal at each locus (bottom) for peaks specifically called for SST cells at P28 that are distally located at each timepoint. e, Top five enriched motifs for P28 PV-specific proximal peaks. f, Top five enriched motifs for P28 PV-specific distal peaks. g, Top five enriched motifs for P28 SST-specific proximal peaks. h, Top five enriched motifs for P28 SST-specific distal peaks.
Extended Data Figure 9:
Extended Data Figure 9:. MEF2C CUT&RUN in PV and SST interneurons at P28.
a, Number of peaks called in each CUT&RUN replicate from PV (blue) and SST (red) cells, and the number of peaks present in both replicates from each cell type (intersect). b, Percentage of peaks containing a canonical Mef2c motif in each replicate. c, Significance (-log p-value) of enrichment of Mef2c motif in each replicate. d, The distribution of CUT&RUN peaks that were also present in P28 ATAC peak sets containing MEF2C motifs. For this analysis, the CUT&RUN replicate intersect peak sets of PV and SST were subsetted for those peaks that were also present in the ATAC peaks called for each cell type at P28 and found to contain a canonical MEF2C motif. Of those, they were categorized for those that were present in both PV and SST ATAC peak sets or unique to one cell type. e, Compares peaks identified in CUT&RUN (orange) or jointly in CUT & RUN and ATAC-seq analyses (green). ATAC-seq peaks used in this analysis were those identified in each cell type at P28 regardless of presence or absence of a canonical Mef2c motif. Compare with Fig. 2j which performs the same analysis but only includes ATAC peaks with a Mef2c motif. f-g, HOMER results for de novo motif discovery in replicate intersect peak sets for PV and SST cINs. h, Genomic location of each CUT&RUN peak in replicate intersect peak sets for PV and SST cINs. i, Integrative Genomics Viewer (IGV) snapshots showing bigwig files for each CUT&RUN replicate and associated peaks called in both replicates (intersect) for PV and SST cINs. Genomic loci shows are examples of genes with nearby peaks for commonly expressed genes (Rbfox1, Grin2a) and PV-enriched genes (Erbb4, Pthlh, Plxcd3). j and k, Gene Ontology (GO) term analysis. Each CUT&peak was associated with the nearest gene TSS. These lists of genes for PV and SST cells were then used as input for GO term analysis, revealing an enrichment of genes associated with synapse development.
Extended Data Figure 10:
Extended Data Figure 10:. Single-cell RNA- and ATAC-seq analysis of Mef2c cKO interneurons compared to wild-type (WT) cells at P2.
a, UMAP of P2 WT snRNA-seq and P2 Mef2c cKO snRNA-seq data integrated using Seurat and color-coded by cluster identity. WT dataset here was prepared using single nuclei to match cKO rather than the whole cell dataset (see Fig. 4). b, UMAP in (a) segregated according to timepoint and color-coded by cell type. c, Cluster composition delineated by (i) marker gene expression (ii) cell type (iii) cell number. Compare a-c here with Fig.4 a–c - this figure contains single nucleus data for both WT and cKO while Fig 4 WT data is whole cell. d, UMAP of Mef2c cKO and WT cells color-coded by cluster. e, UMAP of Mef2c cKO and WT cells color-coded by genotype. f, UMAP of Mef2c cKO and WT cells color-coded by cardinal class identity. Mef2c cKO identity was determined by the accessibility of marker genes (see d) and assignment of clusters to the appropriate cardinal class. g, Gene body accessibility of SST and PV cIN marker genes (SST: Sst, Grin3a, Elfn1, Cacng3, Grm1, Satb1, Tmem91. PV: Tac1, Erbb4). h, Pie chart representation of scATAC-seq data showing the total number of peaks in E18 WT, P2 WT, and P2 Mef2c cKO, subdivided into peaks that are PV or SST cell specific or shared across both cell types. Compare to Figure 4d, which shows similar pie charts but only for peaks with Mef2c motifs.
Figure 1:
Figure 1:. Distal chromatin elements provide the earliest markers of interneuron identity.
a and b, Diffusion maps of MGE cells using scRNA- (a) and scATAC-seq (b). Cells order into a maturation trajectory with both methods. c and d, RNA expression of maturation-relevant genes (c) and the corresponding promoter accessibility (d) across the maturation trajectory. Scale denotes normalized row-scaled expression or promoter accessibility. Arrowheads indicate the mitotic/postmitotic transition. e, Diffusion map analysis of scRNA-seq data from postmitotic MGE revealed three distinct branches: Branch 1-interneurons, Branch 2 & 3-projection. f, Detailed analysis of the Maf locus for gene expression, promoter and aggregated accessibility of distal elements shown for early postmitotic (trunk) and branch-specific cells. Bottom heatmaps show Maf distal elements compared for their accessibility across branches. Timeline (right) indicates the earliest time at which each branch can be distinguished by gene expression. g, Gene expression (red), promoter accessibility (green), and aggregated accessibility of distal elements (blue) for four branch 1 marker genes across the pseudotime.
Figure 2:
Figure 2:. Remodeling of interneuron chromatin architecture during migration and post-settling.
a,b,c,d UMAP of coembedded scRNA- and scATAC-seq data (top) and prediction scores of scATAC-seq assignment to scRNA-defined clusters (bottom) at E18 (a), P2 (b), P10 (c), P28 (d). e, Jaccard distance analysis for PV and SST cell scATAC-seq peaks across timepoints. f, Average signal within cell type-specific accessible peaks identified at P28 located for proximal elements (gene bodies or promoters: TSS+/−2kb) or distal elements across timepoints. g, Aggregated scores (AS) for branch-specific peaks. h, Motif enrichment (ME) in class-specific loci at each timepoint. Each TF enrichment value is normalized by the largest enrichment value in the population. i, Relative distribution of P28 MEF2C CUT&RUN peaks in PV versus SST interneurons. j, Peaks identified exclusively in CUT&RUN (orange) or jointly in CUT&RUN and ATAC-seq analyses (green). k, Number of genes linked to CUT&RUN peaks found uniquely in PV (blue), SST (red) or shared in both populations (purple). Peaks were assigned to genes based on scATAC co-accessibility with promoters. SPMR, signal per million reads; ME, Motif Enrichment; AS, Aggregated Score; C&R, CUT&RUN
Figure 3:
Figure 3:. The maturation of gene networks is characterized by the emergence of cell type-specific regulatory interactions.
a, Schematic illustrating key findings of the GRN analysis. Early in development, shared TFs generally target the same genes in both PV and SST cells. By adulthood, cell type-specific programs take over, with TFs regulating genes in a cell type-specific manner. b, Graphical representation of unique and common gene regulatory edges constructed using GRN analysis. Edges that explain at least 0.05% of the target’s variance are included. Each edge (green line) connects a TF (black dot) to a target gene (red dot) or another TF. c, Total number of genes detected in PV and SST interneurons at each timepoint. For P2 and P28, gene expression is divided into maintained from the earlier timepoint (bottom) versus newly expressed (top). Genes with <10 counts across all cells were excluded. d, Number of edges at each timepoint. Note: In d-f, the x-axis represents the edges that explain up to a certain value of its target’s variance. e, Edges shared between PV and SST. f, Proportion of the GRN unique to PV or SST cells at each age. g, The proportion of unique targets of common TFs. TFs were considered common if they had an absolute LFC ≤0.25 and expressed in >10% of both PV and SST cells. Statistics within graphs represent the mean percentage of unique edges per common TF.
Figure 4:
Figure 4:. Loss of Mef2c disproportionately affects the gene regulatory landscape of PV cells.
a, UMAP of integrated E18, P2 and P2 Mef2c cKO scRNA-seq data. b, UMAP in (a) segregated according to timepoint and color-coded by cell type. c, Cluster composition delineated by (i) marker gene expression, (ii) cell type, (iii) timepoint, (iv) cell number. d, Proportion of scATAC-seq peaks with MEF2C motifs in E18 WT, P2 WT, and P2 Mef2c cKO datasets. Charts are scaled to reflect the total number of peaks. e, Venn diagram showing all peaks with MEF2C motifs in WT P2 and cKO P2 (i) in PV cells, (ii) SST cells. f, Number of MEF2C binding sites (identified in the MEF2C CUT&RUN experiment, see Fig. 2) that were either accessible in both the P2 WT and Mef2c cKO scATAC-seq dataset (light green) or that were accessible in the P2 WT cells but inaccessible in the cKO (dark green). g, UMAP of simulated Mef2c knockout cells (P2SimKO) and cells from the true cKO RNA-seq dataset (P2cKO), P2 WT RNA-seq dataset (P2WT), and E18 WT RNA-seq dataset (E18).

References

    1. Ascoli GA et al. Petilla terminology: Nomenclature of features of GABAergic interneurons of the cerebral cortex. Nat. Rev. Neurosci 9, 557–568 (2008). - PMC - PubMed
    1. Defelipe J et al. New insights into the classification and nomenclature of cortical GABAergic interneurons. Nat. Rev. Neurosci 14, 202–216 (2013). - PMC - PubMed
    1. Kepecs A & Fishell G Interneuron cell types are fit to function. Nature 505, 318–26 (2014). - PMC - PubMed
    1. Mayer C et al. Clonally Related Forebrain Interneurons Disperse Broadly across Both Functional Areas and Structural Boundaries. Neuron 87, 989–998 (2015). - PMC - PubMed
    1. Harwell CC et al. Wide Dispersion and Diversity of Clonally Related Inhibitory Interneurons. Neuron 87, 999–1007 (2015). - PMC - PubMed

Methods References

    1. Monory K et al. The Endocannabinoid System Controls Key Epileptogenic Circuits in the Hippocampus. Neuron 51, 455–466 (2006). - PMC - PubMed
    1. Madisen L et al. A robust and high-throughput Cre reporting and characterization system for the whole mouse brain. Nat. Neurosci 13, 133–140 (2010). - PMC - PubMed
    1. Mo A et al. Epigenomic Signatures of Neuronal Diversity in the Mammalian Brain. Neuron 86, 1369–84 (2015). - PMC - PubMed
    1. Vong LH, Ragusa MJ & Schwarz JJ Generation of conditional Mef2cloxp/loxp mice for temporal- and tissue-specific analyses. Genesis 43, 43–48 (2005). - PubMed
    1. Fogarty M et al. Spatial genetic patterning of the embryonic neuroepithelium generates GABAergic interneuron diversity in the adult cortex. J. Neurosci 27, 10935–46 (2007). - PMC - PubMed

Publication types