. 2021 Oct;598(7880):348-352.
doi: 10.1038/s41586-021-03922-4. Epub 2021 Sep 22.

Biologically informed deep neural network for prostate cancer discovery

Affiliations

Biologically informed deep neural network for prostate cancer discovery

Haitham A Elmarakeby et al. Nature. 2021 Oct.

Abstract

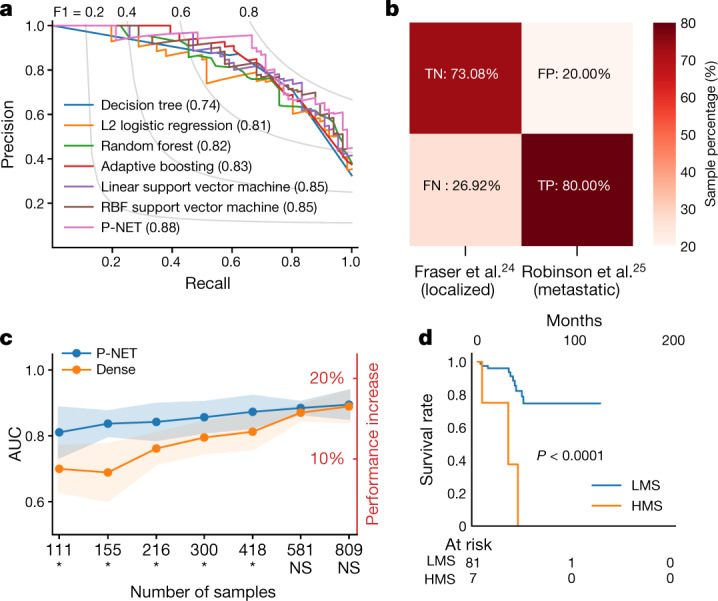
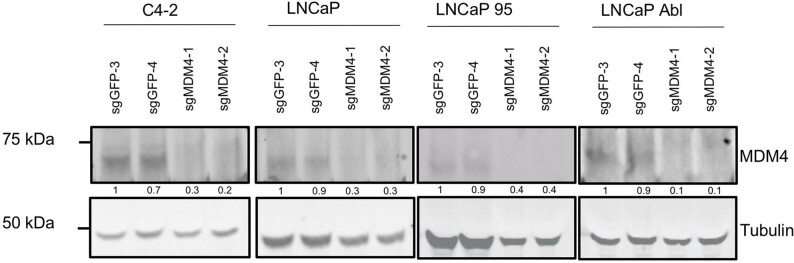
The determination of molecular features that mediate clinically aggressive phenotypes in prostate cancer remains a major biological and clinical challenge1,2. Recent advances in interpretability of machine learning models as applied to biomedical problems may enable discovery and prediction in clinical cancer genomics3-5. Here we developed P-NET-a biologically informed deep learning model-to stratify patients with prostate cancer by treatment-resistance state and evaluate molecular drivers of treatment resistance for therapeutic targeting through complete model interpretability. We demonstrate that P-NET can predict cancer state using molecular data with a performance that is superior to other modelling approaches. Moreover, the biological interpretability within P-NET revealed established and novel molecularly altered candidates, such as MDM4 and FGFR1, which were implicated in predicting advanced disease and validated in vitro. Broadly, biologically informed fully interpretable neural networks enable preclinical discovery and clinical prediction in prostate cancer and may have general applicability across cancer types.


Conflict of interest statement

W.C.H. is a consultant for Thermo Fisher, Solasta Ventures, iTeos, Frontier Medicines, Tyra Biosciences, MPM Capital, KSQ Therapeutics and Parexel and is a founder of KSQ Therapeutics. E.M.V. is a consultant/advisor for Tango Therapeutics, Genome Medical, Invitae, Enara Bio, Janssen, Manifold Bio and Monte Rosa Therapeutics. E.M.V. receives research support from Novartis and BMS. The other authors declare no competing interests.

Figures

Fig. 1
Fig. 1. Interpretable biologically informed deep learning.
P-NET is a neural network architecture that encodes different biological entities into a neural network language with customized connections between consecutive layers (that is, features from patient profile, genes, pathways, biological processes and outcome). In this study, we focus primarily on processing mutations and copy-number alterations. The trained P-NET provides a relative ranking of nodes in each layer to inform generation of biological hypotheses. Solid lines show the flow of information from the inputs to generate the outcome and dashed lines show the direction of calculating the importance score of different nodes. Candidate genes are validated to understand their function and mechanism of action.
Fig. 2
Fig. 2. Prediction performance of P-NET.
a, P-NET outperforms other models in terms of the AUPRC, values shown in brackets, when tested on the testing set (n = 204 from the Armenia et al. dataset). RBF, radial basis function. b, When evaluated using two independent external validation cohorts,, P-NET achieves 73% true-negative rate (TN) and 80% true-positive rate (TP), showing that it can generalize to classify unseen samples. FN, false-negative rate; FP, false-positive rate. c, P-NET achieves better performance (measured as the average AUC over five cross-validation splits) with smaller numbers of samples compared to a dense fully connected network with the same number of parameters. The solid line represents the mean AUC and the bands represent mean ± s.d. (n = 5 experiments). The difference in performance is statistically significant for all sample sizes up to 500 (*P < 0.05, one-sided t-test) (Methods). d, Patients with primary prostate cancer and high P-NET scores, HPS,  (wrongly classified by P-NET to be resistant samples) have a greater tendency to exhibit biochemical recurrence (BCR) compared with patients with lower P-NET scores, LPS,  who tend to exhibit progression-free survival (P = 8 × 10−5; log-rank test, two sided). This shows that the P-NET model may be useful in stratifying patients in the clinic and predicting potential BCR (raw data are included in Supplementary Table 9). LPS, low P-NET score; HPS, high P-NET score.
Fig. 3
Fig. 3. Inspecting and interpreting P-NET.
Visualization of inner layers of P-NET shows the estimated relative importance of different nodes in each layer. Nodes on the far left represent feature types; the nodes in the second layer represent genes; the next layers represent higher-level biological entities; and the final layer represents the model outcome. Nodes with darker colours are more important, while transparent nodes represent the residual importance of undisplayed nodes in each layer. The contribution of a certain data type to the importance of each gene is depicted using the Sankey diagram—for example, the importance of the AR gene is driven mainly by gene amplification, the importance of TP53 is driven by mutation, and the importance of PTEN is driven by deletion. NR, nuclear receptor; SHR, steroid hormone receptors; transc., transcription; transl., translation.
Fig. 4
Fig. 4. Clinical and functional evaluation of P-NET.
a, Joint distribution of AR, TP53 and MDM4 alterations across 1,013 prostate cancer samples using an UpSetPlot. A gene is defined as altered if it has a mutation, deep deletion or high amplification. b, Analysis of enzalutamide (enza)-resistant genes in LNCaP cells based on a genome-scale screen including 17,255 ORFs. The relative enzalutamide resistance of each ORF (x-axis) is plotted as a Z-score (y-axis), with higher Z-scores representing more resistance (Supplementary Table 10). MDM4 and other gene hits are highlighted on the graph, with MDM4 scoring as the strongest hit among these genes. CSS, low androgen medium. c, Relative viability of C4-2, LNCaP, LNCaP Abl and LNCaP 95 cells after transduction of CRISPR–Cas9 and sgRNAs targeting MDM4 (2 guides) or control GFP (2 guides). Data are mean ± s.e.m. of three replicates (the experiment was repeated three times with three replicates; Supplementary Data 1). d, Sensitivity of different prostate cancer cell lines to RO-5963. Relative viability is shown at each indicated dosage of RO5963. Data are mean ± s.d. of three replicates (the experiment was repeated three times; Supplementary Data 4). DU145, PC-3 and LAPC-4 are TP53-mutant prostate cancer cells; the other cells are TP53 wild type.
Extended Data Fig. 1
Extended Data Fig. 1. P-NET architecture and characteristics.
a, Dense layer with inputs xRdx and output yRdy vectors. The matrix WRdxdy is a trainable weights matrix and bRdy is the bias vector. f is the layer activation function. b, Arbitrary sparse layers are flexible to encode any connection scheme with the added M{0,1}dxdy binary mask matrix that controls the connectivity of the layer imposing sparsity on the weights matrix. c, A patterned sparse matrix with mask matrix M that follows a certain pattern. This pattern can be used to make computations more efficient. d, Predictive node is connected to each hidden layer in P-NET, and the final prediction is calculated by taking the average of all the predictive elements in the network. e, The number of parameters per layer of P-NET.
Extended Data Fig. 2
Extended Data Fig. 2. Computational performance of P-NET as compared to other models.
a, Original confusion matrix calculated by using a typical 0.5 threshold of the prediction scores to generate binary predictions. b, Adjusted confusion matrix calculated using an adaptive threshold that is used to maximize F1 score. c, The ROC curve of P-NET compared to other models showing that P-NET outperforms other models in terms of the area under curve (AUC) when tested on the testing set (n=204 of Armenia et al dataset). The models are compared by repeatedly training and testing each model in a cross-validation setup (n = 5 experiments) with testing sample sizes of 188, 182, 182, 182, and 181 respectively. Performance metrics reported here include; accuracy (d), area under ROC curve (e), area under precision recall curve AUPRC (f), F1 measure (g), precision (h), and recall (i). P-NET outperforms other models on average using all the metrics except Precision. Data in d-i are represented as boxplots where the middle line is the median, the lower and upper hinges correspond to the 1st and 3rd quartiles, the whisker corresponds to the minimum or maximum values no further than 1.5 × IQR from the hinge (where IQR is the inter-quartile range). Data beyond the end of the whiskers are outlying points that are plotted individually.
Extended Data Fig. 3
Extended Data Fig. 3. The effects of incorporating fusions in the P-NET model training.
The effect of incorporating fusions in the P-NET model training. Three models are reported here to study the effect of fusion on the P-NET performance i) ‘no-Fusion’ model incorporating only copy number and mutations for each gene ii) ‘Fusion’ model where fusion is added to the model as one binary variable to indicate whether a certain sample has fusion or not (restricted to ETS fusions and oncogene fusions). ‘Fusion (genes)’ model where fusions are included as binary variables for each gene indicating whether a certain gene was involved in a fusion or not (restricted to ETS fusions and oncogene fusions). a, The AUC curve of the three trained models showing similar performance when tested on the testing set. b, A bootstrapped version of the AUC comparison (2000 bootstrap samplings) showing similar performance of the three models. c, The importance score of all features showing that the fusion indicator has a non-zero score even when it is added to the 27k features fed into the model. d) The overall contributions of different data types (calculated as the aggregation of the importance scores of all corresponding features) showing minor contributions of the fusion features. The signal from the fusion features goes smaller when distributed over genes (‘Fusions (genes)’ model) compared to the single feature encoding (‘Fusion’ model). e, The effect of adding fusion on the top ranked nodes in each layer as compared to the baseline ‘no-Fusion’ model rankings. Adding the fusion has a small effect on the top ranked nodes in higher layers, e.g. more than %80 of the top ranked nodes in h5 has not been affected by the fusion addition (‘Fusion’ model) compared to the baseline ‘no-Fusion’ model. The effect of the fusion addition is more prominent in the earlier layers, especially h0.
Extended Data Fig. 4
Extended Data Fig. 4. The effects of CNV definition on the P-NET model performance and stability.
Two different models are trained on (i) mutations plus only high amplifications and deep deletions, referred to by ‘two copies’ in the legend and (ii) mutations plus all GISTIC2.0 states (deep deletion, deletion, neutral, amplification, high amplification) referred to by ‘single copy’ in the legends. a) AUC comparison between the two models showing slight increase in the performance when including all the copy number levels. b) The stability of top features is studied by comparing the overlap between features picked by the model over 5-fold data splits. The stability index is calculated for five data splits (D1-D5) where the cells show the overlap between top 10 features picked by the model for each pair of the data splits. c) comparing the stability index of the two models shows that restricting the copy number levels (‘two copies’ model) has a positive effect on stabilizing the features picked by the model when trained on different data splits.
Extended Data Fig. 5
Extended Data Fig. 5. Performance comparison of sparse P-NET to dense models.
Comparing the performance of P-NET to a dense network with the same number of trainable parameters using different sizes of training sets (a: Recall, b: Precision, c: AUPRC, d: F1, e: Accuracy). Sample sizes marked by (*) indicate statistically significant differences (p-value <0.05, one-sided t-test) while those marked by (n.s.) are not. The solid line represents the mean and the bands represent mean +/- SD (n =5 experiments). f, Comparison of P-NET to a dense model with the same architecture (same number of nodes) but with large number of trainable parameters (14 M) shows that sparse P-NET is still better than a dense model in terms of the area under ROC curve, AUC.
Extended Data Fig. 6
Extended Data Fig. 6. Relative ranking of nodes in each layer.
Relative ranking of nodes in each layer based on P-NET total importance score. The height of the bar represents the estimated total importance score calculated as the summation of all sample-level importance scores over the testing set (n = 204). The error bar represents the 95-confidence interval around the estimated score calculated using 1000 bootstrap cycles over the testing set.
Extended Data Fig. 7
Extended Data Fig. 7. Relationship between P-NET importance scores and copy number enrichment of important genes.
a, Copy number enrichment of genes on chr1p (containing MDM4) relative to their model importance score. The y-axis shows the enrichment of the amplification in metastatic samples relative to primary samples, using -log (signed p) from Fisher’s exact test. There is evidence of high amplification enrichment around MDM4 specifically, but the higher model coefficient (importance score) is also partially informed by its relevance in biological pathways relative to neighboring genes (e.g. PKP1). b) There is less evidence for copy number focality being enriched around EIF3E on chr8q, which suggests that the model coefficient may be largely driven by the biological “bias” and less so by copy number focality. c, PDGFA on chr7p is a representative example where there is a mix of signal between modest focality at the peak where PDGFA is observed and biological “bias”.
Extended Data Fig. 8
Extended Data Fig. 8. Activation distribution of important nodes in each layer.
The activation distribution of top ranked nodes in each layer. Nodes in each layer are ordered based on their total importance score. The shown distribution is estimated using kernel density estimation to estimate the underlying distribution of node activations calculated for the testing set (n = 204). The current implementation of P-NET uses tanh activation function so the activation values are in the range −1 to 1. The figure shows better discrimination between sample classes (Primary- blue vs. Metastatic-orange) in higher layers compared to lower layers and in top ranked nodes compared to lower ranked ones. This shows that the total importance score of the nodes is manifested locally through the differential activation of nodes (nodes process different samples differently).
Extended Data Fig. 9
Extended Data Fig. 9. Immunoblot confirming MDM4 gene deletion.
Immunoblot confirming MDM4 gene deletion in all cell lines used in Fig. 4-c. Tubulin is a loading control. Quantification of MDM4 depletion is given under the MDM4 blots. ImageStudioLite was used for quantification (Quantification numbers are included in Supplementary Data 3). The experiment was repeated 3 times with similar results.

Comment in

  • Is Artificial Intelligence Ready for "Primetime" in Urology?
    [No authors listed] [No authors listed] BJU Int. 2021 Dec;128(6):659-660. doi: 10.1111/bju.15633. BJU Int. 2021. PMID: 34856063 No abstract available.
  • Uro-Science.
    Atala A. Atala A. J Urol. 2022 Aug;208(2):468-469. doi: 10.1097/JU.0000000000002770. Epub 2022 May 20. J Urol. 2022. PMID: 35593059 No abstract available.

References

    1. Robinson D, et al. Integrative clinical genomics of advanced prostate cancer. Cell. 2015;161:1215–1228. doi: 10.1016/j.cell.2015.05.001. - DOI - PMC - PubMed
    1. Abida W, et al. Genomic correlates of clinical outcome in advanced prostate cancer. Proc. Natl Acad. Sci. USA. 2019;116:11428–11436. doi: 10.1073/pnas.1902651116. - DOI - PMC - PubMed
    1. Ma J, et al. Using deep learning to model the hierarchical structure and function of a cell. Nat Methods. 2018;15:290–298. doi: 10.1038/nmeth.4627. - DOI - PMC - PubMed
    1. Yang JH, et al. A white-box machine learning approach for revealing antibiotic mechanisms of action. Cell. 2019;177:1649–1661.e9. doi: 10.1016/j.cell.2019.04.016. - DOI - PMC - PubMed
    1. Kuenzi BM, et al. Predicting drug response and synergy using a deep learning model of human cancer cells. Cancer Cell. 2020;38:672–684.e6. doi: 10.1016/j.ccell.2020.09.014. - DOI - PMC - PubMed

Publication types

MeSH terms