. 2021 Oct;598(7880):321-326.
doi: 10.1038/s41586-021-03948-8. Epub 2021 Sep 22.

Dopamine facilitates associative memory encoding in the entorhinal cortex

Affiliations

Dopamine facilitates associative memory encoding in the entorhinal cortex

Jason Y Lee et al. Nature. 2021 Oct.

Abstract

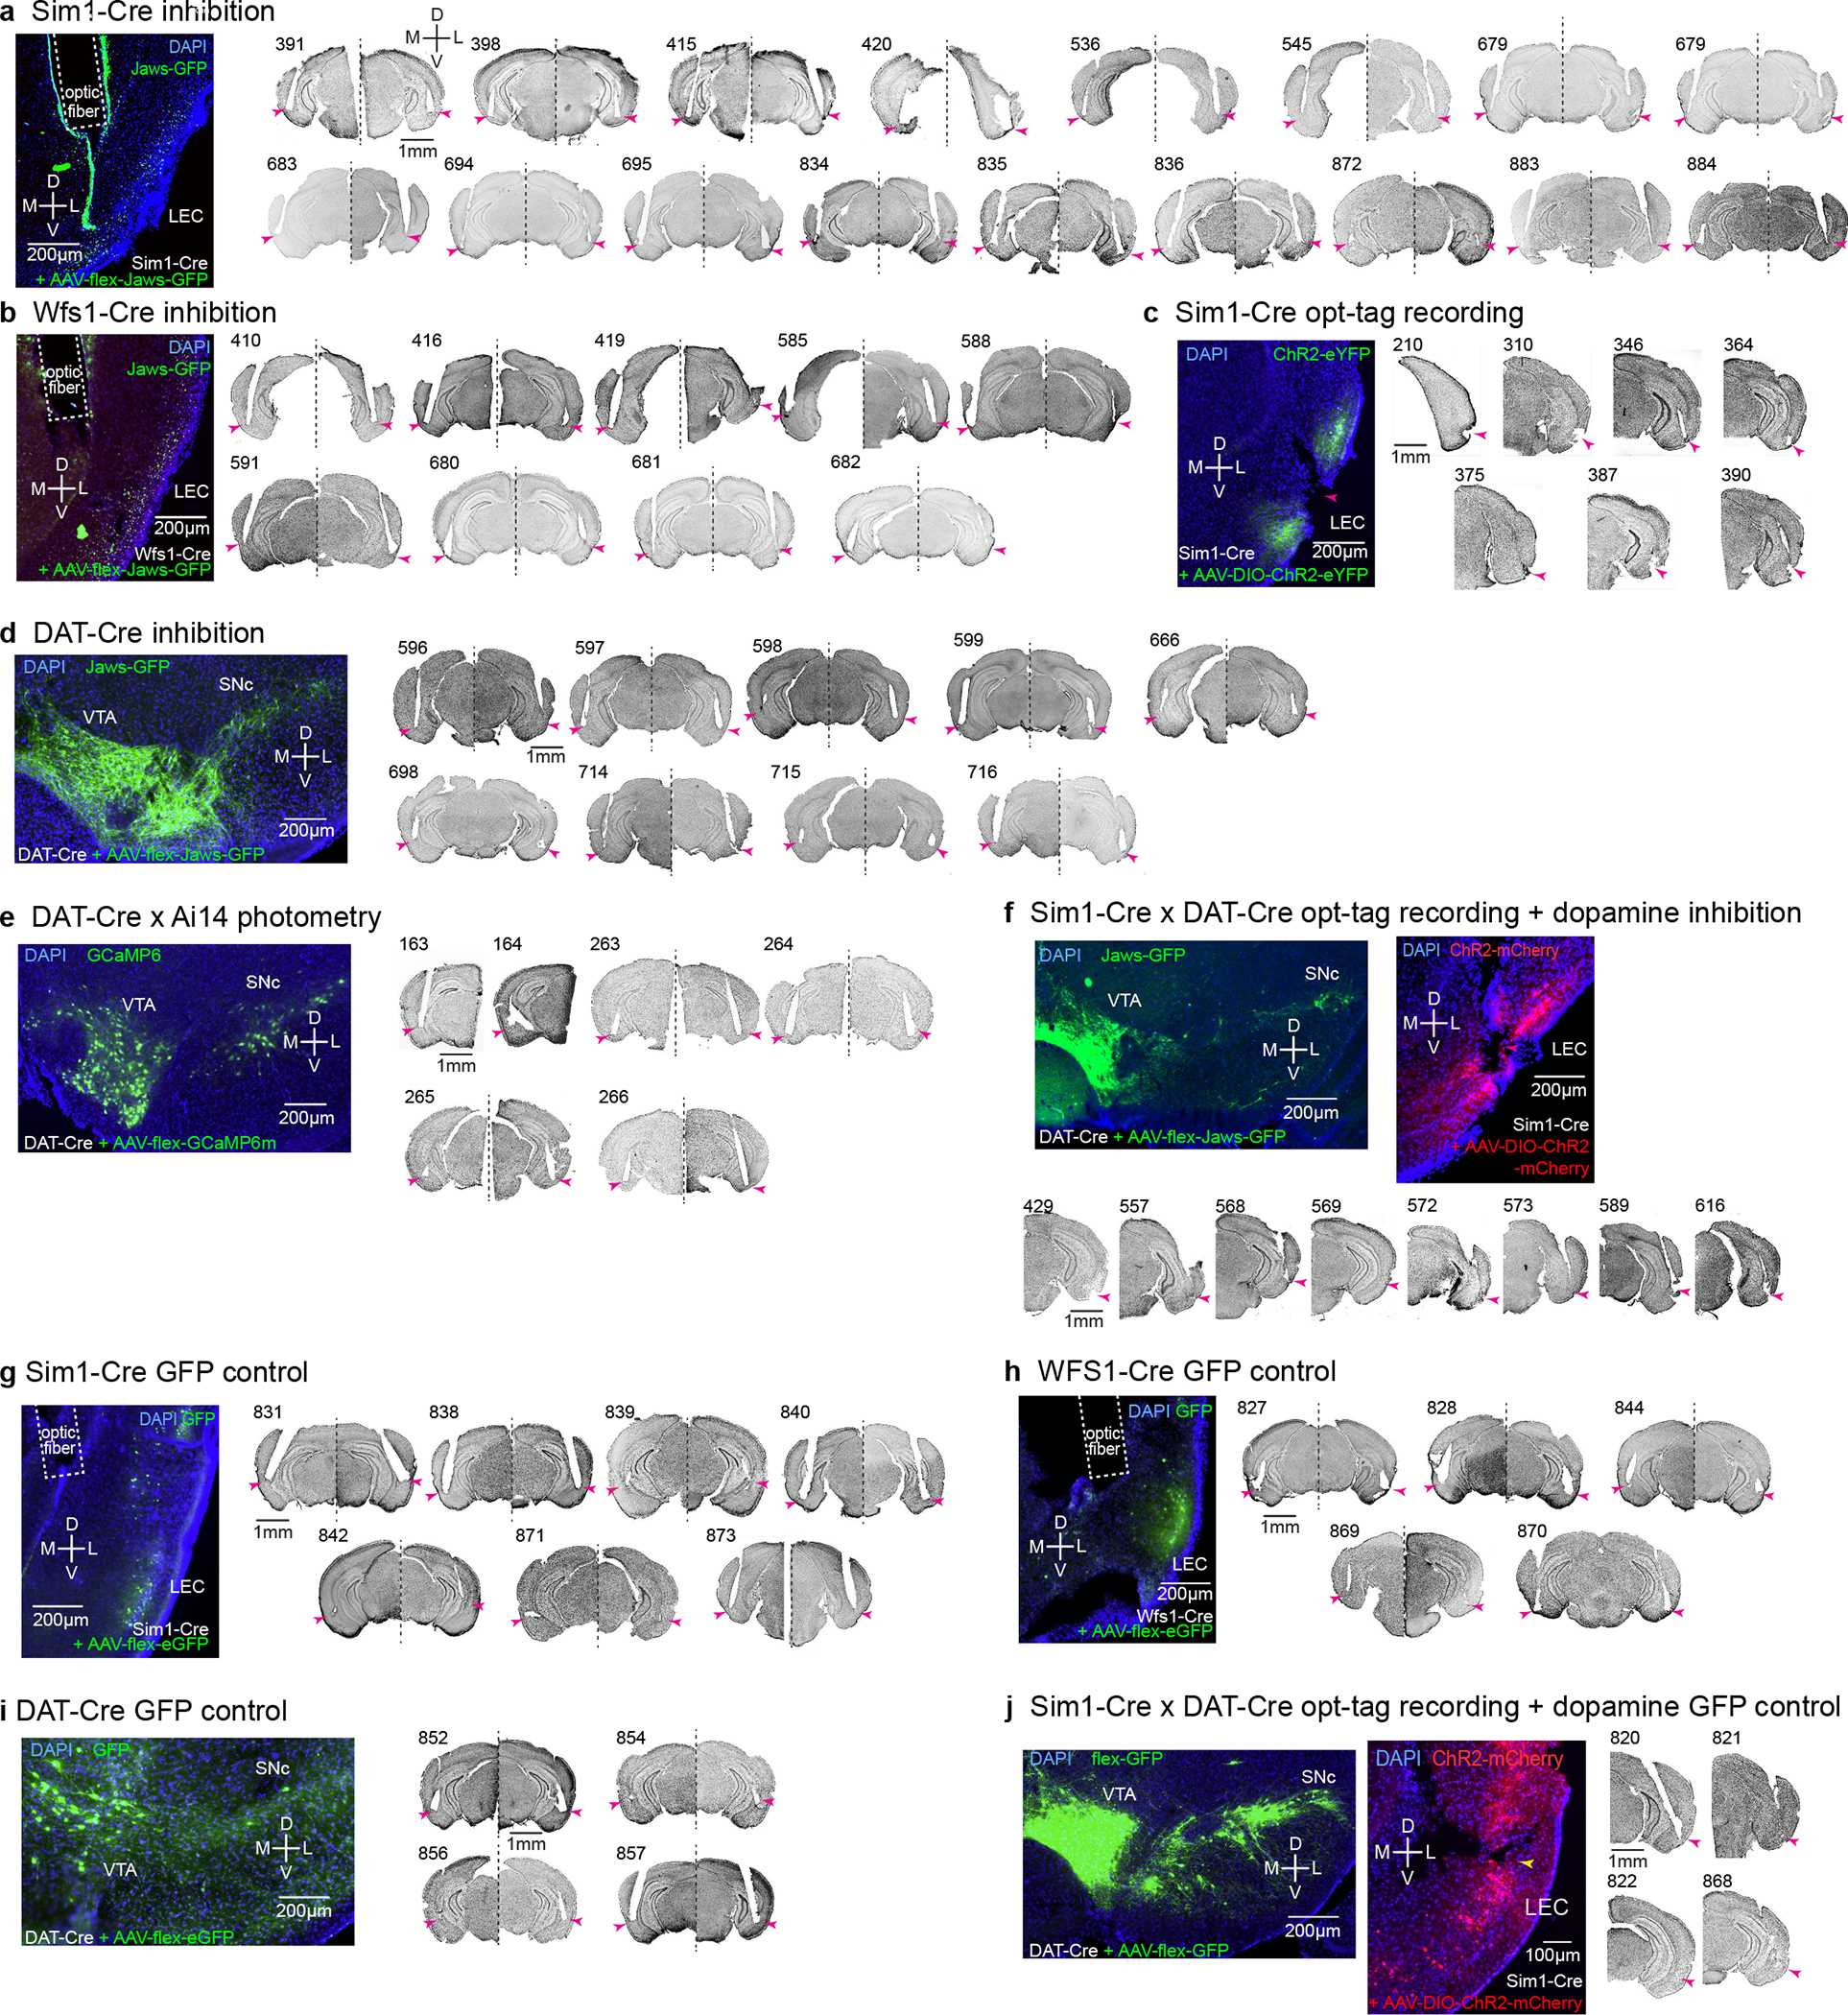
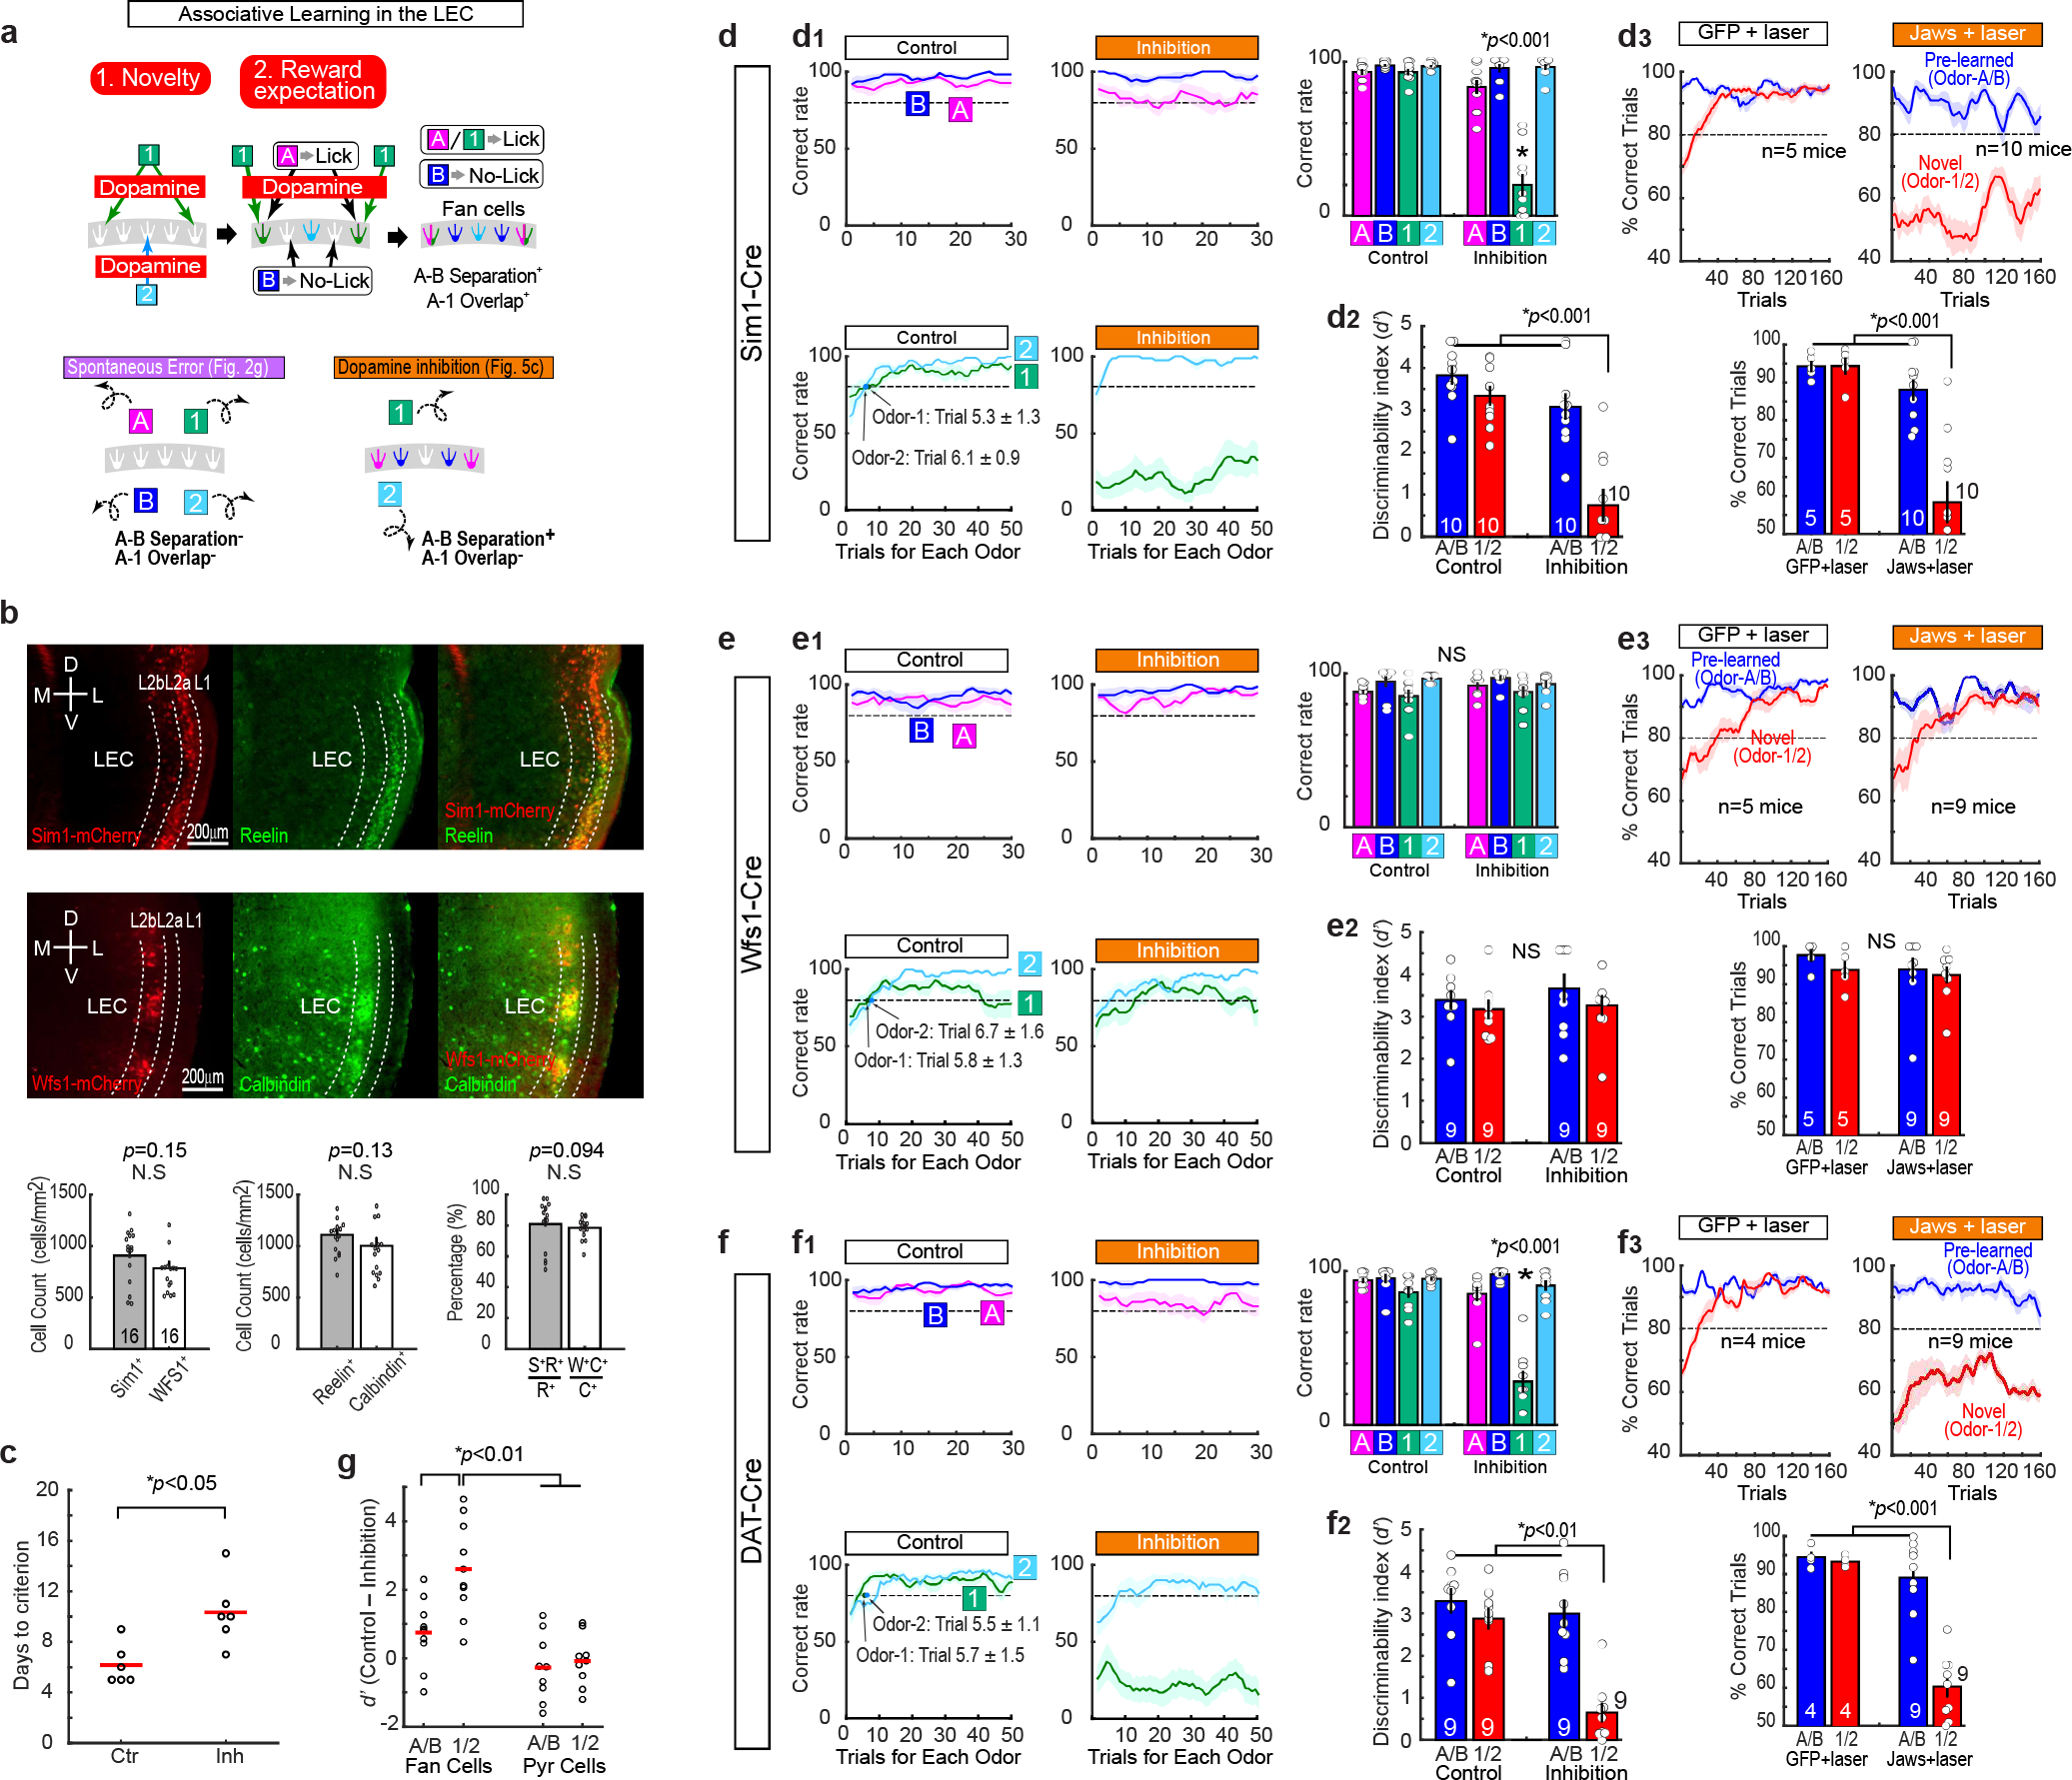
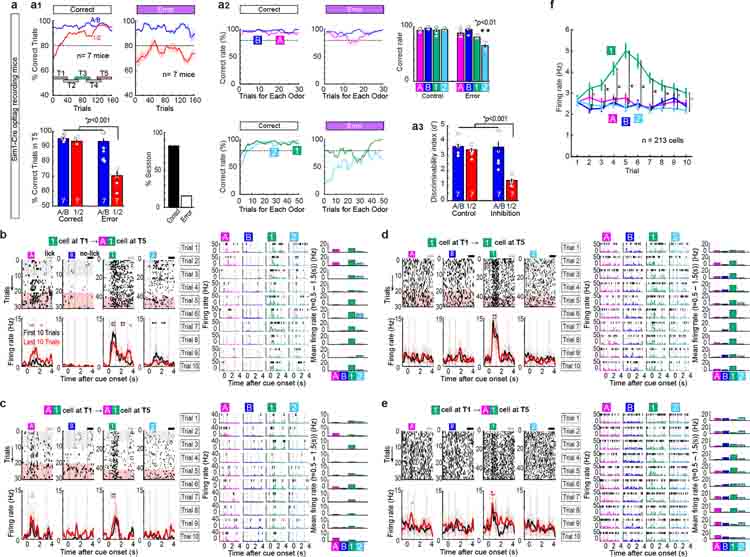
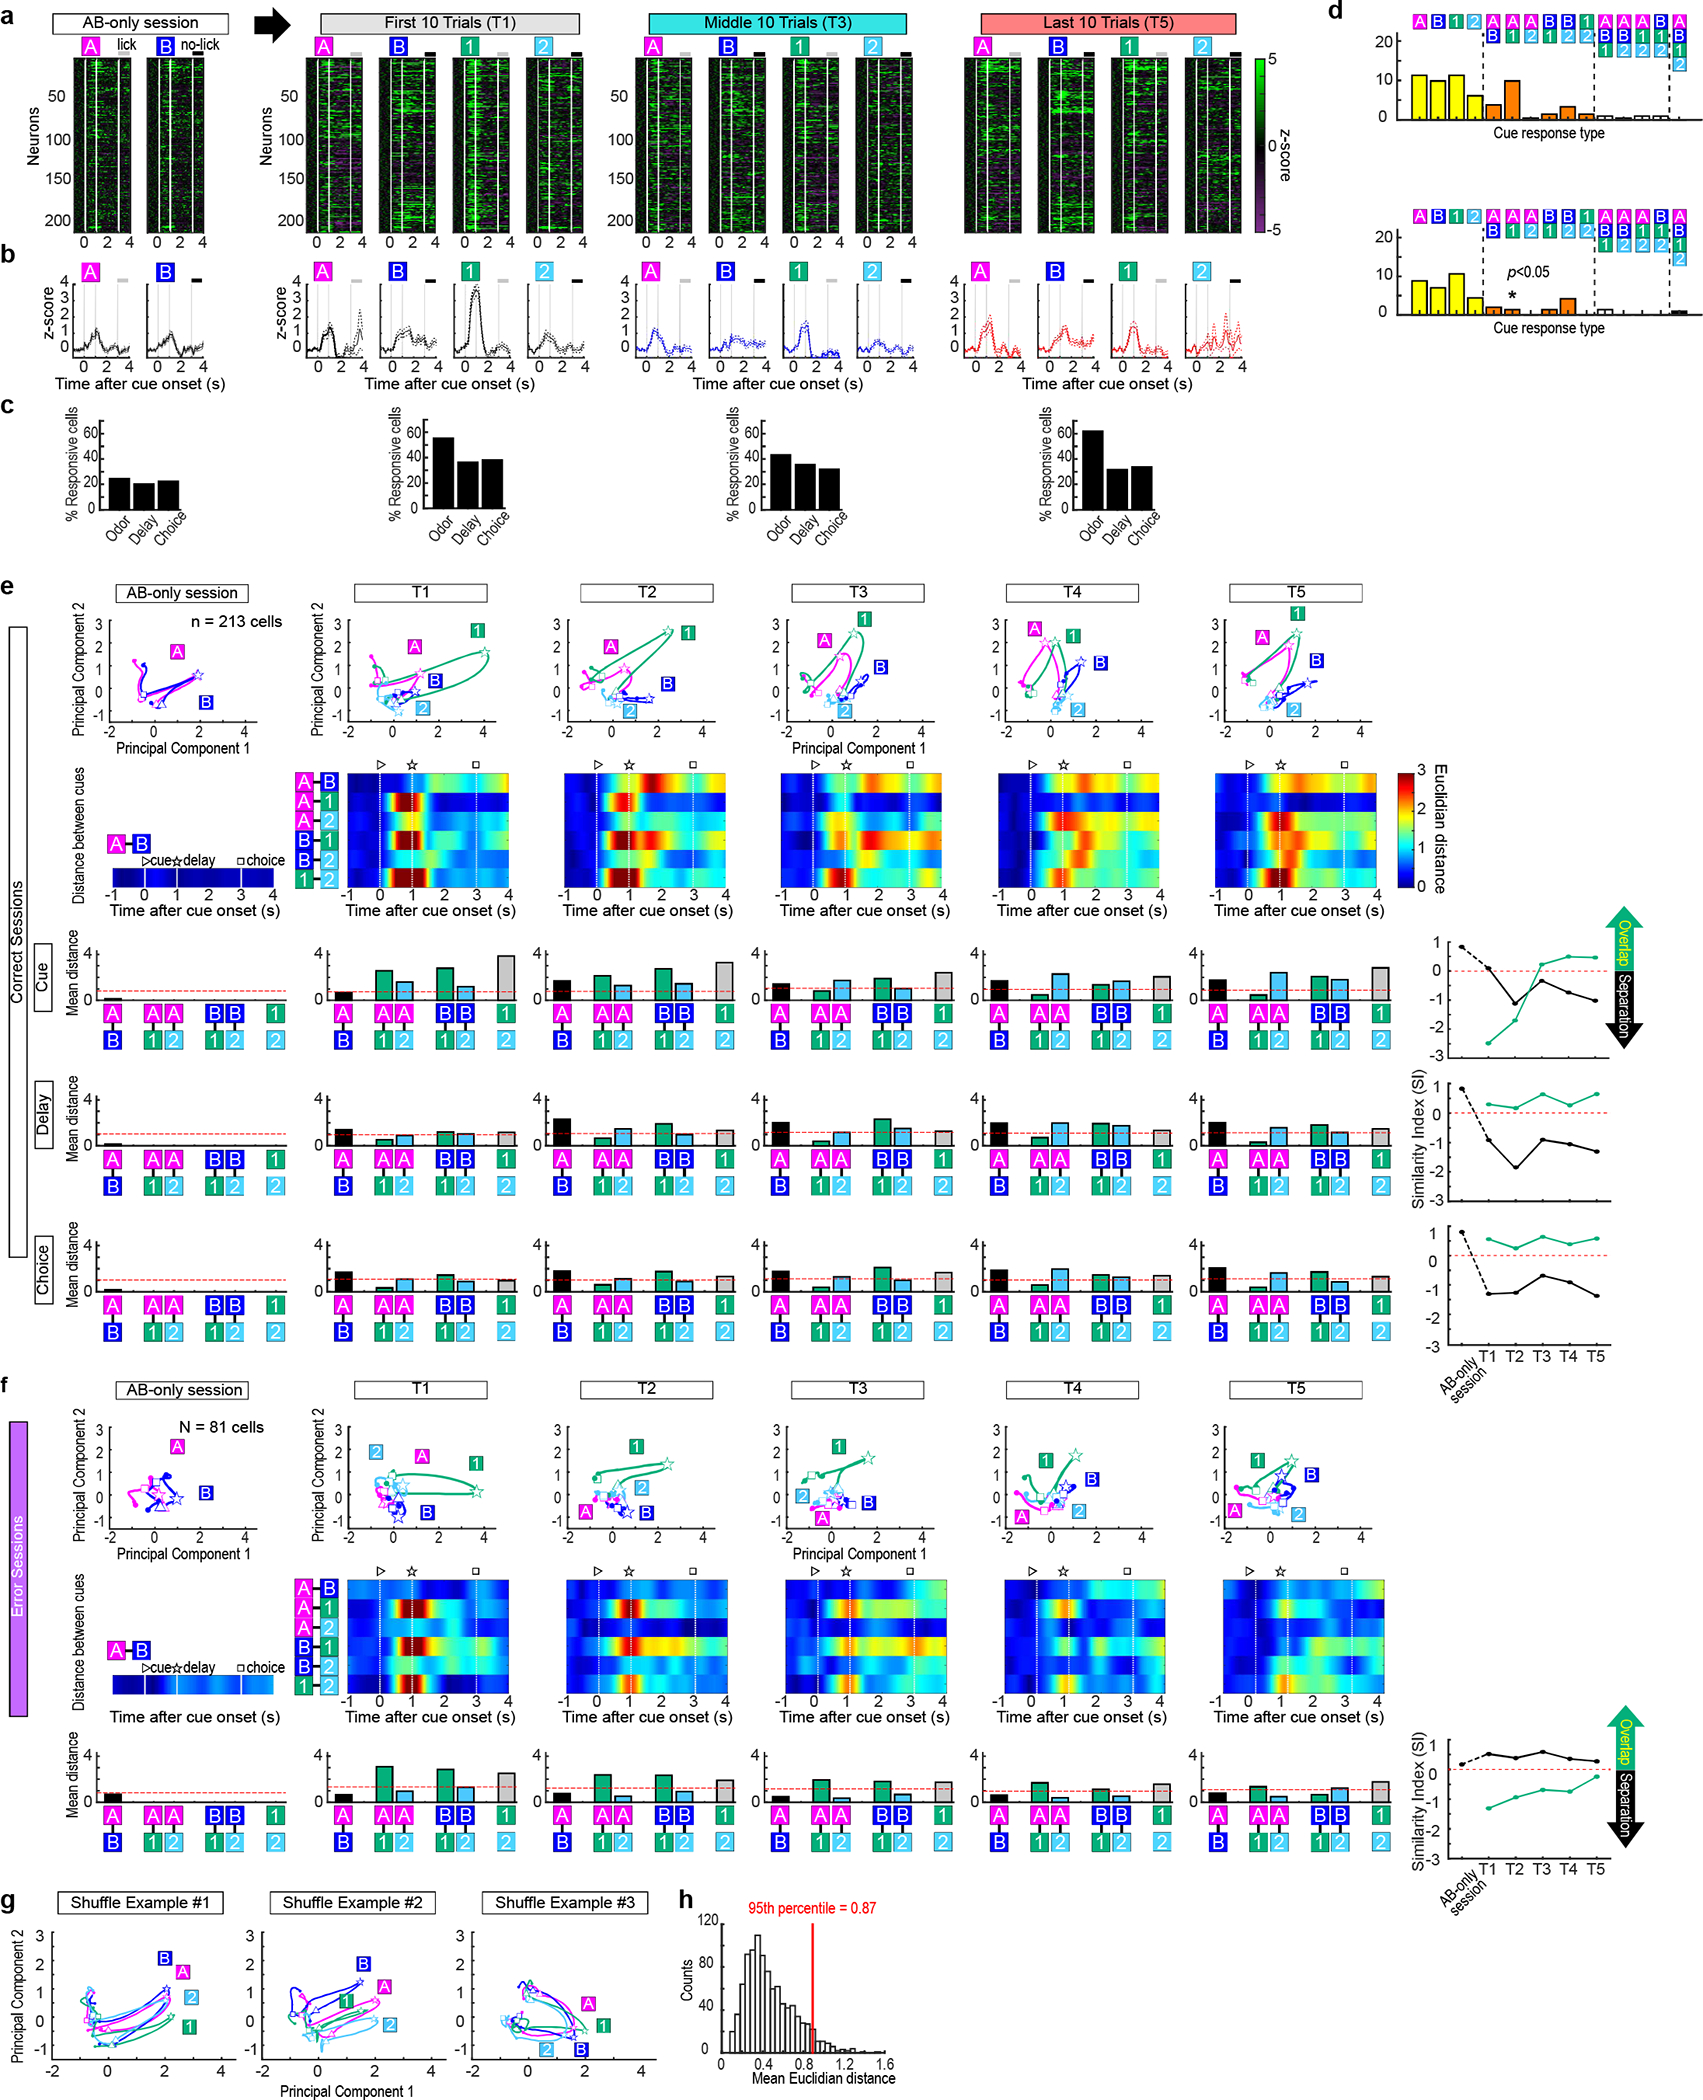
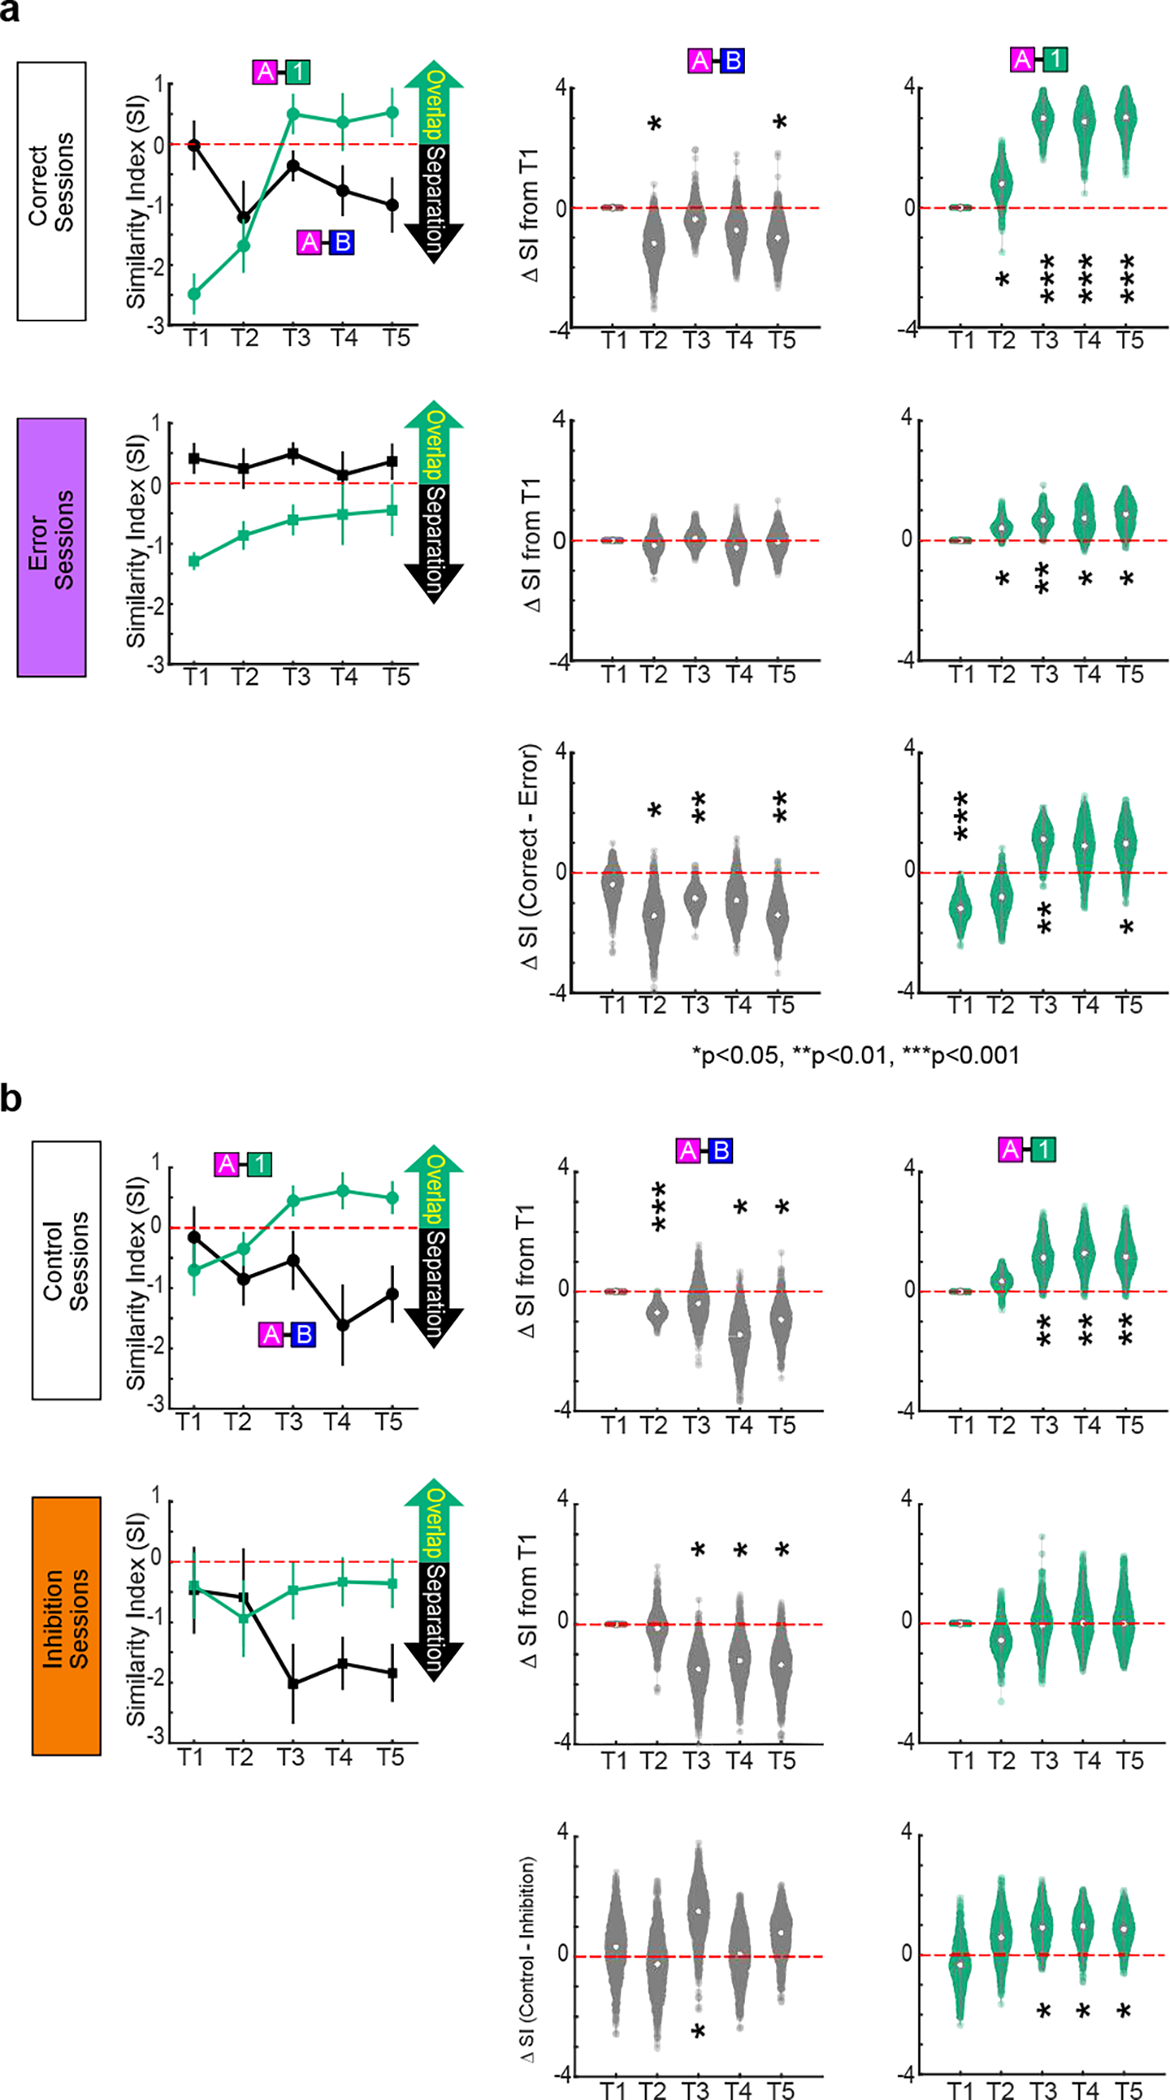
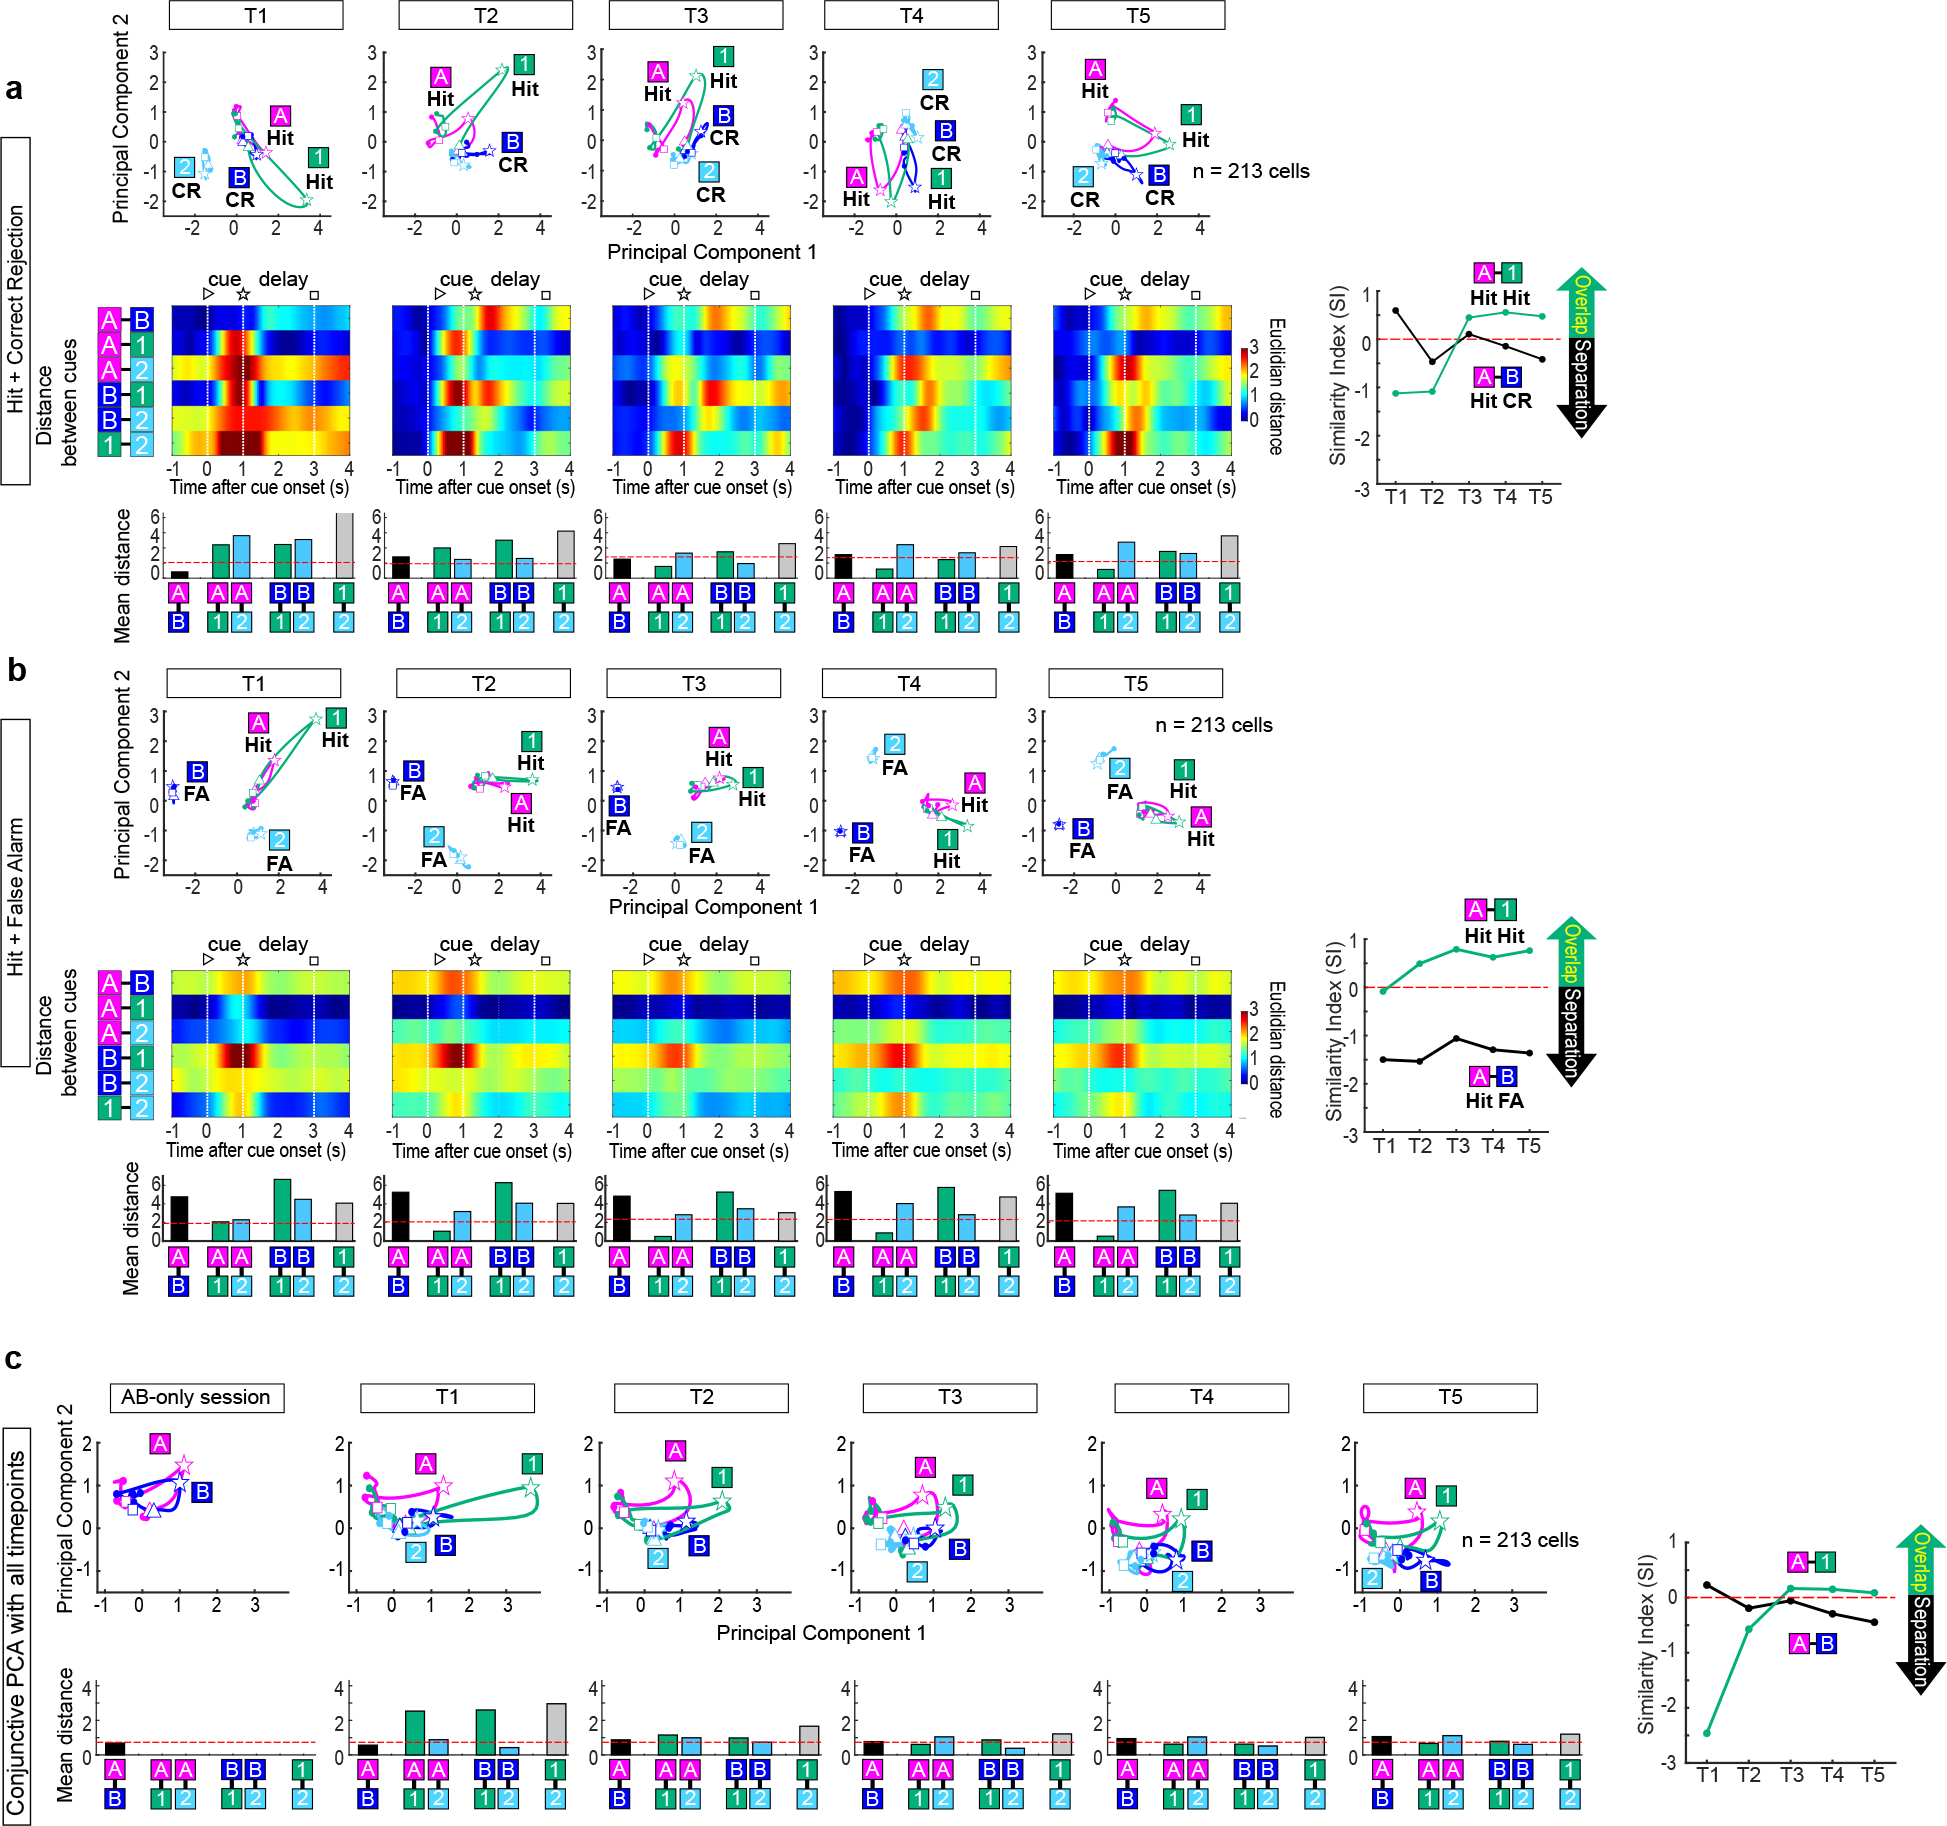
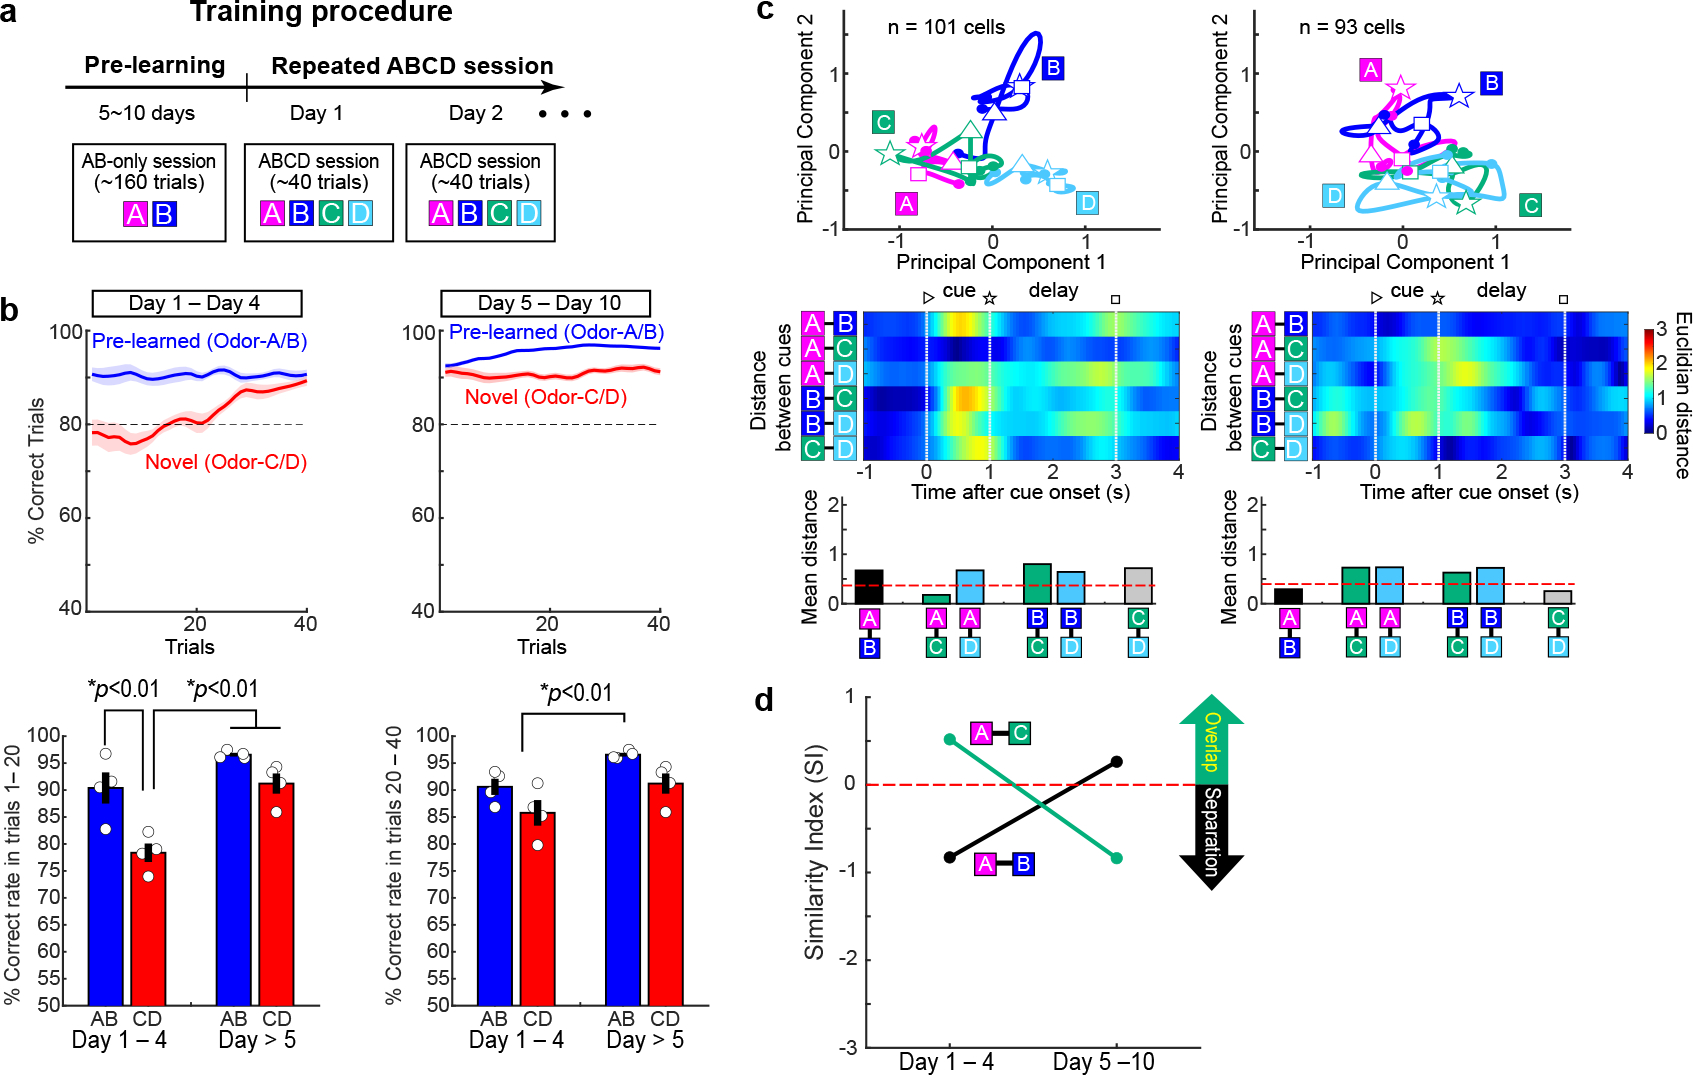
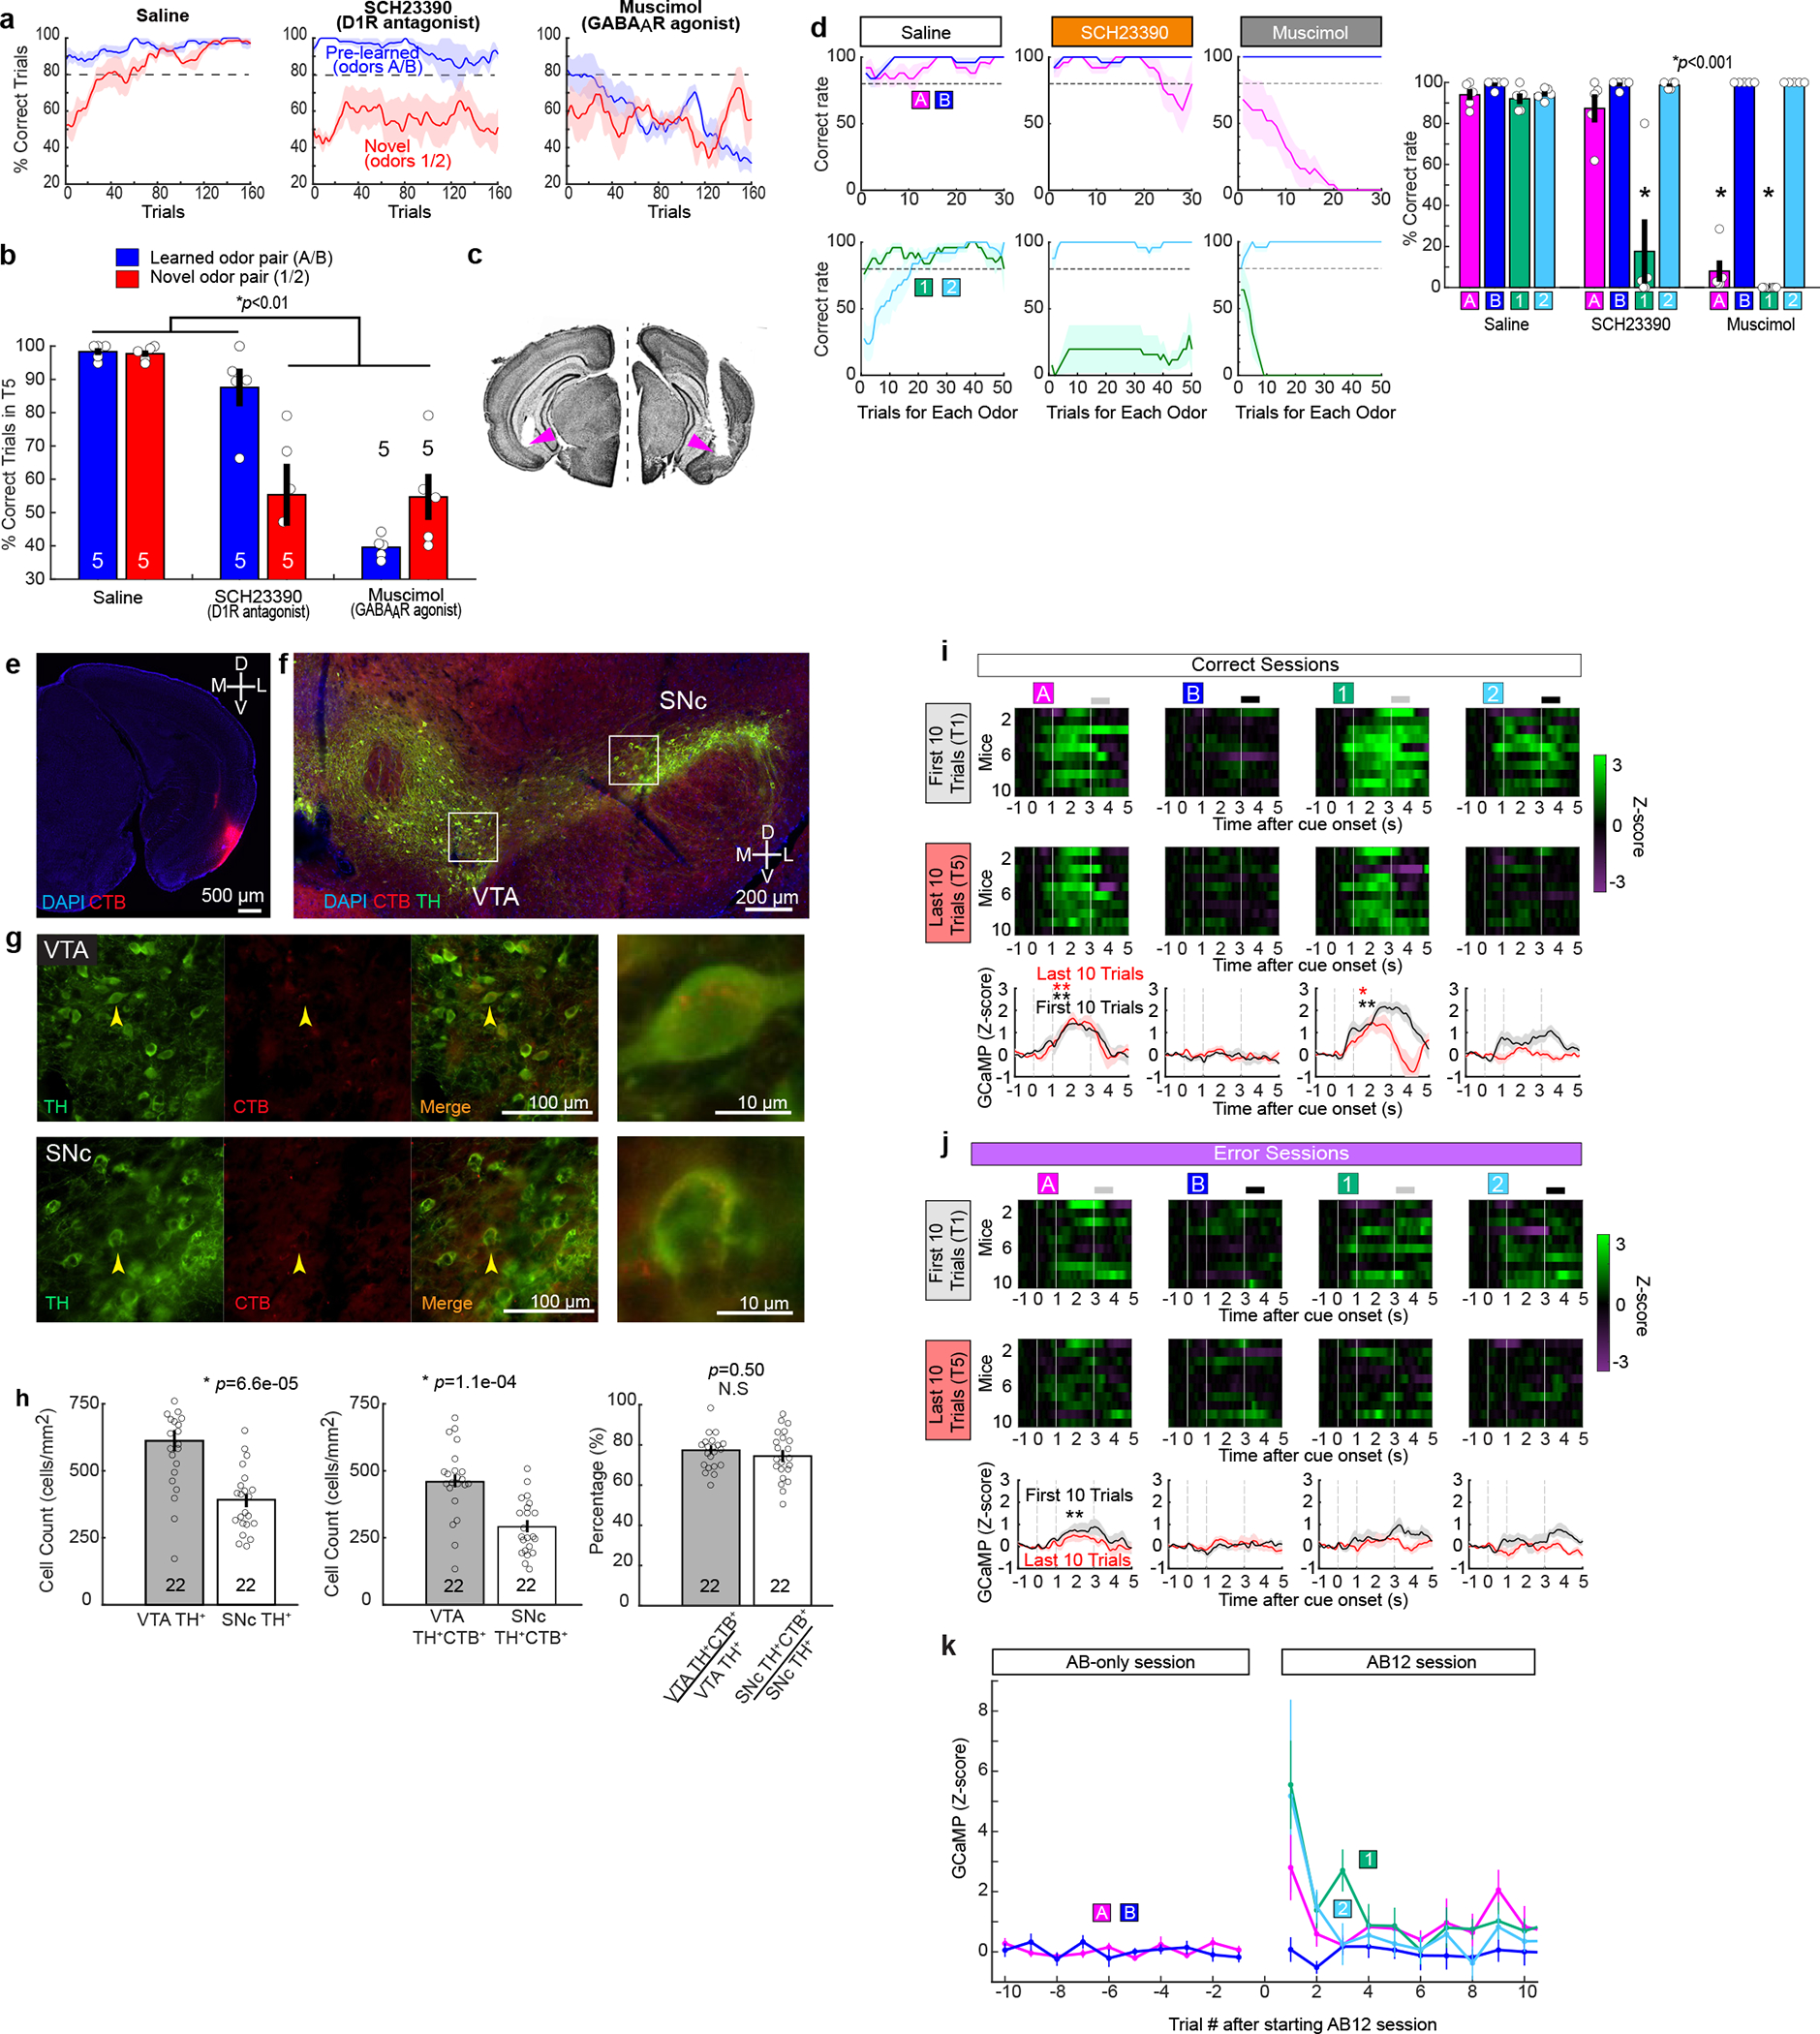
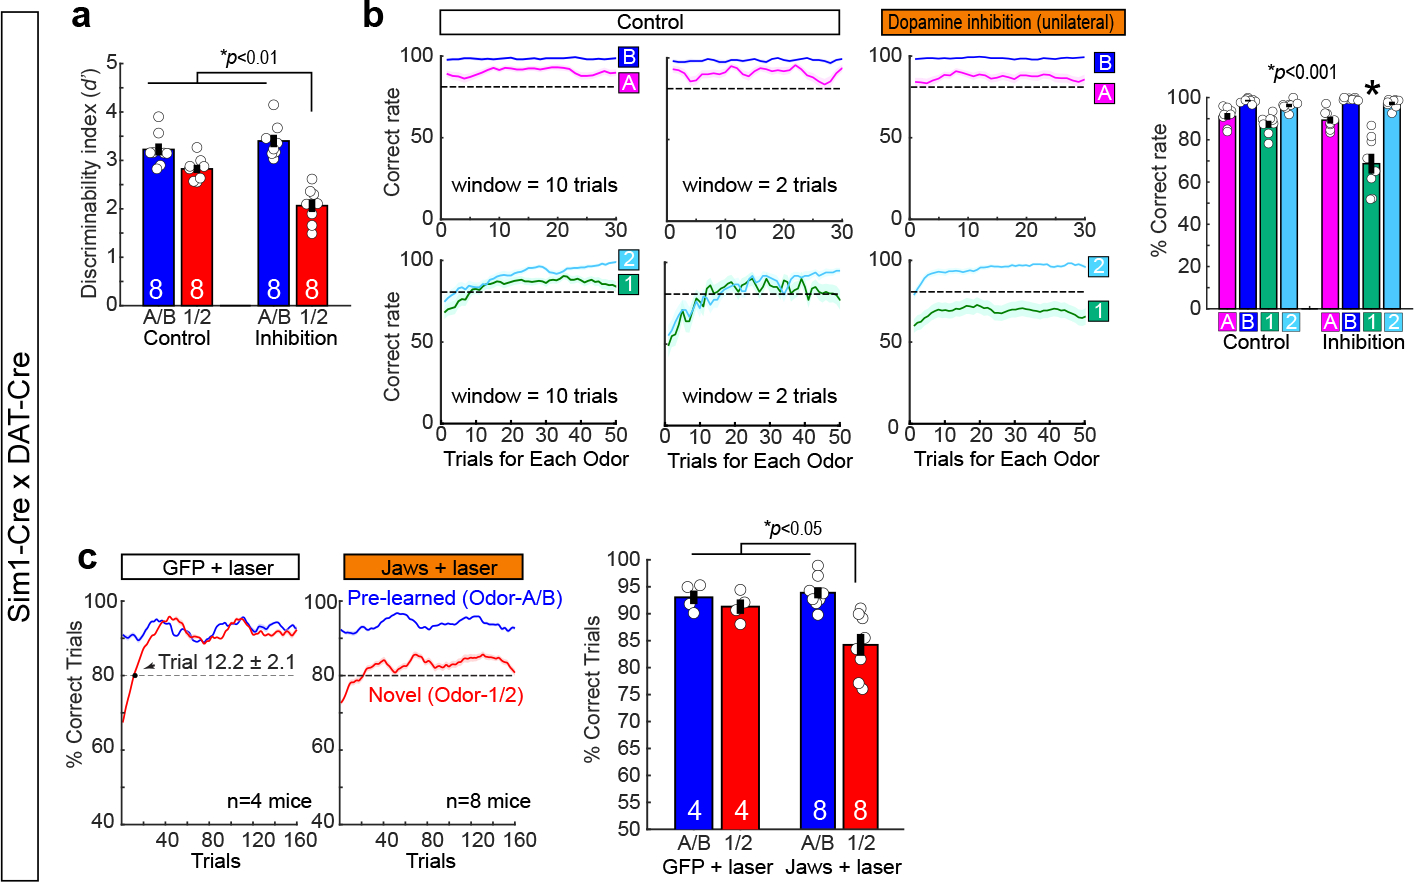
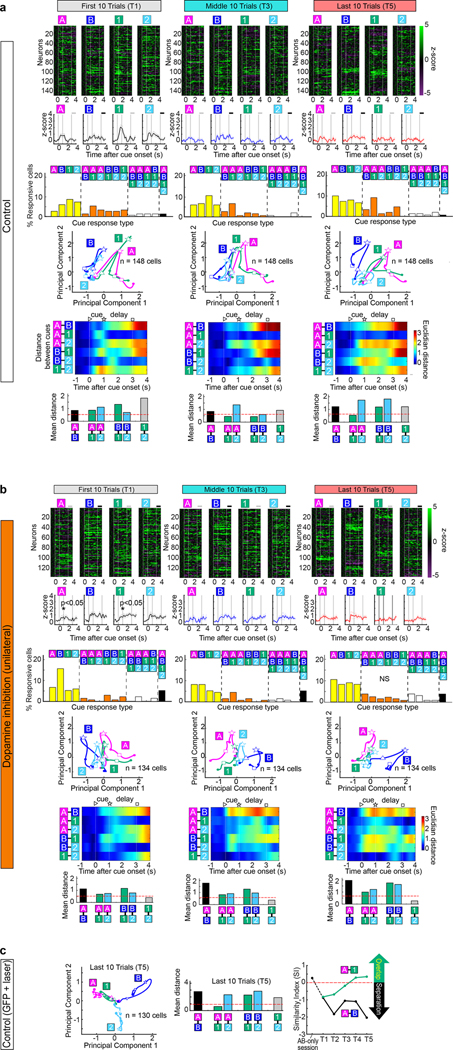
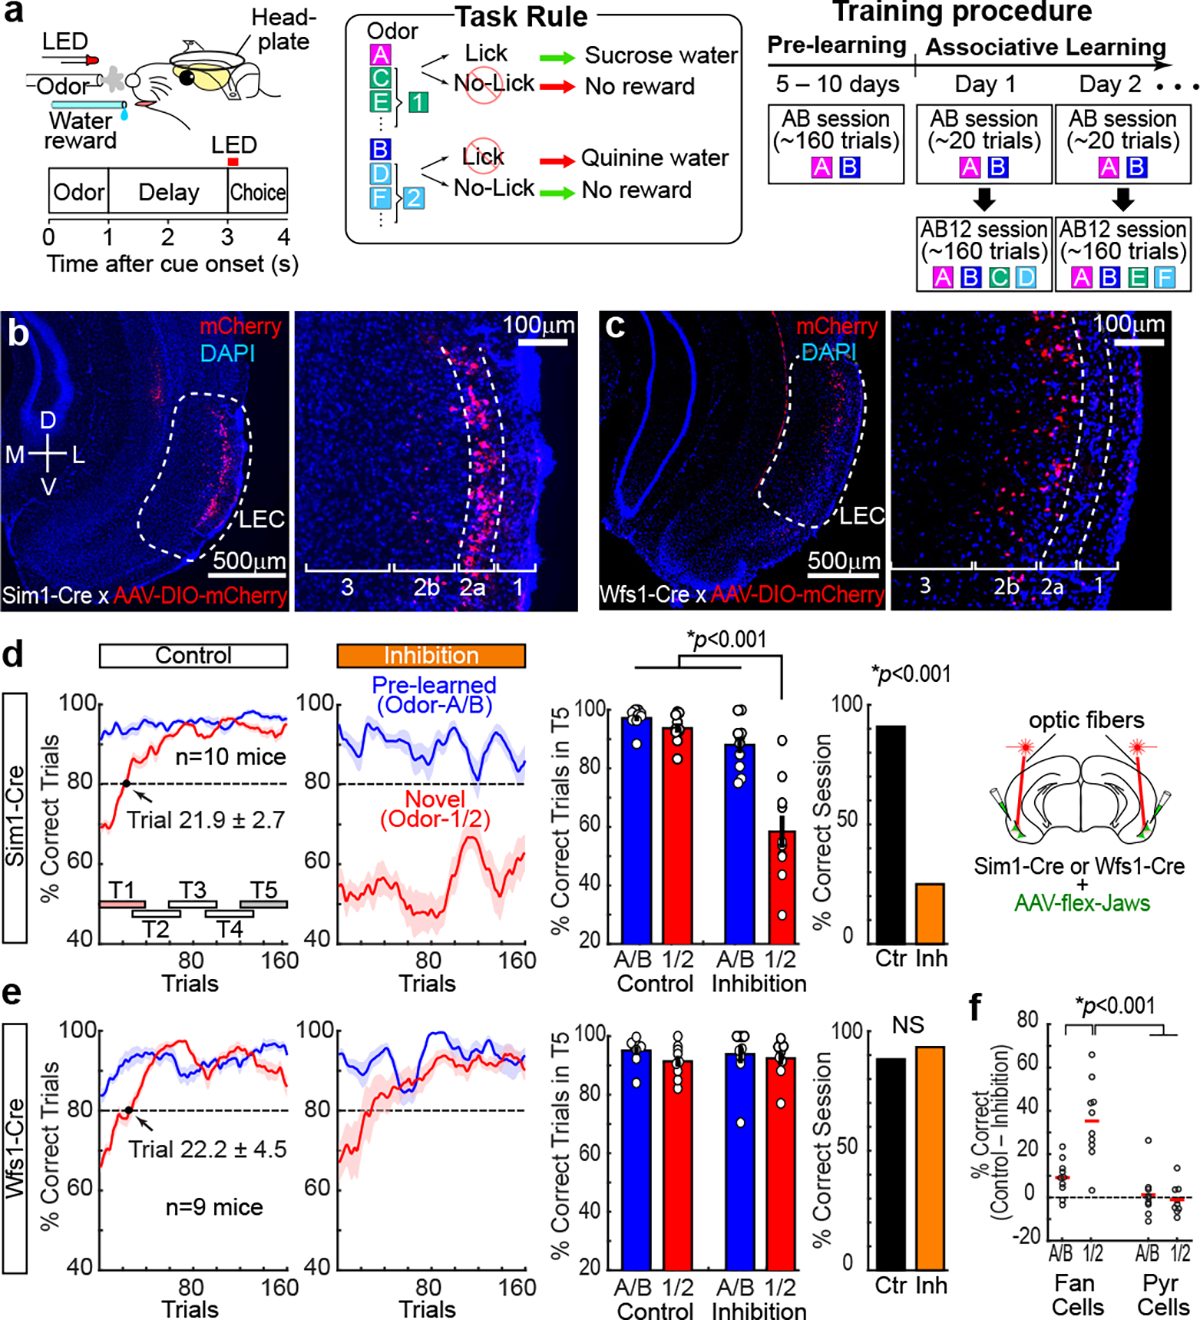
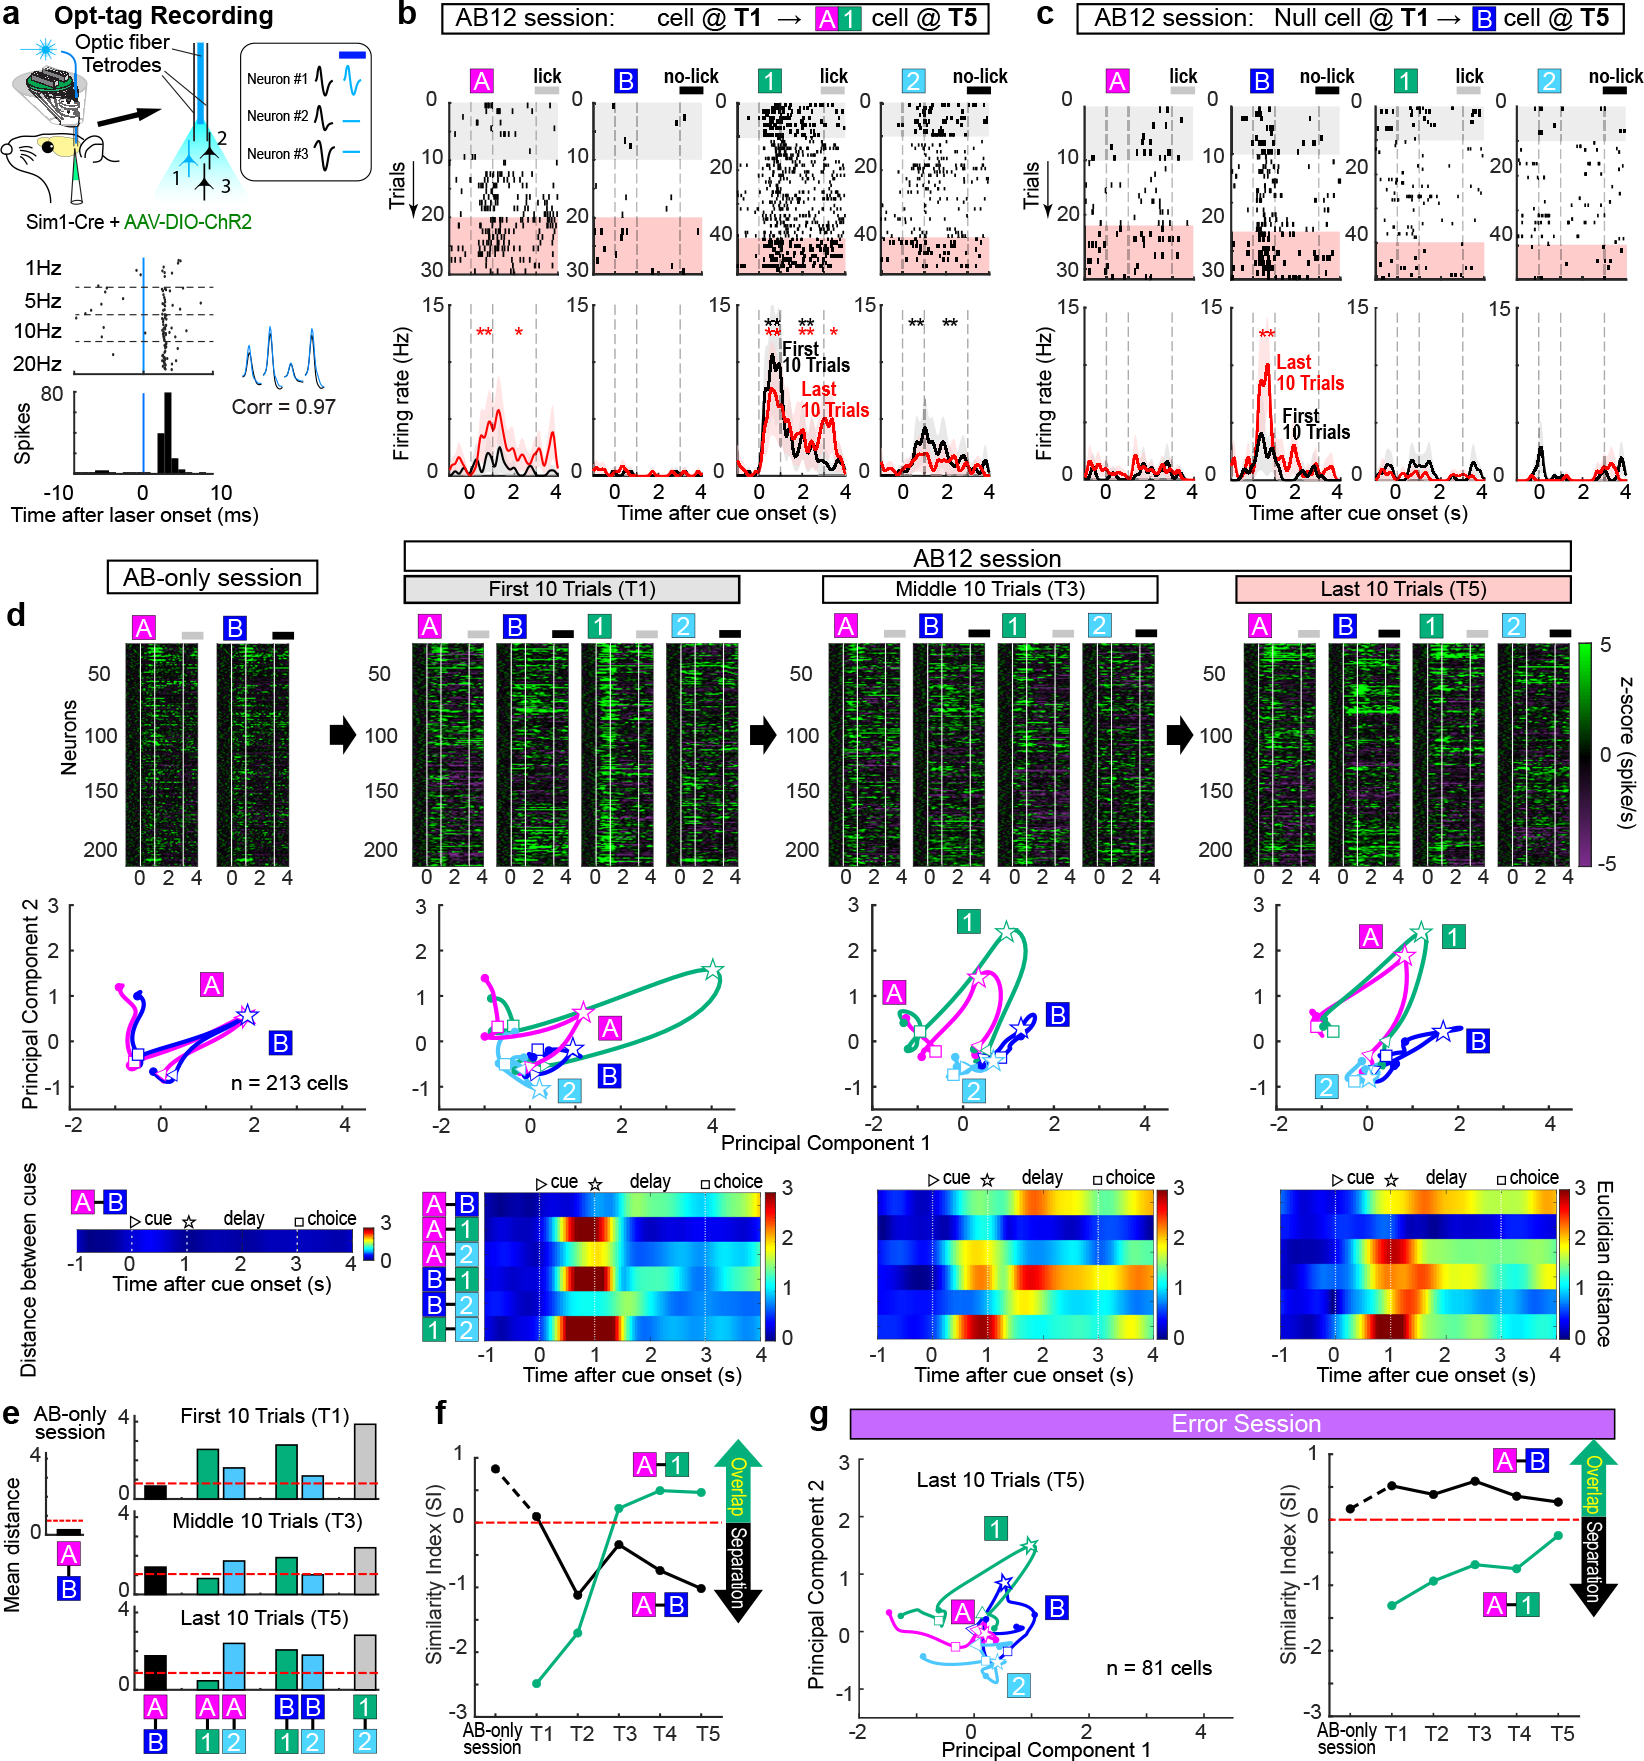
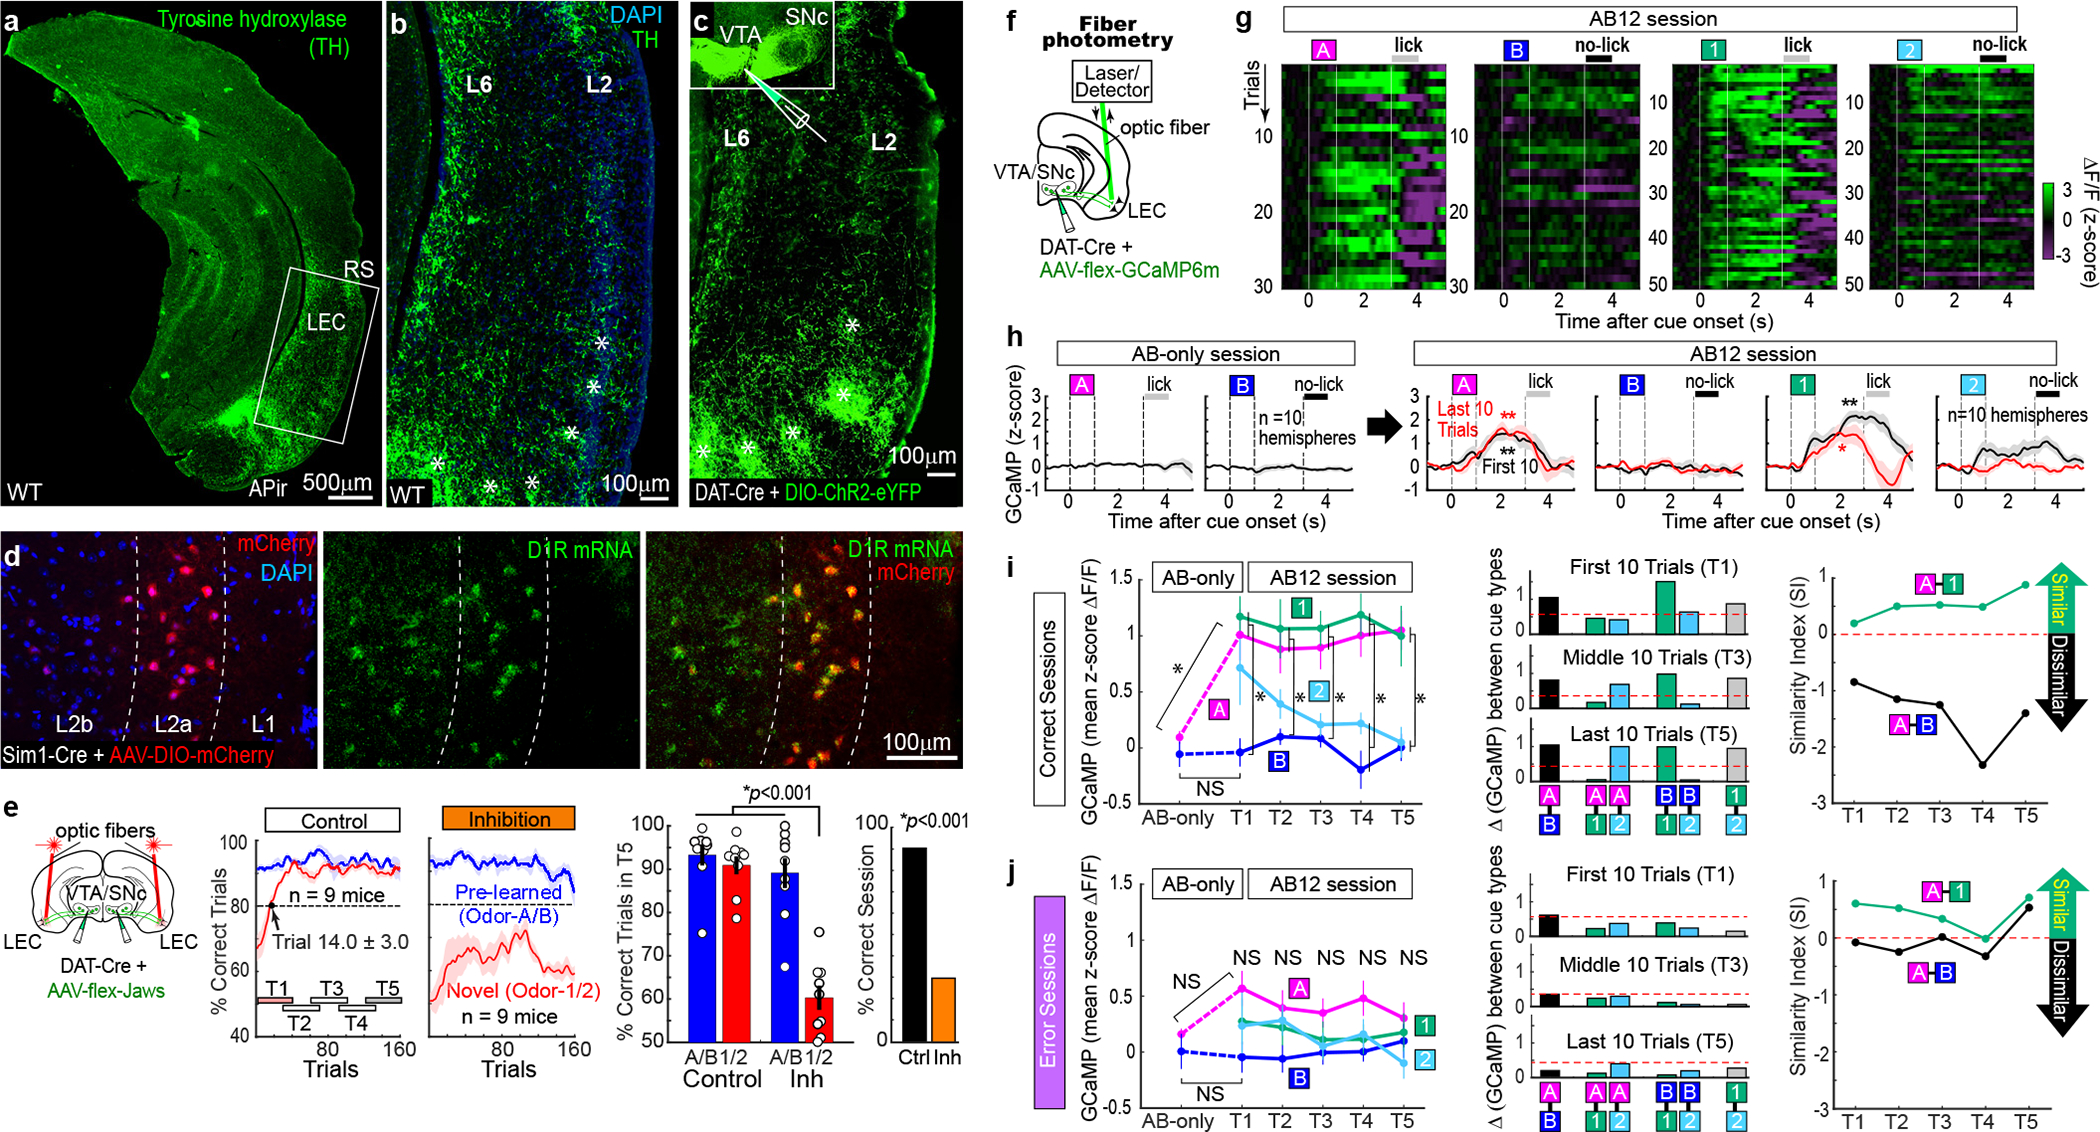
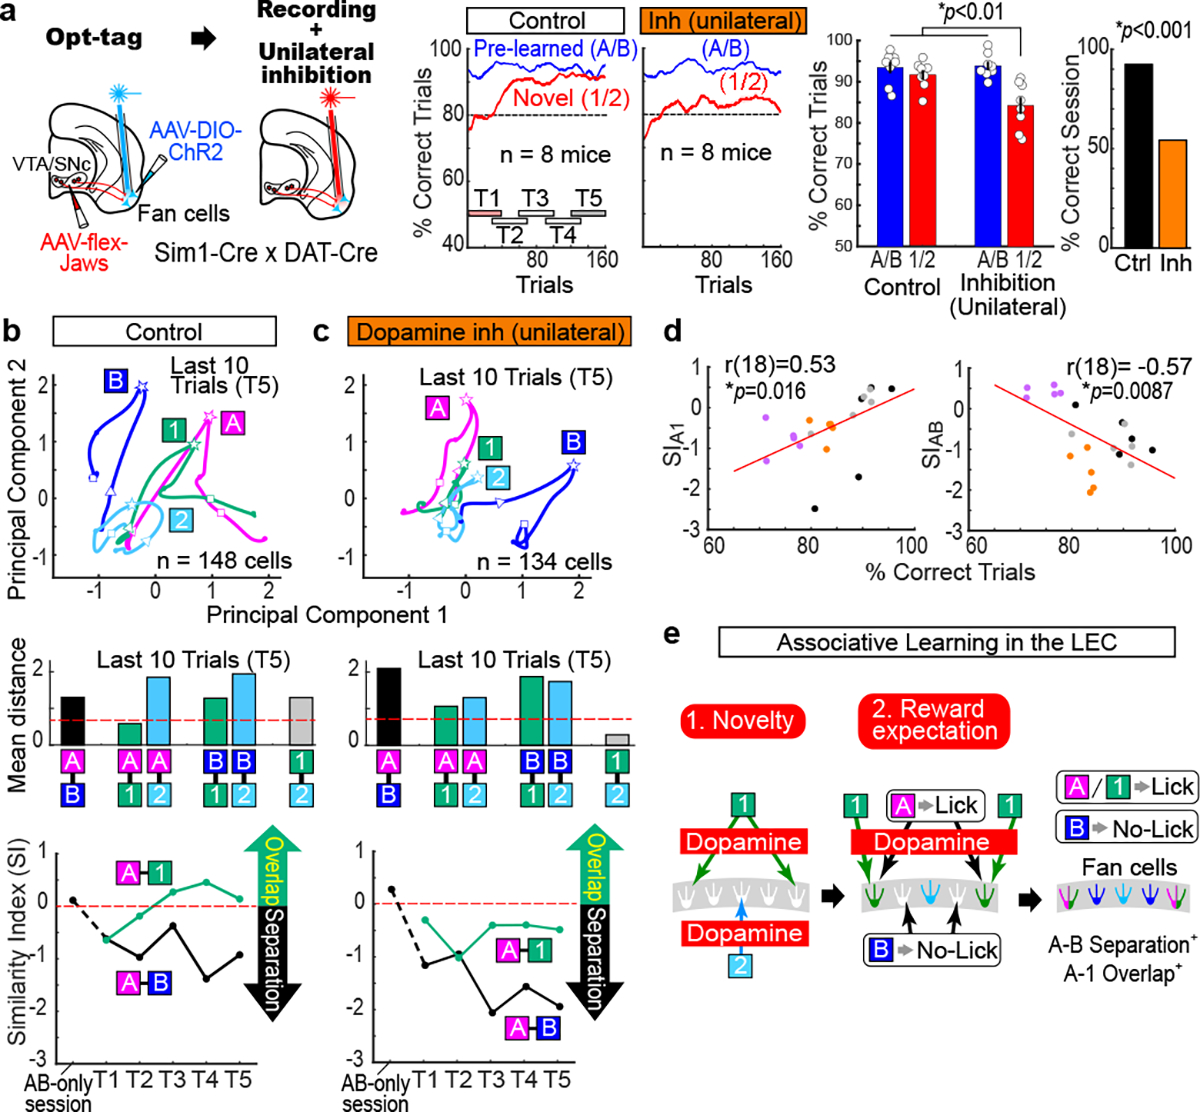
Mounting evidence shows that dopamine in the striatum is critically involved in reward-based reinforcement learning1,2. However, it remains unclear how dopamine reward signals influence the entorhinal-hippocampal circuit, another brain network that is crucial for learning and memory3-5. Here, using cell-type-specific electrophysiological recording6, we show that dopamine signals from the ventral tegmental area and substantia nigra control the encoding of cue-reward association rules in layer 2a fan cells of the lateral entorhinal cortex (LEC). When mice learned novel olfactory cue-reward associations using a pre-learned association rule, spike representations of LEC fan cells grouped newly learned rewarded cues with a pre-learned rewarded cue, but separated them from a pre-learned unrewarded cue. Optogenetic inhibition of fan cells impaired the learning of new associations while sparing the retrieval of pre-learned memory. Using fibre photometry, we found that dopamine sends novelty-induced reward expectation signals to the LEC. Inhibition of LEC dopamine signals disrupted the associative encoding of fan cells and impaired learning performance. These results suggest that LEC fan cells represent a cognitive map of abstract task rules, and that LEC dopamine facilitates the incorporation of new memories into this map.


Conflict of interest statement

Competing interests: The authors declare that they have no competing financial interests.

Figures

Extended Data Figure 1 |
Extended Data Figure 1 |. Histological validation of implanted sites.
(a) Optic fiber positions in the LEC of Sim1-Cre mice injected with AAV-flex-Jaws-GFP for inhibition experiments. Arrowhead, the tip of optic fibers. D, dorsal, V, ventral, M, medial, L, lateral. (b) Optic fiber positions in the LEC of Wfs1-Cre mice for inhibition experiment of Wfs1-expresing pyramidal cells. (c) Recording position in the superficial layer of LEC from Sim1-Cre mice for opt-tagging experiment. Note large lesions because of the electrical lesioning. (d) Optic fiber positions in the LEC of DAT-Cre mice injected with AAV-flex-Jaws-GFP in the VTA/SNc for inhibition experiment. (e) Optic fiber positions in the LEC of DAT-Cre x Ai14 mice for photometry experiment. Two mice received unilateral implantations and four mice received bilateral implantations. (f) Recording position in the superficial layer of LEC from Sim1-Cre x DAT-Cre mice for opt-tagging + inhibition experiment. (g) Optic fiber positions in the LEC of Sim1-Cre mice injected with AAV-flex-GFP for control inhibition experiment. (h) Optic fiber positions in the LEC of Wfs1-Cre mice injected with AAV-flex-GFP for control inhibition experiment. (i) Optic fiber positions in the LEC of DAT-Cre mice injected with AAV-flex-GFP at VTA and SNc for control inhibition experiment. (j) Recording position in the superficial layer of LEC from Sim1-Cre x DAT-Cre mice for opt-tagging (ChR2-mCherry) + control inhibition (GFP) experiment.
Extended Data Figure 2 |
Extended Data Figure 2 |. Performance of mice during associative learning.
(a) A model for LEC dopamine and fan cells in associative learning. When novel cues are presented, LEC dopamine functions as a “detonator” of fan cell activity. Dopamine gradually supplies reward expectation signals only during rewarded Odor-A and Odor-1 trials, serving as a supervising signal so that Odor-A and Odor-1 are represented in the same fan cell population. Odor-B is represented by a fan cell population distinct from Odors-A/1, resulting in A-B separation. Novel unrewarded Odor-2 was not clearly represented in our recorded population. Two types of errors were observed in our study: The spontaneous error where A-B separation and A-1 overlap were both abolished (Fig.2g), and the error observed in the unilateral dopamine inhibition sessions where A-B separation was spared but A-1 overlap was abolished (Fig. 4c). (b) Sim1 and Wfs1 population counts in the LEC. (Top) Reelin immunohistochemistry in Sim1-Cre mice injected with AAV-DIO-mCherry. D, dorsal, V, ventral, M, medial, L, lateral. (Middle) Calbindin immunohistochemistry in Wfs1-Cre mice injected with AAV-DIO-mCherry. (Bottom) From left, density of mCherry-positive neurons in Sim1-Cre and Wfs1-Cre mice, Reelin and Calbindin positive cells, and percentage of mCherry-labeled neurons. (p>0.05, Wilcoxon rank sum test; n = 16 sections obtained from n = 2 mice for each group). (c) We performed an additional experiment to inhibit fan cells during the whole period of pre-learning with Odor-A and Odor-B (these animals are not included in the data in the main figures). After injecting Jaws in Sim1-Cre mice, A/B training was repeated (n = 6 GFP control mice and n = 6 Jaws inhibition mice). Days until animals reached criterion (three consecutive days of reaching 80%) were compared (p = 0.012, Wilcoxon rank sum test). (d) Detailed performance of mice during fan cell inhibition. (d1) Learning curves during control (left) and fan cell inhibition (middle) sessions. In these plots, the data shown in Fig. 1d were plotted for percent correct trials in each odor trial type as a function of trial number for each odor type. (Right) Performance of mice in the last 10 trials (p=6.1e-19, ANOVA; p= 6.0e-8, post-hoc Tukey test; n = 10 mice). (d2) Performance of mice in trials 121–160 as in Fig. 1d, but assessed with discriminability index (D-prime) (p=3.1e-3, ANOVA; p= 1.2e-5 or better, post-hoc Tukey test; n = 10 mice). (d3) We performed control experiment using Sim1-Cre mice injected with AAV-flex-GFP with laser (n = 5 mice). The GFP control experiment showed same result as no-laser control in Fig. 1d (p=0.0028, ANOVA; p= 3.1e-5 or better, post-hoc Tukey test; n = 5 GFP control mice; n = 10 Jaws inhibition mice). (e) Same as (d), but for pyramidal cell inhibition in Wfs1-Cre mice in Fig. 2e (p>0.05, ANOVA; n = 5 GFP control mice; n = 9 Jaws inhibition mice). (g) Same as (d), but for bilateral dopamine inhibition in DAT-Cre mice in Fig. 3e (p=0.0017, ANOVA; p= 2.0e-5 or better, post-hoc Tukey test; n = 4 GFP control mice; n = 9 Jaws inhibition mice). (f) Difference of percent correct sessions between control and inhibition as in Fig. 1f, but plotted for discriminability index (D-prime) (p=0.019, ANOVA; p= 0.0021 or better, post-hoc Tukey test).
Extended Data Figure 3 |
Extended Data Figure 3 |. Performance and spikes in Sim1-Cre mice.
a, Behavioral performance of mice used for fan cell opt-tag recording (Fig. 2). (a1) Learning curves for Odor-A/Odor-B (blue) and Odor-1/Odor-2 (red) during correct sessions where mice acquired the association of Odors1/2 (Correct sessions, top left), and during error sessions where mice did not acquire the new association (Error sessions, top right). (Bottom left) Percent correct trials averaged for trials 121–160 for Odor-A/B trials and Odor-1/2 trials during correct and error sessions (p=6.5e-5, ANOVA; p= 1.7e-6 or better, post-hoc Tukey test; n = 10 mice). (Bottom right) Percent of correct and error sessions. (a2) Learning curves during correct (left) and error (middle) sessions. In these plots, the data shown in (a1) were plotted for percent correct trials in each odor trial type as a function of trial number for each odor type. (Right) Performance of mice in the last 10 trials (p=3.3e-8, ANOVA; p= 0.001 or better, post-hoc Tukey test; n = 10 mice). (a3) Performance of mice in trials 121–160 as in (a1), but assessed with discriminability index (D-prime) (p=1.5e-4, ANOVA; p= 6.4e-6 or better, post-hoc Tukey test; n = 10 mice). b, A representative fan cell shown in Fig. 2b. (Right) Firing frequency in Trials 1 – 10 was plotted. Mean firing frequencies during 0.5 – 1.5 s after cue onset in each trial are shown in the bar graph. c-e, Three additional example fan cells that fired to Odor-1. These cells showed high firing frequency to Odor-1 within 10 trials. f, Mean firing frequency to each odor in trials 1 – 10 in T1. Fan cells showed larger firing frequency to Odor-1 than to other odors starting from trial 2 (n = 213 cells, p=4.1e-30, ANOVA; p<0.05 or better, post-hoc Tukey test).
Extended Data Figure 4 |
Extended Data Figure 4 |. Spike properties of fan cells in Sim1-Cre mice.
(a) – (c), spike properties of fan cells. Fan cells were recorded in a session with Odor-A and Odor-B (AB session). After ~20 trials in AB session, associative learning (AB12) session was tested (T1-T5). T5 in error sessions is also shown. (a) Spike firing of 213 fan cells. Mean spike activity was averaged in 50 ms bins and shown in z-score compared with −1 – 0 s before odor onset. In this panel, cells were sorted using a cluster analysis of firing property in T5. (b) Mean firing rate of 213 fan cells shown in z-score. (c) Percent responsive cells in periods of 0.5–1.5 s (odor), 2–3 s (delay) and 3–4 s (choice) after odor onset. Neurons with significant firing during each period were counted (Wilcoxon signed-rank test, p<0.05). (d) Percent responsive cells in correct T5 (top) and error T5 (bottom). Neurons with significant firing during 0.5–1.5 s after odor onset were counted (Wilcoxon signed-rank test, p<0.05). Asterisk denotes lower percentage of A-1 responsive cells in error T5 than that in correct T5 (p<0.05, chi-square test; p<0.05 for A-1 cells, post-hoc residual test with false discovery rate correction for multiple comparisons). (e) Trajectories of neural firing of fan cell population (top), Euclidian distance between odor trial types (middle) and mean Euclidian distance and Similarity Index during 0.5–1.5 s after odor onset (cue period) for timepoints T1 – T5 of correct sessions (bottom). Ninety-fifth percentile distance obtained from shuffled data denotes significant distance (red line). Data during 2–3 s (delay) and 3–4 s (choice) after odor onset were also plotted. (f) Same as (e), but for error sessions where mice did not learn new associations. (g) Example trajectories obtained from shuffling analysis. Trajectories of neuronal data obtained from three shuffled data in correct T5 sessions are shown. (h) Distribution of mean Euclidian distance obtained from shuffle data in correct T5. Distance obtained from six possible odor pairs were averaged and plotted. A 95th percentile of the distribution (red) was used for the cut-off indicating significant distance.
Extended Data Figure 5 |
Extended Data Figure 5 |. Bootstrapping test for spike Similarity Index
The change of Similarity Index (SI) during associative learning was compared using the bootstrapping method. PCA was performed from a resampled neuronal population, and this procedure was repeated 1000 times to make 1000 bootstraps. SI was calculated for each bootstrap, then SIs in T2 – T5 were subtracted by that in T1, to test if there was a significant distribution above or below zero. (a) (Top) In correct sessions in Fig. 2, SI for Odors A-B showed significant decrease in T5 compared to T1 (p =0.039) whereas SI for Odors A-1 increased (p =1.2e-10), confirming A-B separation and A-1 overlap. (Middle) In the error sessions, no A-B separation was observed (p>0.05). Although A-1 distance decreased during the session (p<0.05), SIAB stayed in negative values. (Bottom) The subtraction of bootstraps in error session from correct sessions confirms the difference in A-1 overlap (p<0.05 in T3 and T5, right). *p<0.05, **p<0.01, ***p<0.001; n = 1000, bootstrapping test. (b) (Top) In dopamine control sessions, SI for Odors A-B showed significant decrease in T5 compared to T1 (p =0.044) whereas SI for Odors A-1 increased (p =0.0082), confirming A-B separation and A-1 overlap. (Middle) In the unilateral inhibition sessions, although A-B separation was observed (p<0.05), no A-1 overlap was observed (p>0.05). (Bottom) The subtraction of bootstraps in inhibition session from control sessions confirms the effect of inhibition on A-1 overlap (p<0.05 in T3 – T5, right). These data suggest that dopamine plays a critical role in establishing A-1 overlapped representations. *p<0.05, **p<0.01, ***p<0.001; n = 1000, bootstrapping test.
Extended Data Figure 6 |
Extended Data Figure 6 |. Additional principal component analyses.
(a) Trajectories of neural firing of fan cell population using only correct (hit) trials for Odor-A and Odor-1 and correct rejection (CR) trials for Odor-B and Odor-2. The separation and overlap of fan cells were again observed when the incorrect trials were removed from the PC analysis. (b) Trajectories of neural firing of fan cell population using only hit trials for Odor-A and Odor-1 and error lick (false alarm, FA) trials for Odor-B and Odor-2. Although all of them are trials in which mice made lick responses, similar overlapped representations between Odors-A and 1, and their separation from Odor-B were observed, suggesting that fan cells do not simply represent lick-related motor information. (c) Principal component analysis (PCA) for 213 fan cells as in Fig. 2d, but using conjunctive PCA with data from all timepoints (AB-only, T1 – T5). The results show similar A-1 overlap and A-B separation as in Fig. 2d.
Extended Data Figure 7 |
Extended Data Figure 7 |. Repeated associative learning using the same odor cues
(a) To test the effect of repeated exposure to the same odor pair during associative learning, sessions with Odor-A, -B, -C and -D were repeated for 10 days in Sim1xDAT mice injected with AAV-flex-GFP (n = 4 mice, without laser). (b) Learning curves between Day 1 – Day 4 and Day 5 – Day 10. In Day 1 – Day 4, animals gradually learned Odor-C and Odor-D as in the regular new association experiment with novel odor pairs. However, after Day 5, animals showed better performance for Odor-C and Odor-D from the initial trials. This was confirmed with increased correct rate for Odor-C/D on trials 1 – 20 in Day 5 – 10 compared to that in Day 1 – 4 (bottom left, p=3.5e-4, ANOVA with post-hoc Tukey test, p= 0.0025). (c) Fan cell trajectories for Odor-A, -B, -C and -D in T5 during Day 1 – Day 4 (left, n=101 cells) and during Day 5 – 10 (right, n = 93 cells). (d) Fan cells showed A-B separation and A-1 overlap in Day 1–4, but this representation disappeared after animals were overtrained. These results further support the idea that fan cells were needed only when new associative memory is formed.
Extended Data Figure 8 |
Extended Data Figure 8 |. Properties of LEC dopamine inputs
a-d, Pharmacological blockade experiments during associative learning. We performed a supplementary pharmacological experiment to validate the optogenetic inhibition experiments using dopamine D1 receptor antagonist SCH23390, or GABAA receptor agonist muscimol. SCH23390 bilateral injection abolished new learning of Odor-1 and Odor-2, while sparing the pre-learned association, replicating the result obtained from the optogenetic inhibition of dopamine fibers (Fig. 3e). Injection of muscimol impaired both the pre-learned association and acquisition of new association, implying an involvement of LEC neurons other than fan cells in the retrieval of pre-learned association. (a) Learning curves during saline, SCH23390 and muscimol infusions. (b) Percent correct sessions during trials 121 – 160 where mice correctly learned new association (p=6.1e-4, ANOVA; 0.0032 or better, post-hoc Tukey test; n = 5 mice) (c) Example histology from cannula implantations. (d) Learning curves during saline (left), SCH23390 (middle) and muscimol (right) sessions. In these plots, the data shown in (a) were plotted for percent correct trials in each odor trial type as a function of trial number for each odor type. (Right) Performance of mice in the last 10 trials (p=1.3e-15, ANOVA; p = 2.2e-7, post-hoc Tukey test; n = 5 mice). e-h, Retrograde tracing of LEC dopaminergic fibers from VTA and SNc (e) Coronal section of the right hemisphere including LEC, where the retrograde tracer cholera toxin B (CTB, red) was injected. (f) Coronal section of the right hemisphere midbrain including VTA and SNc. Anti-tyrosine hydroxylase (TH, green) immunostaining reveals dopaminergic cells. (g) Magnified windows from (f). Yellow arrows point to example cells expressing both TH and CTB, which are further magnified in the rightmost panels. (h) From left, density of TH-expressing neurons in VTA and SNc, TH+CTB+ population between VTA and SNc, percentage of double-positive neurons among TH+ neurons. Although VTA has more cells for both TH+ and TH+CTB+ neurons (p<0.001, Wilcoxon rank sum test), the percentage of CTB+ neurons did not differ between VTA and SNc (p=0.50, Wilcoxon rank sum test; n = 22 sections obtained from n = 3 mice). i-k, Calcium imaging of dopamine inputs. (i) Calcium signals from individual hemisphere (n=10) during first 10 trials (T1, top) and last 10 trials (middle, T5) in correct sessions. Mean traces are shown at the bottom for T1 (black) and T5 (red). *p<0.05 and **p<0.01, Wilcoxon signed-rank test during 0.5 – 3 s after cue onset compared with 1-s pre-cue period. (j) Same as (b), but for error sessions. (k) Plot of GCaMP calcium signal as a function of trial number after starting AB12 session (n=10 hemispheres).
Extended Data Figure 9 |
Extended Data Figure 9 |. Dopamine unilateral inhibition during fan cell recording.
(a) Performance of mice during unilateral dopamine inhibition. (Left) Performance of mice in trials 121–160 as in Fig. 4a, but assessed with discriminability index (D-prime) (p=5.1e-4, ANOVA; p=9.6e-3 or better, post-hoc Tukey test; n = 8 mice). (Middle) Learning curves during control (left) and unilateral dopamine inhibition (right) sessions. In these plots, the data shown in Fig. 4a were plotted for percent correct trials in each odor trial type as a function of trial number for each odor type. Plot using 2-trial moving window is also shown for control sessions. (Right) Performance of mice in the last 10 trials (p=6.5e-6, ANOVA; p= 0.046 or better, post-hoc Tukey test; n = 10 mice). In the unilateral dopamine inhibition experiments, each mouse (n = 8) had 10 – 16 inhibition sessions. Of them, percentage of correct sessions (i.e. #correct sessions/(#correct sessions + #error sessions) ) were 46.6%, 55.6%, 43.3%, 50.0%, 54.7%, 53.6%, 53.6%, and 42.8%. (b) We performed control experiments using DAT-Cre mice injected with AAV-DIO-ChR2 and AAV-flex-GFP for unilateral opt-tagging and laser control (n = 4 mice). The GFP control experiment showed same result as no-laser control in Fig. 4a (p=0.035, ANOVA; p= 0.044 or better, post-hoc Tukey test; n = 4 GFP control mice; n = 8 Jaws inhibition mice).
Extended Data Figure 10 |
Extended Data Figure 10 |. Firing property of fan cells during dopamine unilateral inhibition
(a) Firing property of fan cells in the no-laser control sessions obtained from Sim1xDAT mice (n = 148 cells). (Top to bottom) Z-scored firing rates, mean firing rate, percent cells for each response type, PCA trajectories, Euclidian distance and mean Euclidian distance are shown as in Fig. 2d. (b) Same as (a), but for fan cells during unilateral dopamine inhibition (n = 134 cells). Mean firing rates for Odor-A and Odor-1 were lower than control in T1 (p<0.05, Wilcoxon rank sum test). No difference was observed for the distribution of responsive type in T5 between control and inhibition (p=0.24, chi-square test). (c) Trajectories, mean Euclidian distance and SI of fan cells as in Fig. 4b, but from GFP control animals (n=130 cells).
Figure 1.
Figure 1.. LEC fan cells, but not pyramidal cells, were necessary for associative learning
(a) Head-fixed mice learned association between odor cues and licking for sucrose water reward. During associative learning sessions, animals were tested with AB-only and AB12 sessions with novel odors (C/D, E/F, or G/H …). Novel odors are collectively referred to as Odor-1 and Odor-2 in subsequent figures. (b) Sim1+ fan cells in LEC layer 2a of a coronal section of Sim1-Cre mouse injected with AAV-DIO-mCherry. D, dorsal, V, ventral, M, medial, L, lateral. (c) Wfs1+ pyramidal cells in LEC layer 2b. (d) Inhibition of Sim1+ fan cells. (Left) Correct trial rate for pre-learned odors (A/B, blue) and novel odors (1/2, red) in control and inhibition sessions. Trial number that surpassed 80% criteria (dot), and timepoints T1-T5 (rectangles) are shown. (Middle) Percent correct in T5 (p=2.3e-4, ANOVA; p= 2.1e-8 or better, post-hoc Tukey test; n = 10 mice). (Right) Percent sessions where mice correctly learned new association (p=4.1e-10, binomial test). (e) Same as (d), but for inhibition of Wfs1+ pyramidal cells (p=0.60, ANOVA; n = 9 mice). (f) Difference of performance between control and inhibition showing the effect of inhibition only on Odor-1/2 trials in fan cell inhibition group (p=8.8e-4, ANOVA; p= 1.3e-4 or better, post-hoc Tukey test; n = 10 Sim1 and n = 9 Wfs1 mice). All data in mean ± SEM.
Figure 2.
Figure 2.. LEC fan cells encoded cue-reward association during learning
(a) Opt-tag recording of Sim1+ fan cells. Fan cells expressing Channelrhodopsin2 (ChR2) showed spike response to blue laser stimulation (see Methods). (b) An example LEC fan cell showing constant firing for Odor-1 trials during an AB12 associative learning session. This cell increased firing for Odor-A, but decreased for Odor-2 (*p<0.05, **p<0.01 during cue, delay and choice, Wilcoxon signed-rank test). Black trace, first 10 trials. Red trace, last 10 trials. (c) An example LEC fan cell that increased firing for Odor-B. All data in mean ± SEM. (d) (Top) Spike firing rate of n = 213 fan cells shown in z-score during AB-only session and first 10 (T1), middle 10 (T3) and last 10 (T5) trials of AB12 session. (Middle) PCA trajectory of fan cell activity for each odor type (▷ cue-onset; ☆ cue-offset/delay-onset; □ delay-offset). (Bottom) Euclidian distance between odor types. (e) Mean Euclidian distance during 0.5 – 1.5 s after cue onset. Ninety-fifth percentile distance obtained from shuffled data denotes significant distance (red line). (f) Similarity index (SI) between Odor-A and -B, and between Odor-A and −1 during the learning. Positive SI denotes overlap of representation, whereas negative SI denotes separation (see text). (g) Same as (d) and (f), but for error sessions where mice did not learn new association (n = 81 cells).
Figure 3.
Figure 3.. LEC dopamine fibers sent novelty-induced reward expectation signals
(a) Anti-tyrosine hydroxylase (TH) immunohistochemistry in wild type (WT) mice showing TH positive fibers in the LEC. RS: rhinal sulcus. APir: Amygdalopiriform transition area. (b) The LEC receives TH+ fibers in layers (L) 2 and 6. The LEC has dense patches of TH+ fibers in the ventral part (asterisks). (c) Dopaminergic axons in the LEC revealed by injection of AAV-DIO-ChR2-eYFP in the VTA and SNc of DAT-Cre mice. (d) In situ hybridization of dopamine receptor D1R mRNA in LEC fan cells. (e) Same behavior plots as in Fig. 1d, but for inhibition of dopamine fibers in the LEC using AAV-flex-Jaws injected in the VTA/SNc of DAT-Cre mice. (Left) LEC dopamine inputs were required for the acquisition, but not for the retrieval of association. (Middle) p=3.1e-5, ANOVA; p= 1.0e-7 or better, post-hoc Tukey test; n = 9 mice. (Right) p=6.0e-11, binomial test. (f) Optic fiber photometry of calcium signals from dopamine fibers in the LEC. (g) An example recording of GCaMP signals from LEC dopamine fibers shown in z-score. (h) GCaMP signals in AB-only session and first 10 trials (T1) and last 10 trials (T5) of AB12 session (n = 10 hemispheres). *p<0.05 and **p<0.01, Wilcoxon signed-rank test during 0.5 – 3 s after cue onset compared with 1-s pre-cue period. (i) (Left) Mean GCaMP signals during 0.5 – 3 s after cue onset during learning. (Odor A from AB-only to T1: p=0.03, ANOVA; p=0.02 or better, post-hoc Tukey test; Odors A/B/1/2 in T1 – T5: p=1.2e-18, ANOVA; p=0.04 or better, post-hoc Tukey test. (Middle) Absolute difference in GCaMP signal amplitude obtained from (i). (Right) Similarity Index calculated from difference in GCaMP signals between Odor-A and -B and between Odor-A and −1 during the learning. (j) Same as (i), but for error sessions. n = 10 hemispheres. All data in mean ± SEM.
Figure 4.
Figure 4.. Inhibition of dopamine inputs impaired the cue-reward encoding of LEC fan cells
(a) Opt-tagging was followed by dopamine fiber inhibition using an optic fiber implanted unilaterally in the LEC. Jaws and ChR2 was expressed in the VTA/SNc and LEC, respectively, of Sim1-Cre x DAT-Cre mice. Same behavior plots as in Fig. 1d, but for unilateral dopamine fiber inhibition. (Left) p=0.011, ANOVA; p= 0.006 or better, post-hoc Tukey test; n = 8 mice. (Right) p=2.5e-11, binomial test. All data in mean ± SEM. (b) (Top) Trajectories of n = 148 fan cells in the last 10 trials of control sessions (Control T5). (Middle) Mean Euclidian distance in control T5 with shuffle distance (red). (Bottom) Similarity Index during control T5. (c) Same as (b), but for unilateral dopamine inhibition sessions (n = 134 cells). (d) (Left) Similarity Index (SI) between Odor-A and −1 as a function of behavior performance. Each point represents data obtained from five timepoints (T1 – T5) x 4 session types [Correct sessions (black) or Error sessions (purple) in Fig. 2 and Control sessions (gray) or Unilateral dopamine inhibition session (orange)]. (Right), same as in (Left), but for SI between Odor-A and Odor-B. p=0.016 and p=8.7e-3, Pearson correlation; n = 20 time points. (e) LEC dopamine and fan cells in associative learning (see text).

References

    1. Schultz W, Dayan P & Montague PR A neural substrate of prediction and reward. Science 275, 1593–1599, doi:10.1126/science.275.5306.1593 (1997). - DOI - PubMed
    1. Watabe-Uchida M, Eshel N & Uchida N Neural Circuitry of Reward Prediction Error. Annu Rev Neurosci 40, 373–394, doi:10.1146/annurev-neuro-072116-031109 (2017). - DOI - PMC - PubMed
    1. Scoville WB & Milner B Loss of recent memory after bilateral hippocampal lesions. Journal of neurology, neurosurgery, and psychiatry 20, 11–21 (1957). - PMC - PubMed
    1. Squire LR Memory and the hippocampus: a synthesis from findings with rats, monkeys, and humans. Psychological review 99, 195–231 (1992). - PubMed
    1. Buzsaki G & Moser EI Memory, navigation and theta rhythm in the hippocampal-entorhinal system. Nature neuroscience 16, 130–138, doi:10.1038/nn.3304 (2013). - DOI - PMC - PubMed

Publication types