Review
. 2022 Mar;20(3):143-160.
doi: 10.1038/s41579-021-00621-9. Epub 2021 Sep 22.

Mass spectrometry-based metabolomics in microbiome investigations

Affiliations
Review

Mass spectrometry-based metabolomics in microbiome investigations

Anelize Bauermeister et al. Nat Rev Microbiol. 2022 Mar.

Abstract

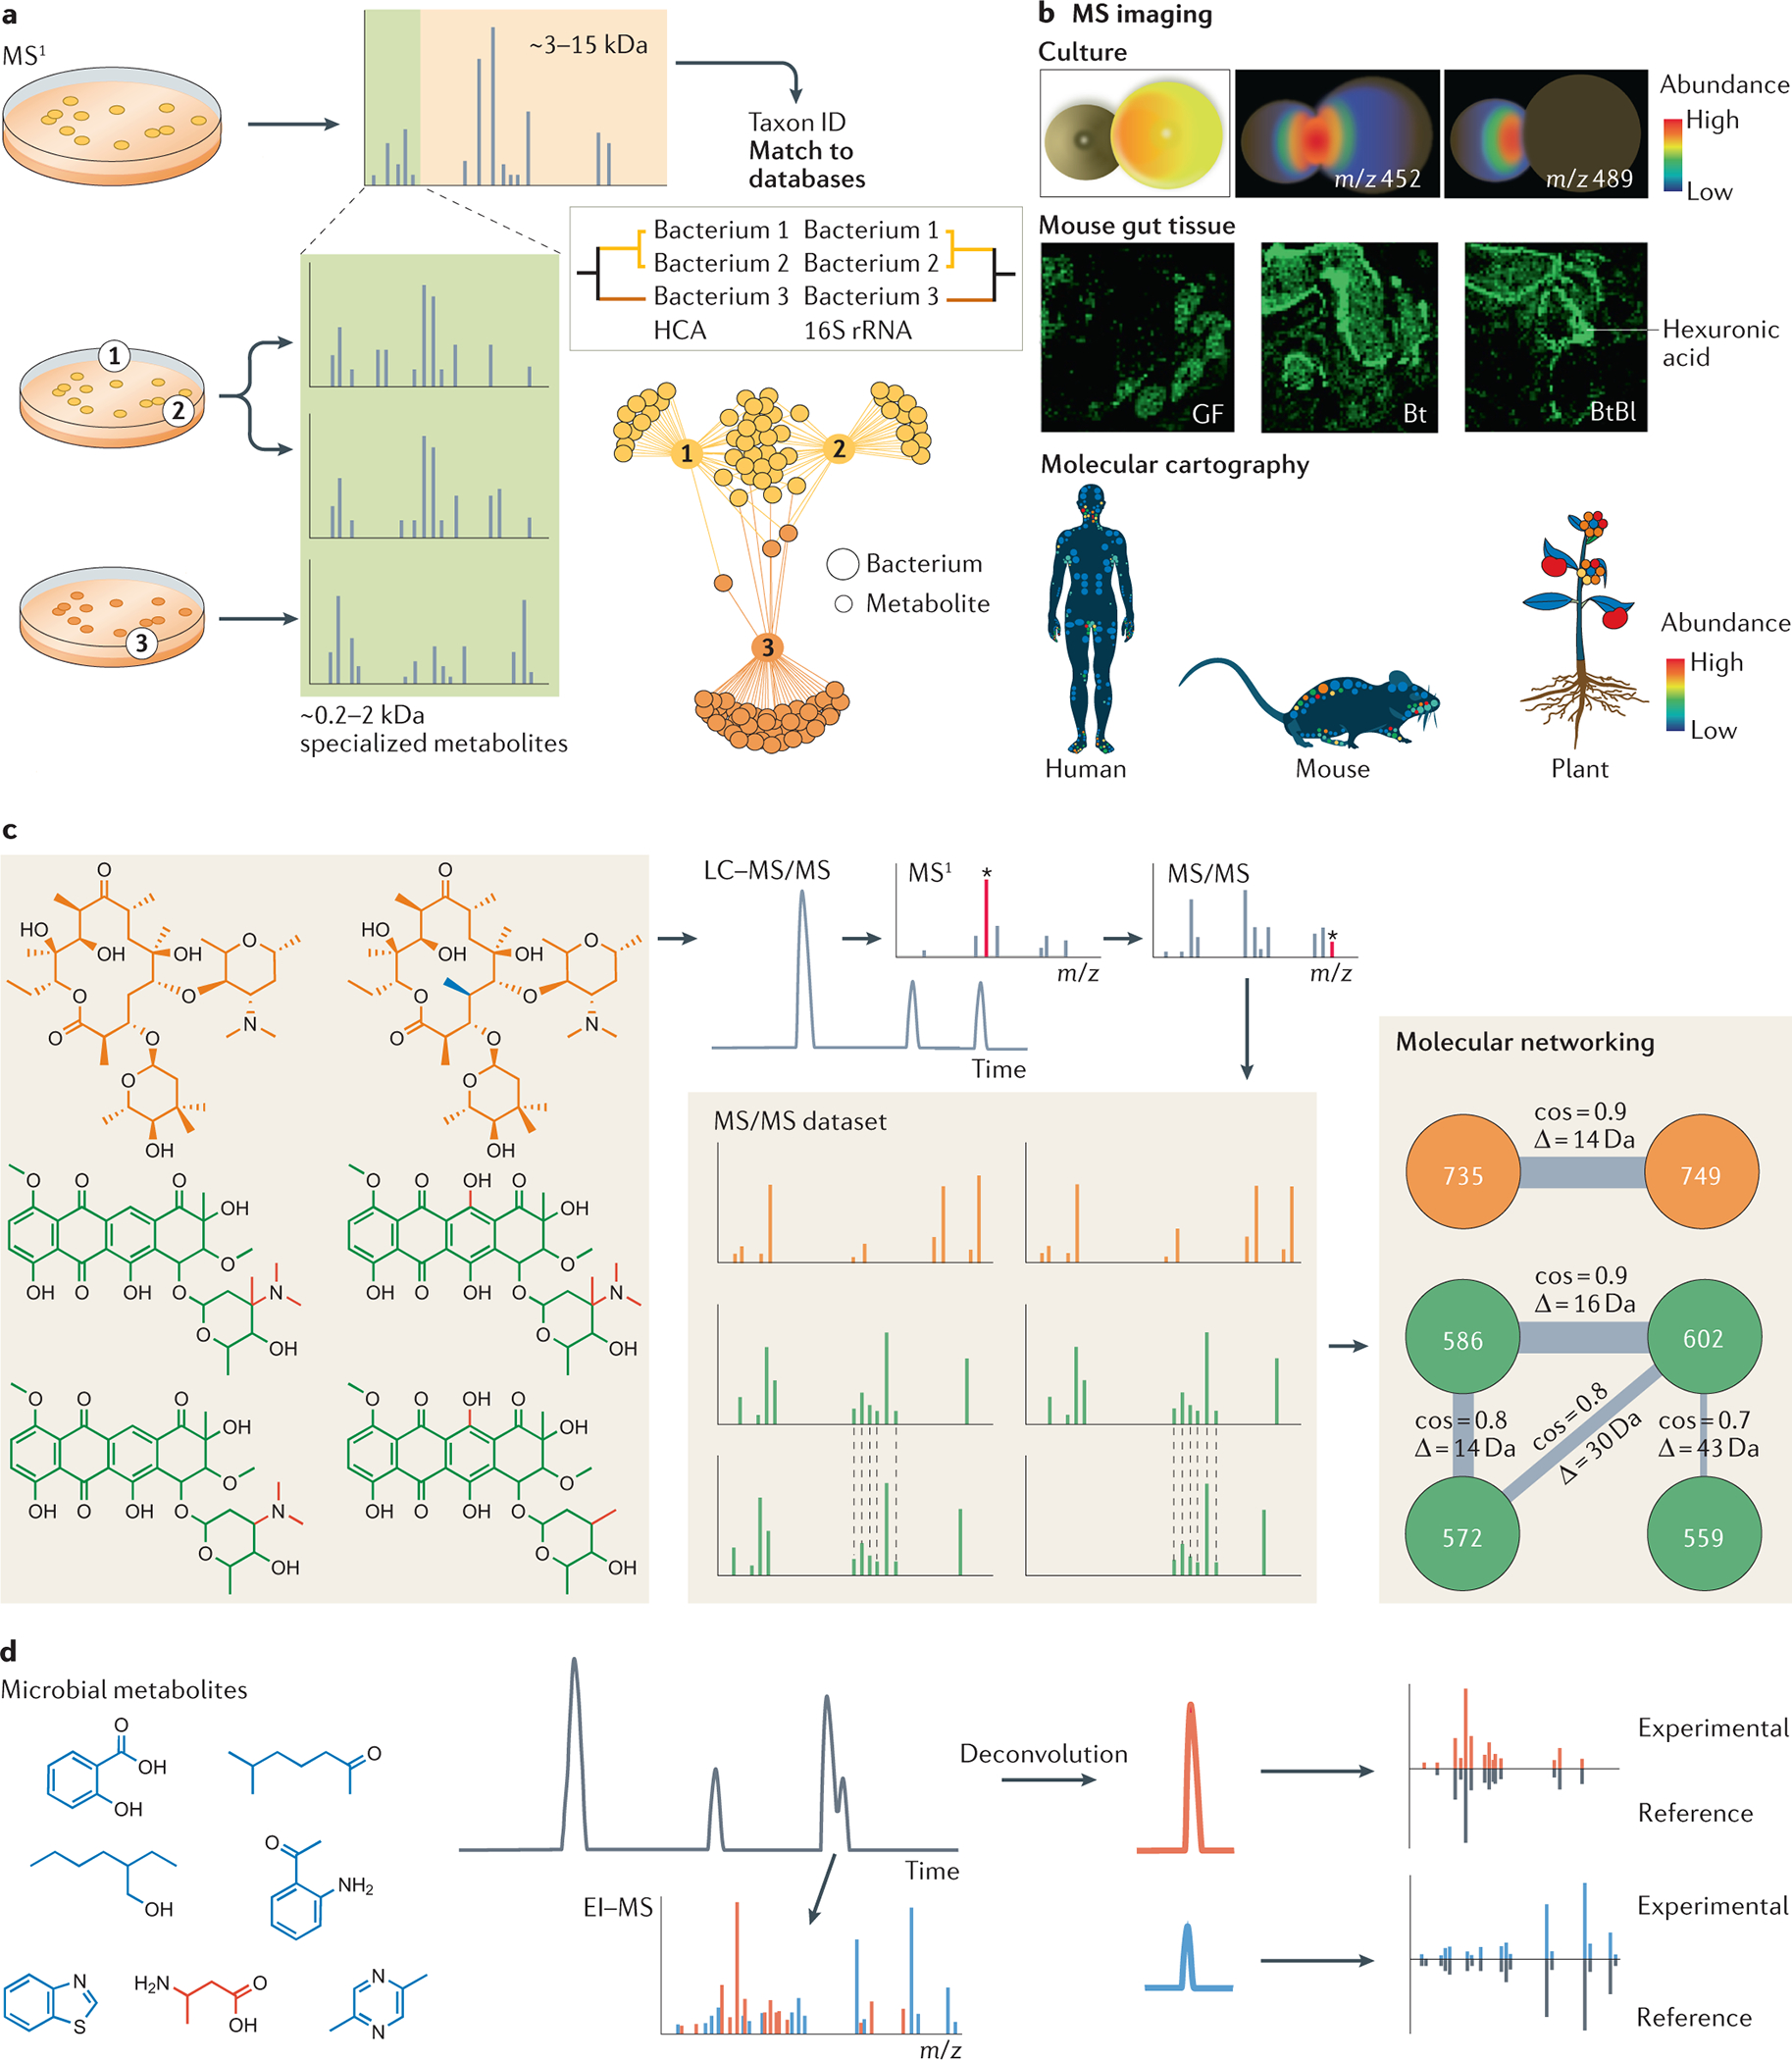
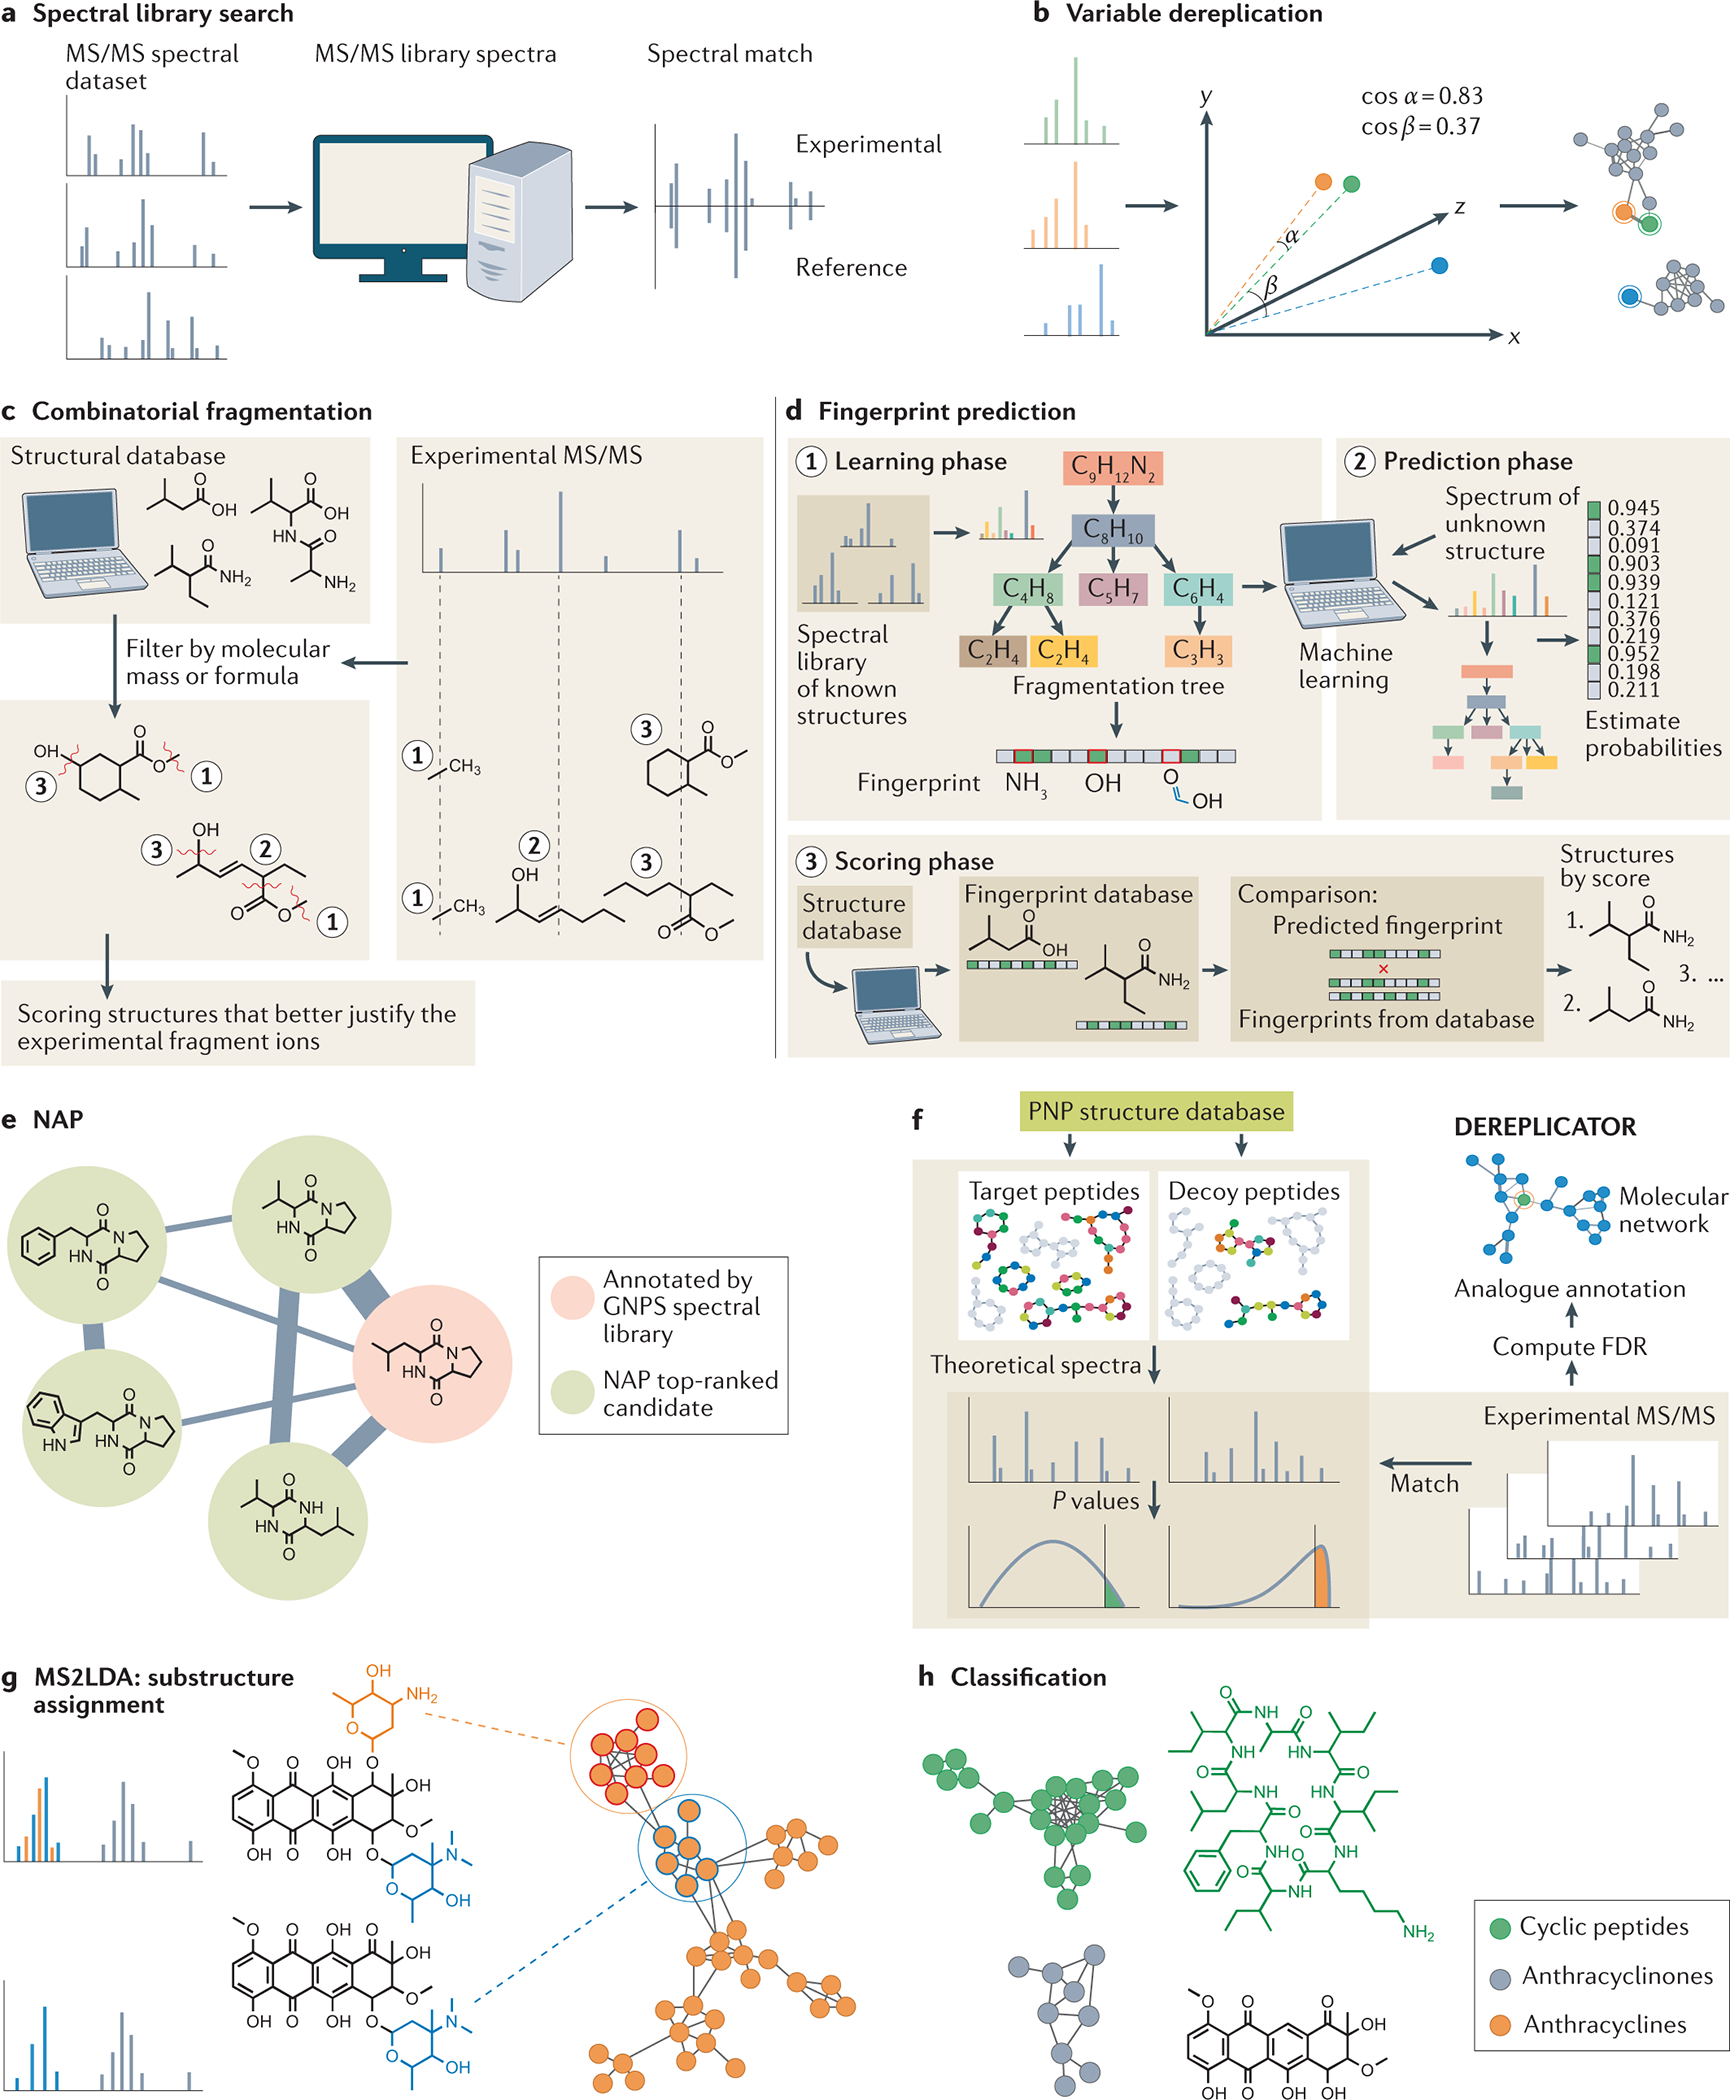
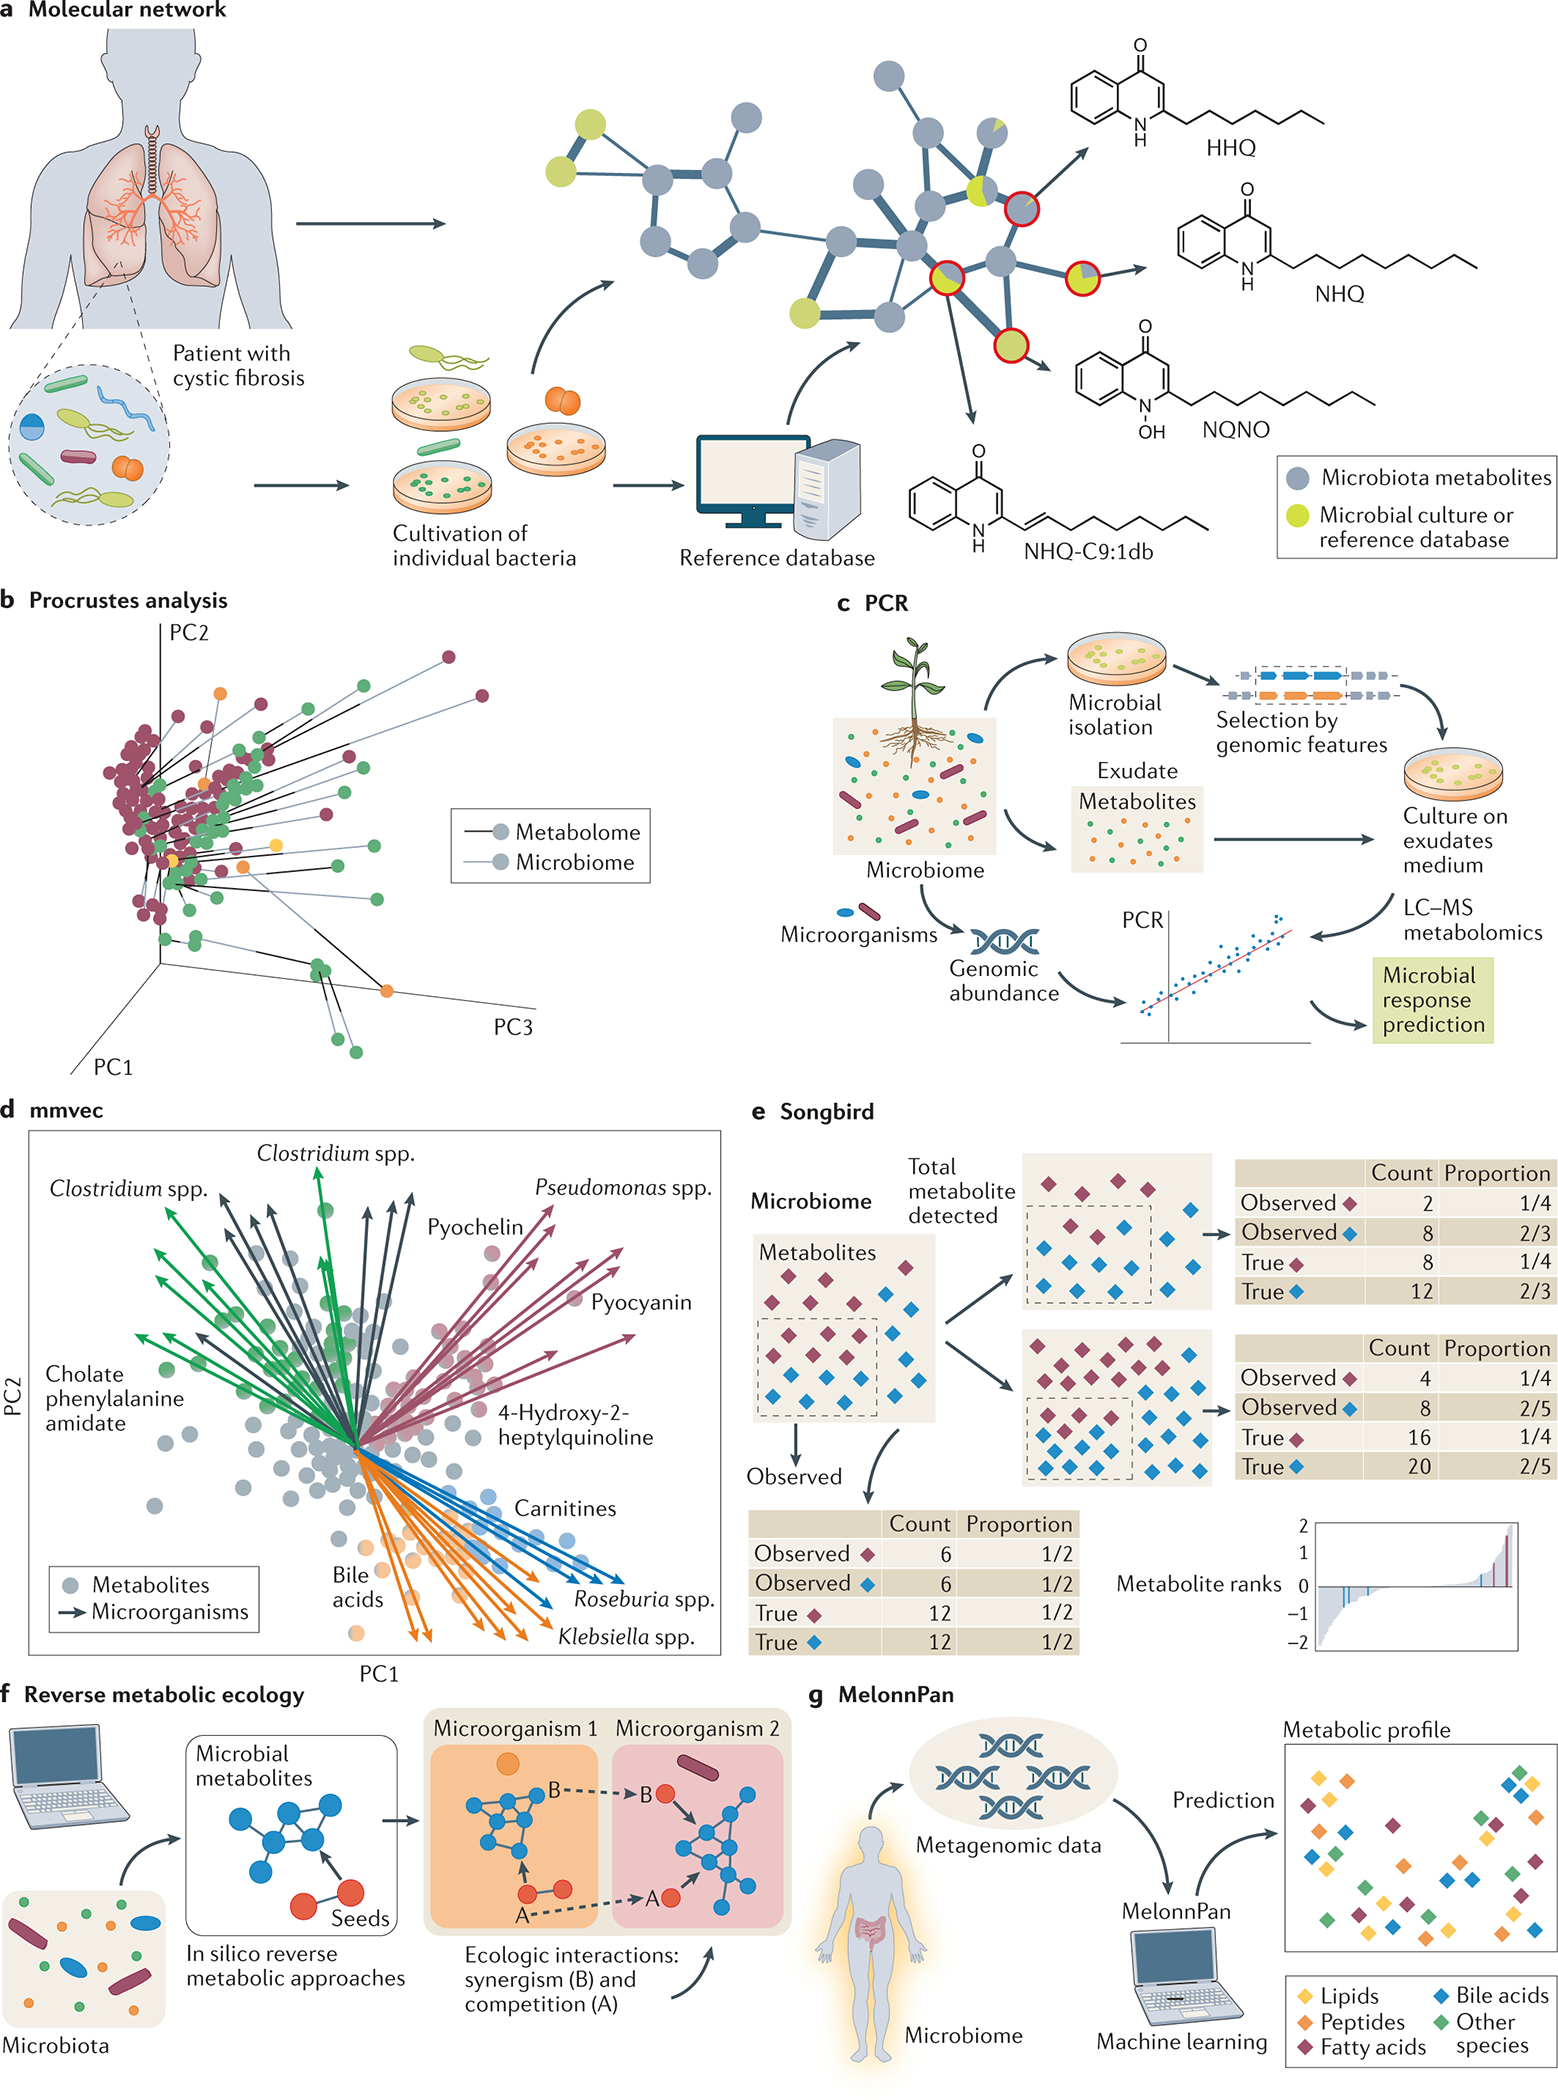
Microbiotas are a malleable part of ecosystems, including the human ecosystem. Microorganisms affect not only the chemistry of their specific niche, such as the human gut, but also the chemistry of distant environments, such as other parts of the body. Mass spectrometry-based metabolomics is one of the key technologies to detect and identify the small molecules produced by the human microbiota, and to understand the functional role of these microbial metabolites. This Review provides a foundational introduction to common forms of untargeted mass spectrometry and the types of data that can be obtained in the context of microbiome analysis. Data analysis remains an obstacle; therefore, the emphasis is placed on data analysis approaches and integrative analysis, including the integration of microbiome sequencing data.


Conflict of interest statement

Competing interests

The authors declare no competing interests.

Figures

Fig. 1:
Fig. 1:. Mass spectrometry metabolomics approaches for studying the microbiome.
a) MS1 acquired by matrix-assisted laser desorption-ionization mass spectrometry (MALDI-MS) enables bacterial taxon identification. The range of ribosomal proteins (3–15 kDa) is used to search for a match in spectral libraries, and the hierarchical clustering generated with these data strongly correlates with 16S rRNA. The range between 0,2–2 kDa shows specialized metabolites (molecular association network), . b) Illustrative examples of imaging MS. Interactions between microorganisms can be observed by co-culture experiments (top panel). Spatial distribution of hexuronic acid in the gut of different mice can be investigated (middle panel). The examples shown are from germ-free (GT) mice, mice mono-colonized with Bacteroides thetaiotaomicron (Bt), and mice bi-colonized with Bt and Bifidobacterium longum (Bl). and molecular cartography can reveal the 3D distribution of specific ions in humans, mice and plants (bottom panel). c) Microbial metabolites can be analyzed by liquid chromatography–tandem MS (LC-MS/MS). The precursor mass is selected in MS1 to be fragmented, generating the MS/MS spectra. Thousands of MS/MS spectra are generated in an untargeted analysis, which can be organized by molecular networking by spectral similarities. Spectral similarity is represented by cosine score (cos), the higher the cosine the higher the similarity. D is the mass difference between two nodes (precursor ions) d) Microbial small metabolites analyzed by electron ionization (EI-MS). Deconvolution is essential to separate spectra from co-eluting compounds. The spectra can be searched for a match in spectral libraries to annotate known compounds. Images in part b adapted from Ref .
Fig. 2:
Fig. 2:. Computational tools for metabolite annotation, substructure assessment and chemical classification.
a) Tandem mass spectrometry (MS/MS) spectra can be searched against the MS/MS spectral library (for example, GNPS [https://gnps.ucsd.edu/ProteoSAFe/static/gnps-splash.jsp]) and matched based on the number of product ion matches and cosine score. b) Variable dereplication (GNPS) allows the search of structurally related metabolites (analogs) with similar MS/MS spectral data by employing the cosine similarity method. c) MetFrag is a combinatorial fragmentation method that focuses on the explanation of the fragment peaks from an MS/MS spectrum based on substructures generated by disconnecting the bonds of the structures from structure databases. d) SIRIUS4 and ZODIAC use fingerprint prediction, a fragmentation tree method to predict fingerprints (substructure properties), to score possible structures by fingerprint similarity. e) Network annotation propagation (NAP) integrates variable dereplication and combinatorial fragmentation for annotation of analogs in molecular networks. f) DEREPLICATOR annotates nonribosomal peptides and ribosomally synthesized and post-translationally modified peptides based on hypothetical spectral fragments generated from peptide natural product (PNP) structures present in structural databases, considering the false discovery rate (FDR). In addition, this tool can be used to annotate analogs by variable dereplication and also to calculate statistical significance computing false discovery rates [G]. g) MS2LDA recognizes substructures and their co-occurrence in an MS/MS dataset h) MolNetEnhancer uses such substructure information, along with ClassyFire algorithm, to classify the chemical groups present in the dataset.
Fig. 3:
Fig. 3:. Data analysis tools to uncover microbiome-derived molecules.
a) Molecular networks can attribute the producer of specific metabolites detected in microbiome, from cultured systems or reference databases. b) Procrustes analysis allows integration of omics data based on canonical correlation. The results are summarized in a low-dimensional space representation known as principal components (PC1, PC2 and PC3) c) Principal component regression (PCR) is a statistical method based on regression analysis and principal component (analysis. In the example, metabolomics and metagenomics data were integrated to investigate the microbial response to plant growth. d) mmvec uses co-occurrence probabilities to predict microorganism–metabolite interactions from metabolomic data and is visualized with a biplot. The results are shown in three-dimension space and the illustration shows two principal components (PC1 and PC2). e) Songbird introduced ‘reference frames’ by using ratios to compute the abundance of compositional data overcoming common pitfalls in comparing relative abundances across samples. f) Ecological interactions, such as competition or synergistic (for example, symbiosis), can be predicted by reverse metabolic ecology. Seeds are known as specific metabolites used to evaluate the interaction. g) MelonnPan is a machine learning method, trained with metabolomics and metagenomics data, aiming to predict the metabolome of microbial communities, including those metabolites usually not observed by common analytical techniques.

References

    1. Consortium THMP & The Human Microbiome Project, C. Structure, function and diversity of the healthy human microbiome. Nature 486, 207–214 (2012). - PMC - PubMed
    1. Sender R, Fuchs S & Milo R Are We Really Vastly Out numbered? Revisiting the Ratio of Bacterial to Host Cells in Humans. Cell 164, 337–340 (2016). - PubMed
    1. Sharon G et al. Human Gut Microbiota from Autism Spectrum Disorder Promote Behavioral Symptoms in Mice. Cell 177, 1600–1618.e17 (2019). - PMC - PubMed
    1. Claesen J et al. Cutibacterium acnes antibiotic production shapes niche competition in the human skin microbiome.
    1. Garg N et al. Natural products as mediators of disease. Nat. Prod. Rep. 34, 194–219 (2017). - PMC - PubMed

Publication types