. 2021 Sep;3(9):1217-1227.
doi: 10.1038/s42255-021-00449-w. Epub 2021 Sep 22.

Gene-by-environment modulation of lifespan and weight gain in the murine BXD family

Affiliations

Gene-by-environment modulation of lifespan and weight gain in the murine BXD family

Suheeta Roy et al. Nat Metab. 2021 Sep.

Abstract

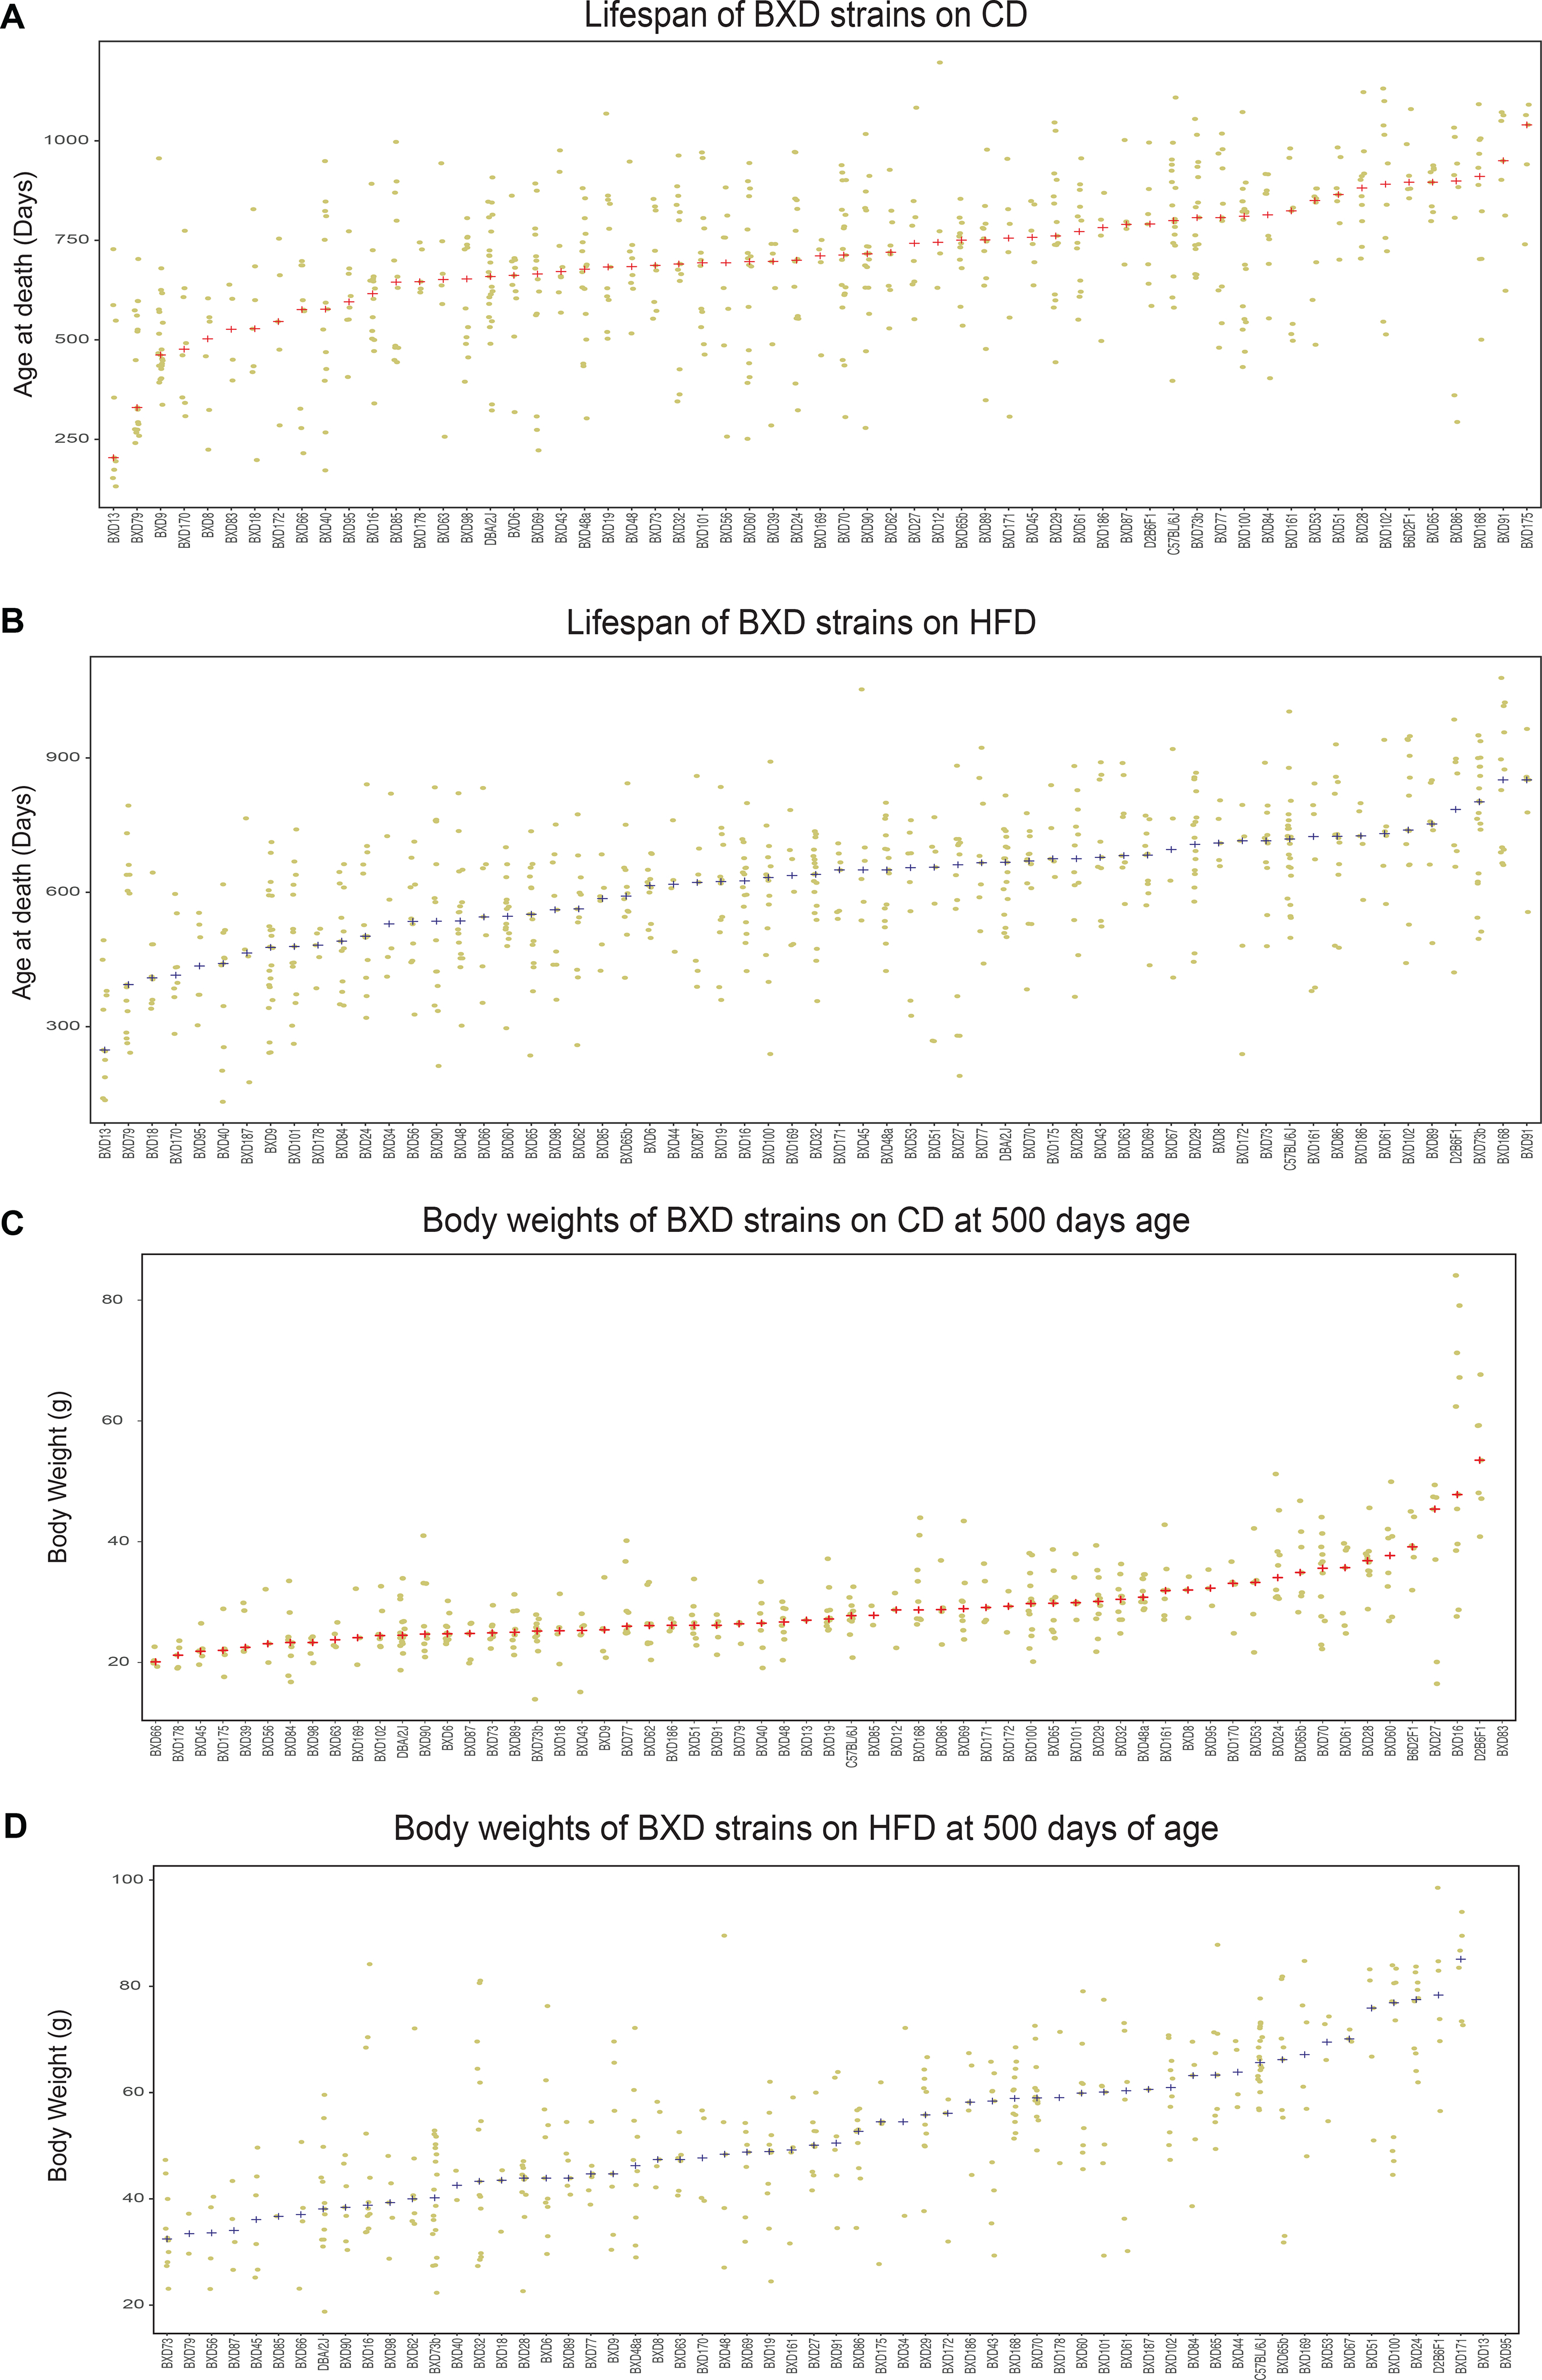
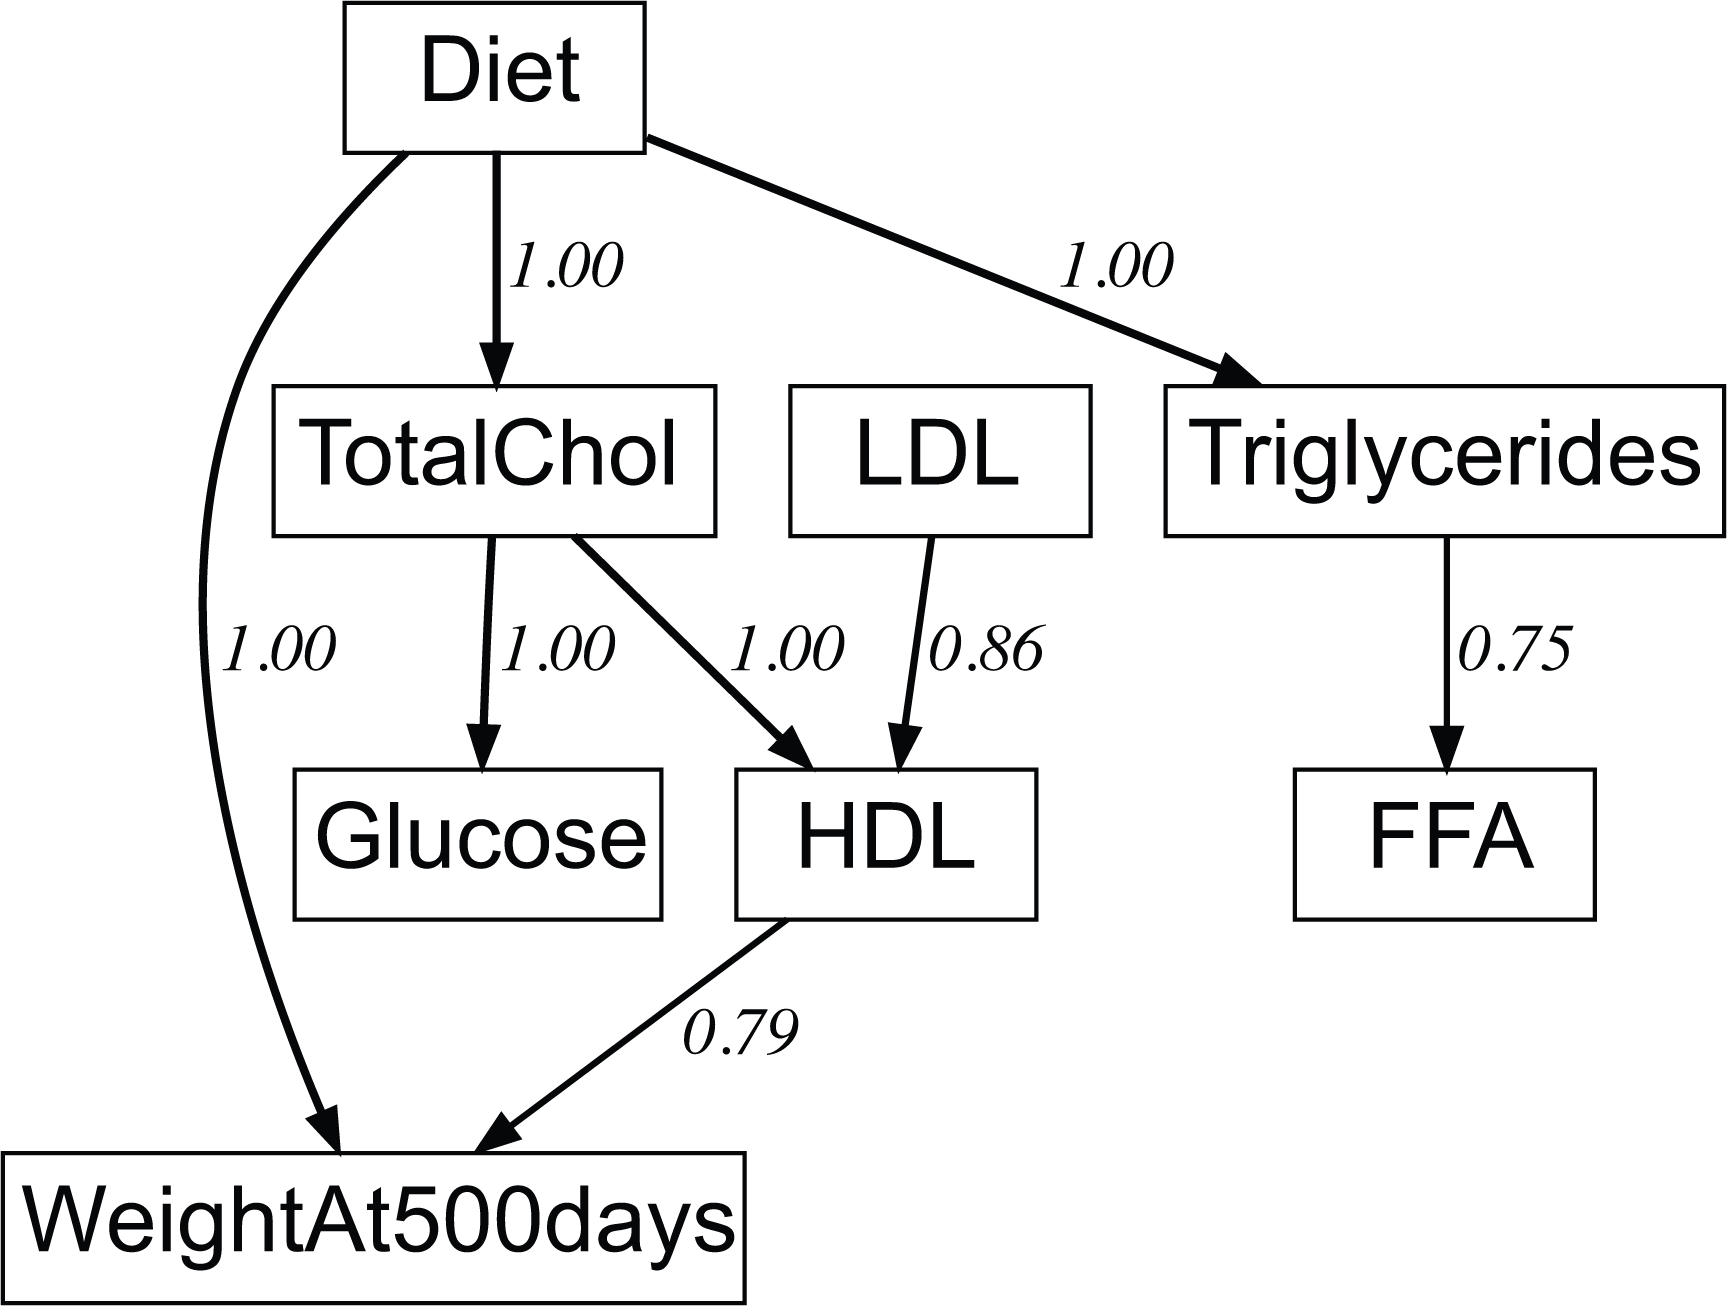
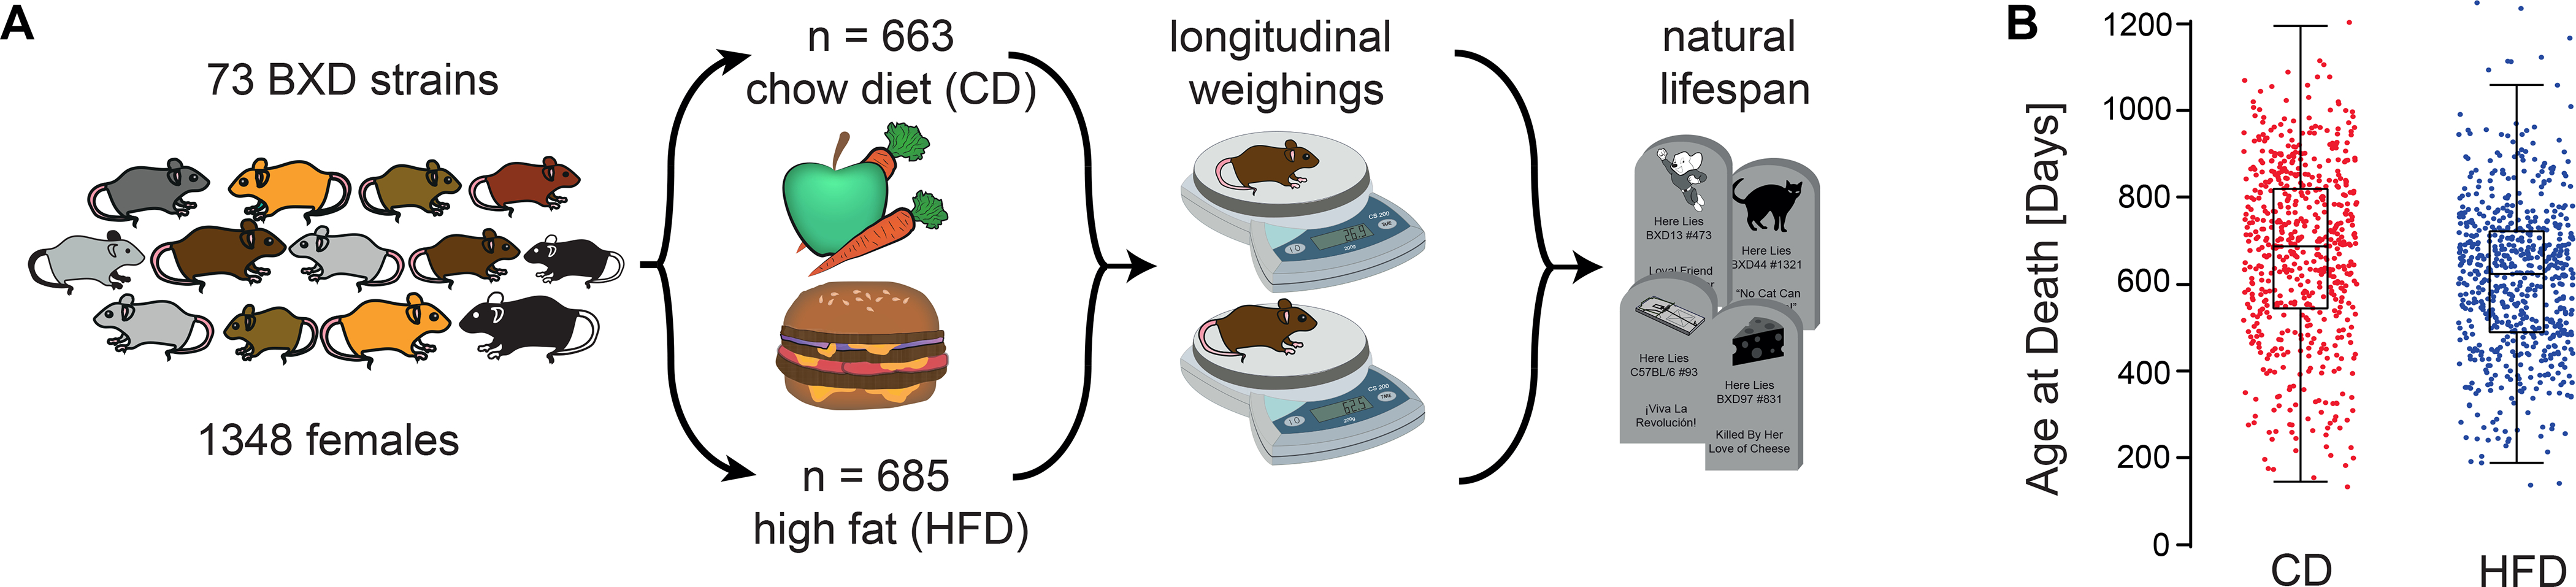
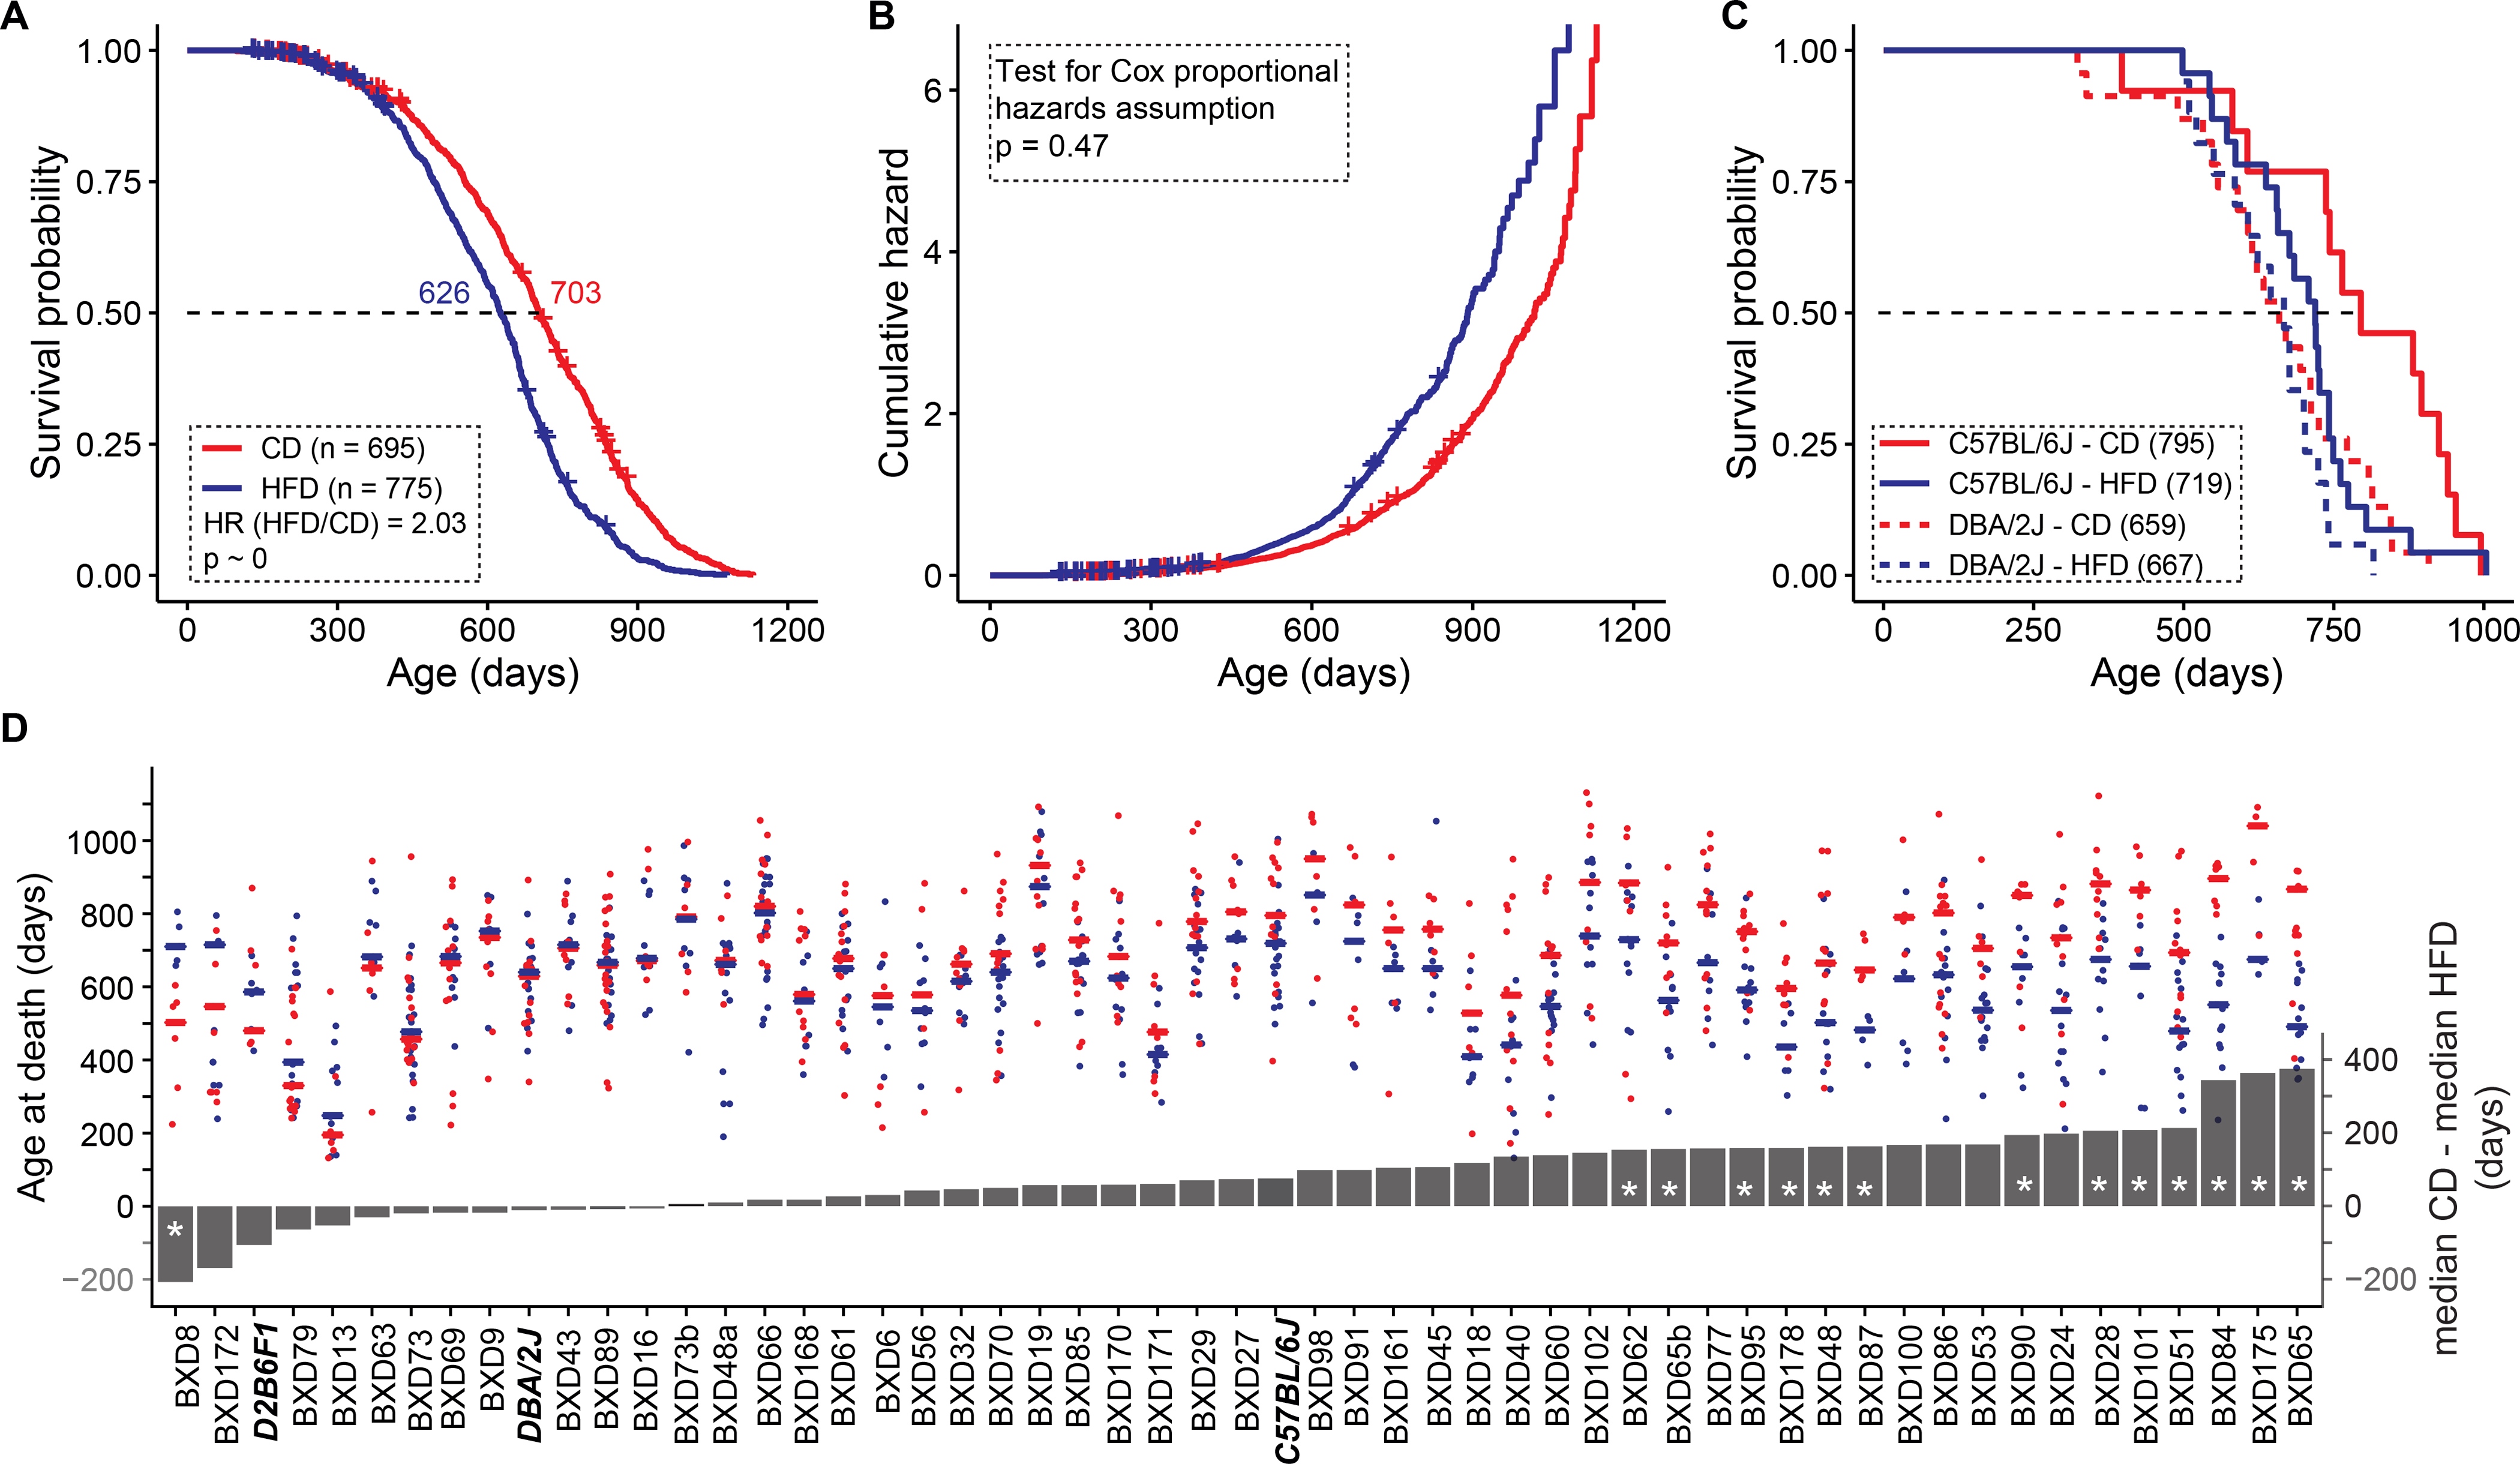
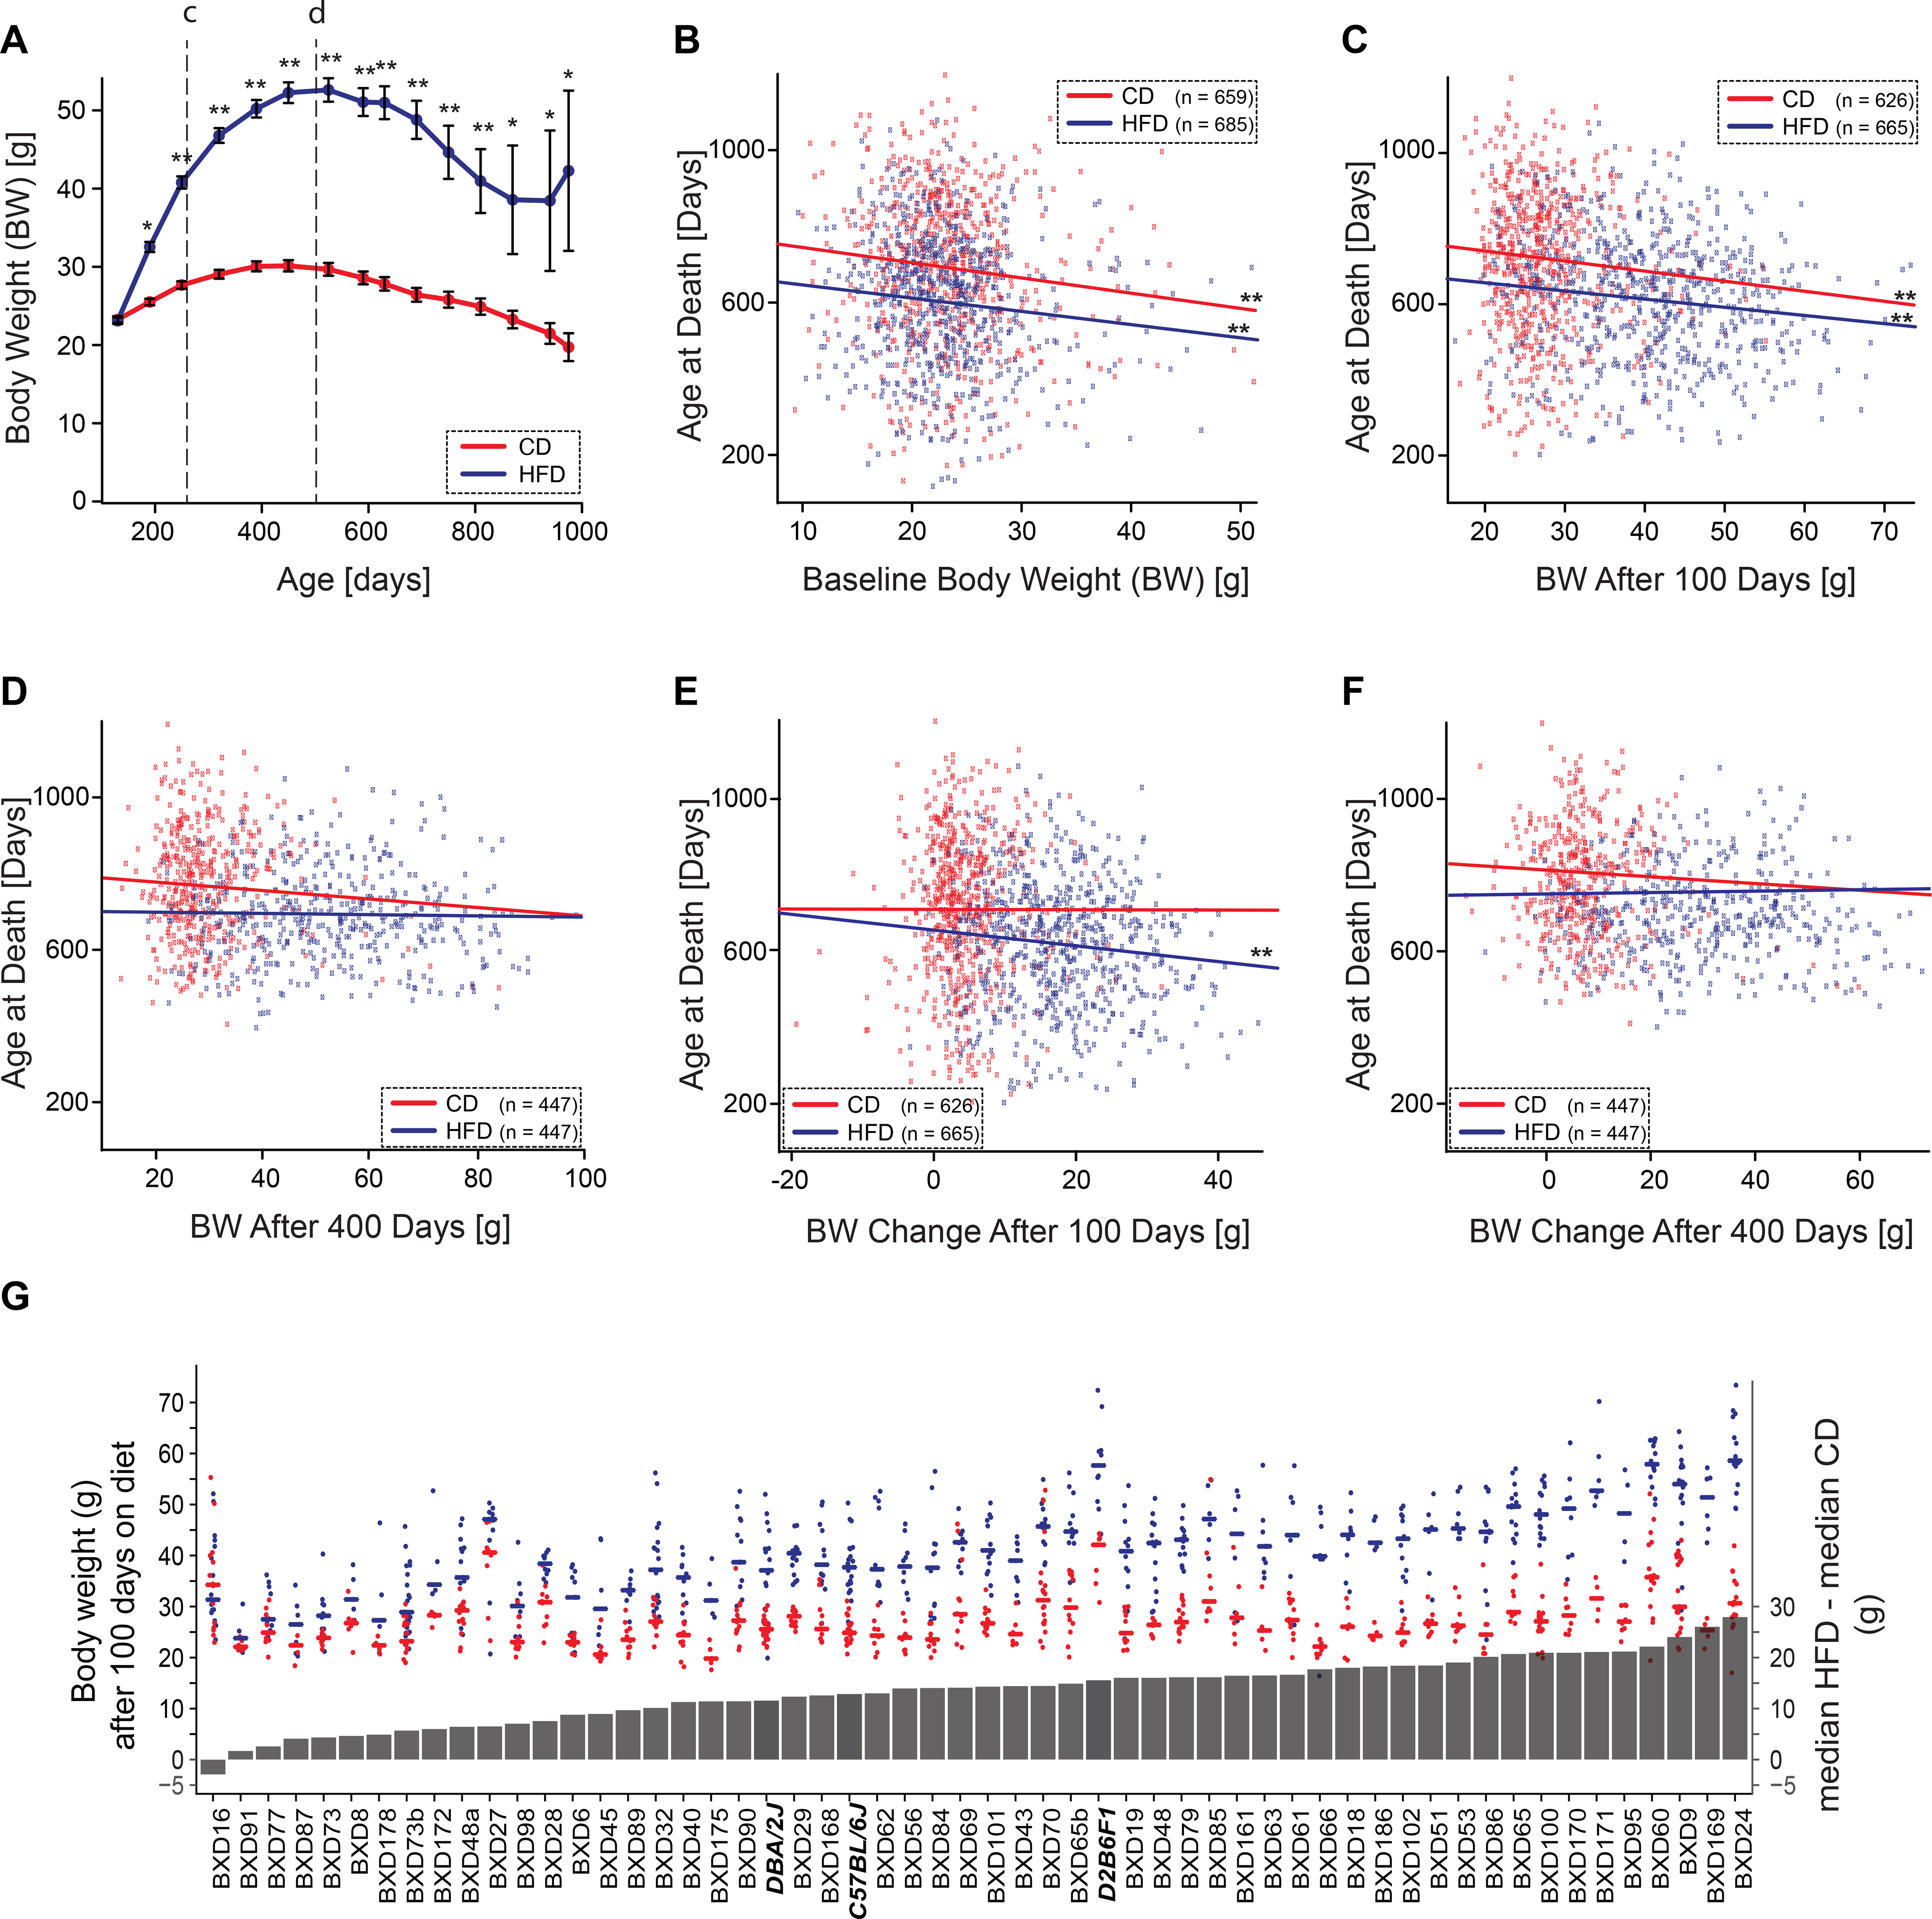
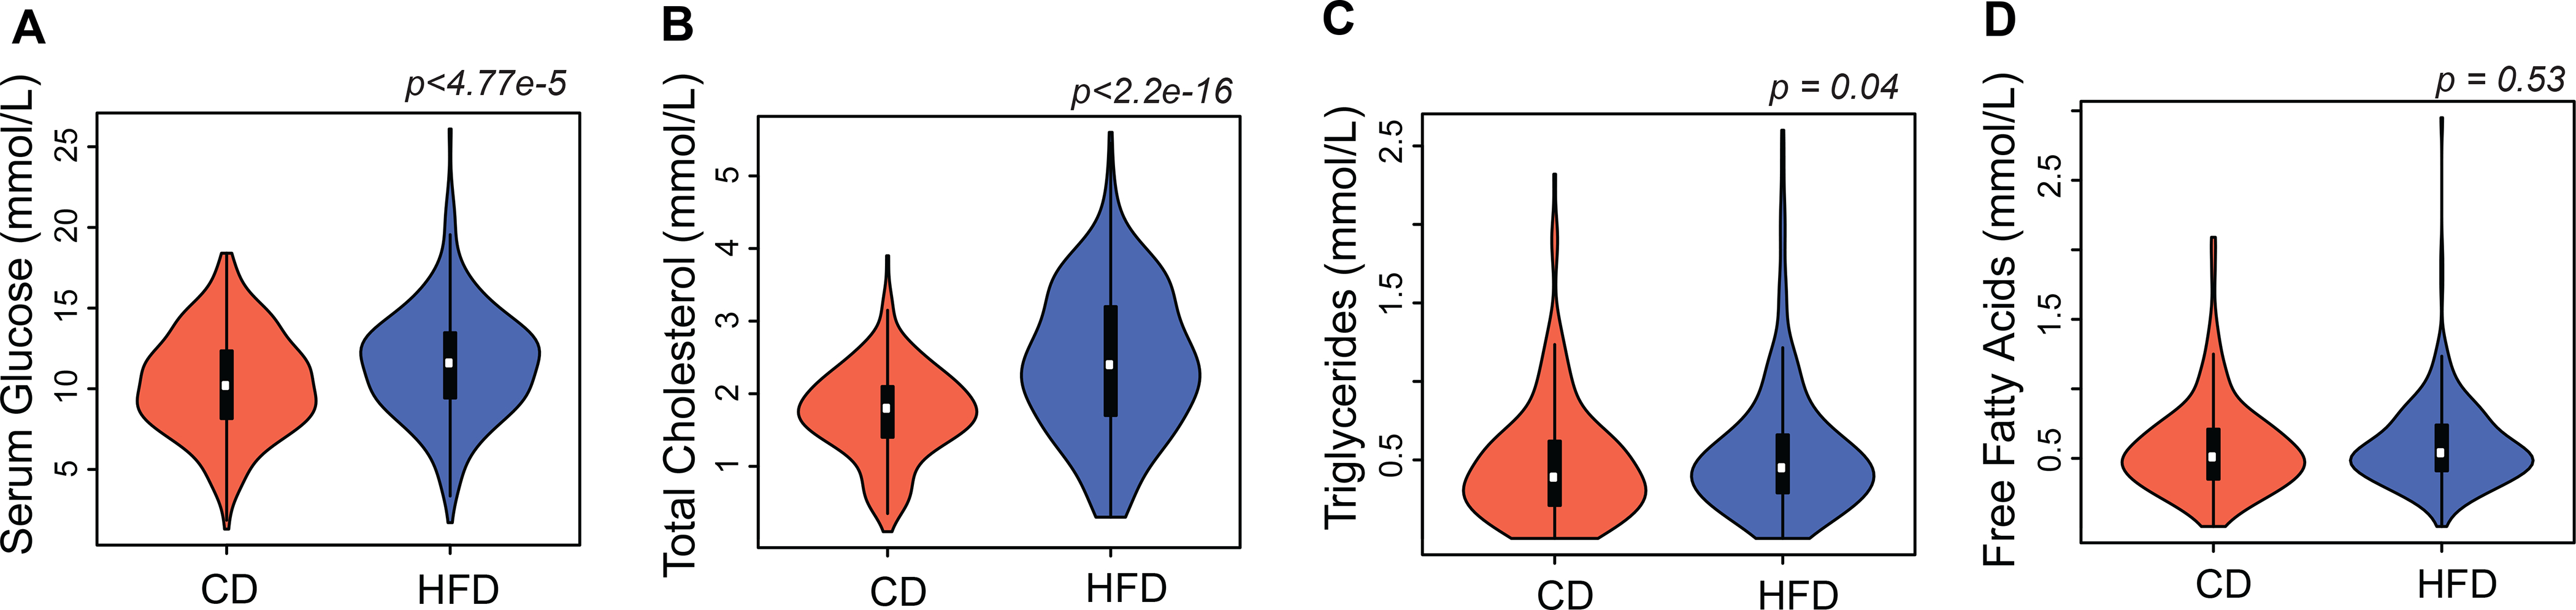
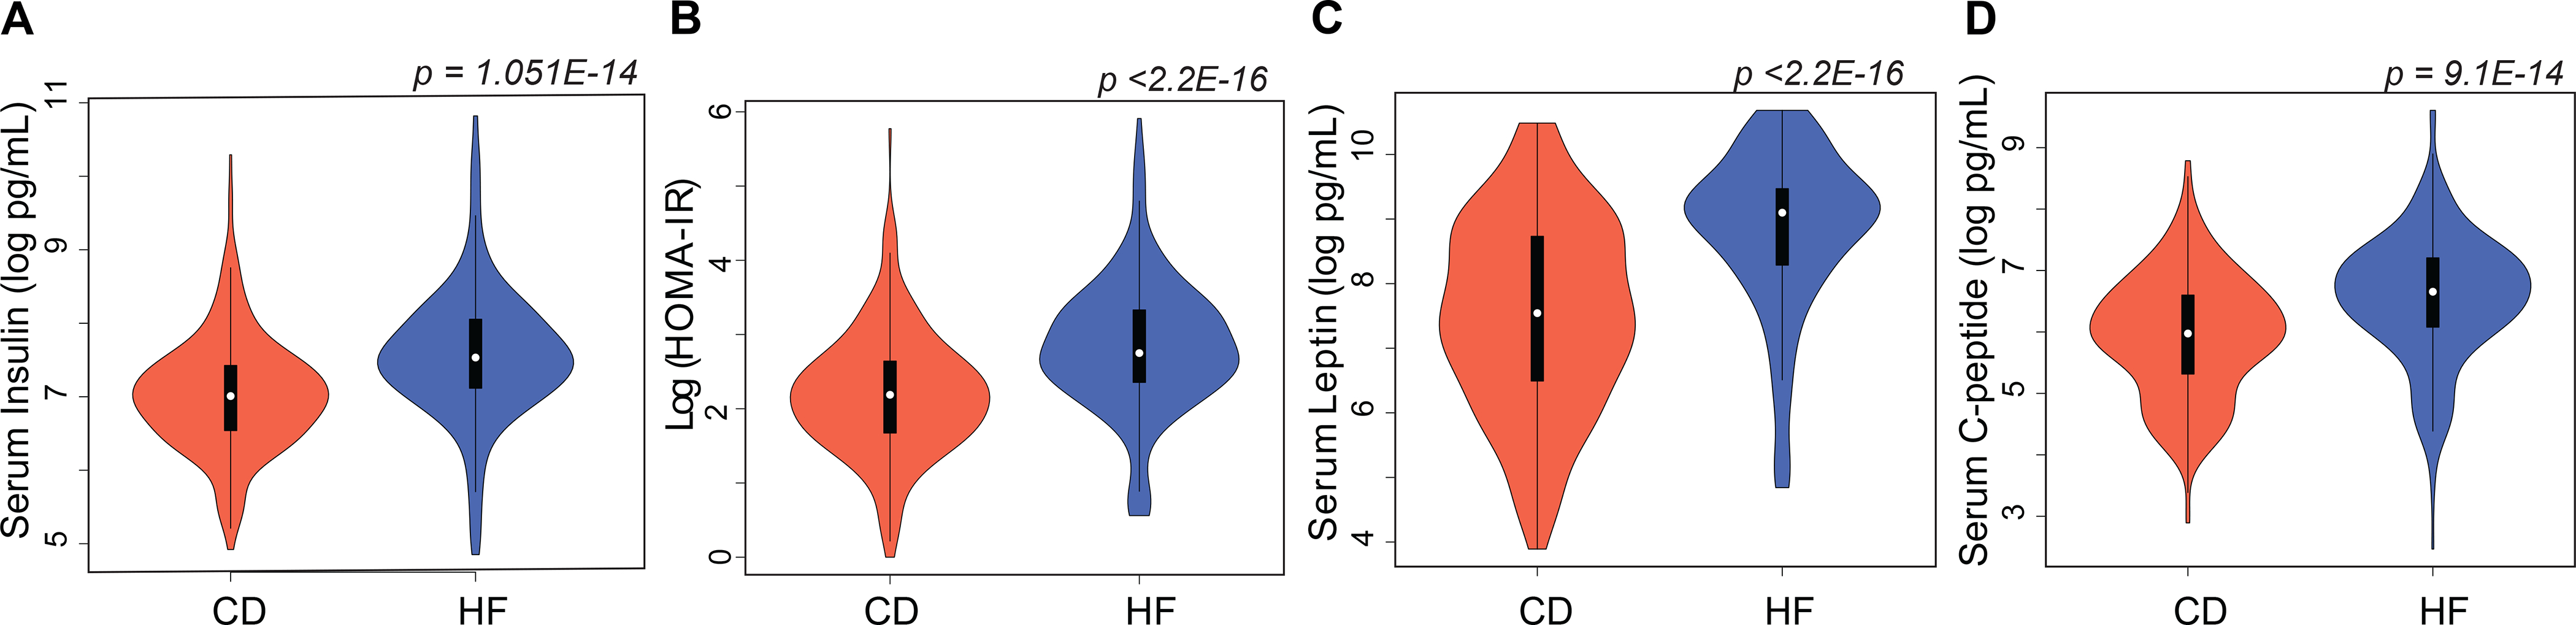
How lifespan and body weight vary as a function of diet and genetic differences is not well understood. Here we quantify the impact of differences in diet on lifespan in a genetically diverse family of female mice, split into matched isogenic cohorts fed a low-fat chow diet (CD, n = 663) or a high-fat diet (HFD, n = 685). We further generate key metabolic data in a parallel cohort euthanized at four time points. HFD feeding shortens lifespan by 12%: equivalent to a decade in humans. Initial body weight and early weight gains account for longevity differences of roughly 4-6 days per gram. At 500 days, animals on a HFD typically gain four times as much weight as control, but variation in weight gain does not correlate with lifespan. Classic serum metabolites, often regarded as health biomarkers, are not necessarily strong predictors of longevity. Our data indicate that responses to a HFD are substantially modulated by gene-by-environment interactions, highlighting the importance of genetic variation in making accurate individualized dietary recommendations.


Conflict of interest statement

Competing interests: The authors declare no competing interests related to this work.

Figures

Extended Data Fig. 1
Extended Data Fig. 1. Diet effect on lifespan and body weight at 500 days of age
Related to Figure 1 and Figure 3. Diet effect on lifespan and body weight at 500 days of age (A) Data points represent lifespan of animals on low fat chow diet (CD) in BXDs with n ≥ 4 per strain. Red + denotes the strain median. (B) Data points represent lifespan on the high fat diet (HFD) in BXDs with n ≥ 4 per strain. Blue + denotes the strain median. (C) Data points represent body weight on CD at 500 days of age in BXDs with n ≥ 4 per strain. Red + denotes the strain median. (D) Data points represent body weight on HFD at 500 days of age in BXDs with n ≥ 4 per strain. Blue + denotes the strain median.
Extended Data Fig. 2
Extended Data Fig. 2. A Bayesian Network model of the impact of diet on serum metabolites and lifespan and peak body weight at 500 days age.
A Bayesian network model of the impact of diet on serum metabolites and lifespan and peak body weight at 500 days age. Edge weights in this network are the weighted fraction of best 1000 Bayesian models that have the same edge and polarity. A value of 1.0 means every one of 1000 “top-ranked models” has this edge. The upper 6 nodes are serum metabolites, and lifespan and body weight at 500 days age are the final outcomes.
Figure 1.
Figure 1.
Study overview. (A) Balanced sets of females from 73 BXD strains and their parents were assigned to the low-fat chow diet (CD) or the high fat (HFD) diet and weighed every other month. (B) High fat diet modulates lifespan. When grouped by diet—irrespective of genetic background—median lifespan of CD (n = 663) cohort exceeded by 77 days that of the HFD (n = 685) cohort (see inset for box plot which spans from 25th to 75th percentile, with centerline at median, whiskers extend to maximum and minimum data points which is no more than 1.5 times the length of the box away from the box). Red and blue dots represent individuals on CD and HFD, respectively. For strain averages of lifespan in the two cohorts see Extended figure E1, panels A and B.
Figure 2.
Figure 2.
Diet influence on lifespan in female mice (A) Median lifespan decreased by 77 days on HFD. Cases fed HFD have a two-fold higher risk of death compared to those fed CD. (B) Cumulative hazard curves by diet do not cross and the hazards ratio of 2.0 is relatively constant throughout the study. (C) The lifespan of C57BL/6J, but not DBA/2J, is influenced by diet. Numbers in parentheses are median lifespans in days. (D) Lifespan on a high fat diet depends strongly on strain. Red points represent lifespans of cases on CD and blue points those on HFD. Lines represent median survival (left y axis). Grey bars represent the difference in median survival on the diets (right y axis). Negative values to the left indicate higher survival on HFD, positive values indicate higher survival on CD. Parental strains and F1 are denoted by bold italics font. Asterisks in bars denote significant FDR scores at a q value of 0.1. Censored cases in A–B are still alive and are marked by + signs.
Figure 3.
Figure 3.
Effect of body weight on lifespan. Effects of body weight on lifespan across all strains were analyzed using fixed-effects linear model in R. Correlations are Pearson’s r. (A) Body weight by diets and age (CD, red line and HFD, blue line). Data are presented as mean ± SEM. Single and double asterisks denote significance at p <0.05 and <0.001. Body weight declines on both diets after about 500 days of age. (B) Initial body weight—the weight taken at entry into colony prior to the point of any animal being shifted to the HFD—has a modest but consistent negative slope with lifespan (–6 days/g, p = 0.0006, r = 0.1) that is not exacerbated by the HFD (n = 659 on CD, 685 on HFD). (C) Body weight after 100 days on both diets (~260 days age) correlates negatively with lifespan (–4 days/g, p <0.001, r = 0.3, see line labeled c in Panel A) (n = 626 on CD, 665 on HFD). (D) Early weight change in response to HFD (blue line)—the difference from baseline after 100 days on diet—was negatively related with lifespan (–4 days/g, p = 0.004, r = 0.1), but this is not true of cases remaining on CD. (E) After 400 days on diet (~500 days age), body weight does not predict variance in lifespan (see line labeled d in Panel A) (p = 0.63, r = 0.01) (n = 447 on CD and HFD). (F) Substantial weight change after prolonged HFD feeding—difference from baseline to 400 days on diet (blue line)—does not predict lifespan (p = 0.26, r = 0.02). (G) Strain-wise changes in median weight after 100 days on diets. Red points represent lifespans of cases on CD and blue points those on HFD. Lines represent median body weight (left y axis). Grey bars represent differences in median body weight on the diets (right y axis). Parental strains and F1 hybrids are denoted by bold italic font. Strain averages of body weight at 500 days of age in the two cohorts are shown in Extended figure E1, panels C and D.
Figure 4.
Figure 4.
Diet effect on serum metabolites. Violin plots of (A) Glucose (B) Total cholesterol (C) Triglycerides (D) Free fatty acids on CD (n = 255) and HFD (n = 254), across ~30 BXD strains. See inset for box plot which spans from 25th to 75th percentile, with centerline at median, whiskers extend to maximum and minimum data points which is no more than 1.5 times the length of the box away from the box. HFD significantly elevated circulating levels of serum glucose (p <4.77E-5), total cholesterol (p <2.2E-16), triglycerides (p = 0.04) while free fatty acid levels did not change significantly with diet (p = 0.53). Statistical significance determined by two-sided Welch’s t-test.
Figure 5.
Figure 5.
Diet effect on serum metabolic hormones. Violin plots of (A) insulin (B) HOMA-IR (C) leptin (D) C-peptide on CD (n = 312) and HFD (n = 302), across ~50 BXD strains. HOMA-IR was calculated as fasting serum insulin (uIU/mL) multiplied by fasting glucose (mg/dL). See inset for box plot which spans from 25th to 75th percentile, with centerline at median, whiskers extend to maximum and minimum data points which is no more than 1.5 times the length of the box away from the box. HFD significantly elevated circulating levels of serum insulin (p = 1.051E-14), HOMA-IR (p <2.2E-16), leptin (p <2.2E-16), and C-peptide (p = 9.1E-14). Statistical significance determined by two-sided Welch’s t-test.

References

    1. Hook M et al.Genetic cartography of longevity in humans and mice: Current landscape and horizons. Biochim. Biophys. Acta 1864, 2718–2732 (2018). - PMC - PubMed
    1. Kuningas M et al.Genes encoding longevity: from model organisms to humans. Aging Cell 7, 270–280 (2008). - PubMed
    1. de Magalhães JP, Wuttke D, Wood SH, Plank M & Vora C Genome-environment interactions that modulate aging: Powerful targets for drug discovery. Pharmacol. Rev. 64, 88–101 (2012). - PMC - PubMed
    1. McDaid AF et al.Bayesian association scan reveals loci associated with human lifespan and linked biomarkers. Nat. Commun. 8, 15842 (2017). - PMC - PubMed
    1. Fontana L & Partridge L Promoting health and longevity through diet: From model organisms to humans. Cell 161, 106–118 (2015). - PMC - PubMed

Publication types